26-year anniversary of the May 3, 1999 tornado outbreak in Oklahoma
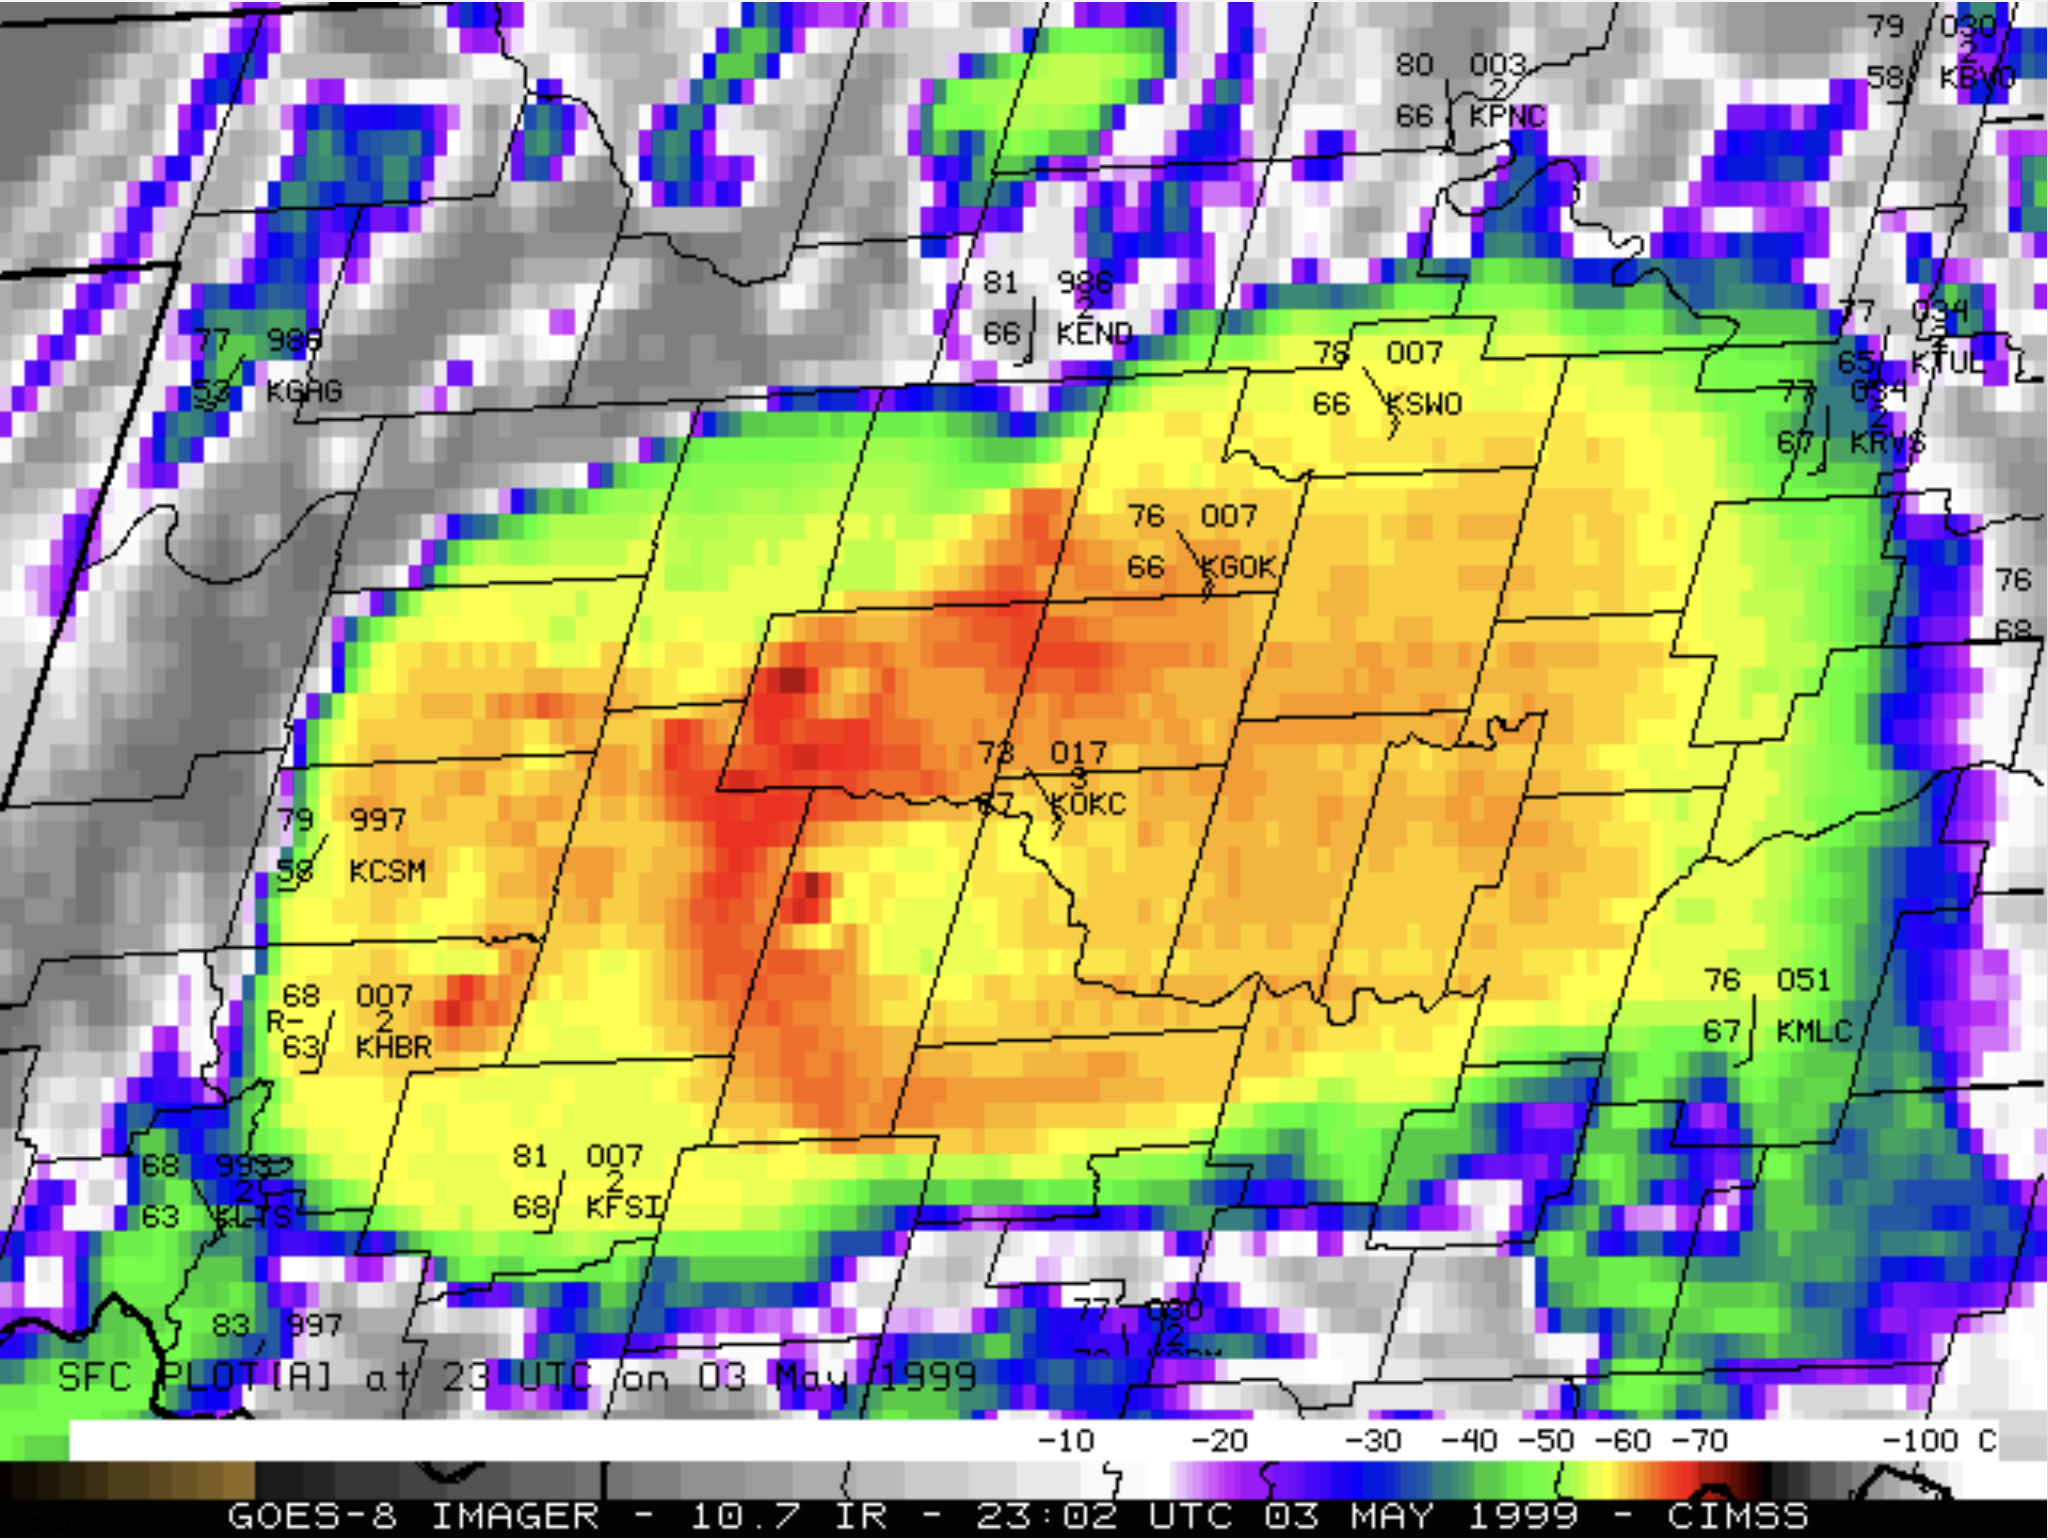
A significant outbreak of tornadoes occurred across Oklahoma and Kansas during the afternoon and evening hours on 03 May 1999 — and hail as large as 4.50 inches in diameter was reported in parts of Texas and Oklahoma (Storm Reports). NWS damage surveys indicated that widespread F4 and F5 tornado damage occurred. NOAA GOES-8... Read More

