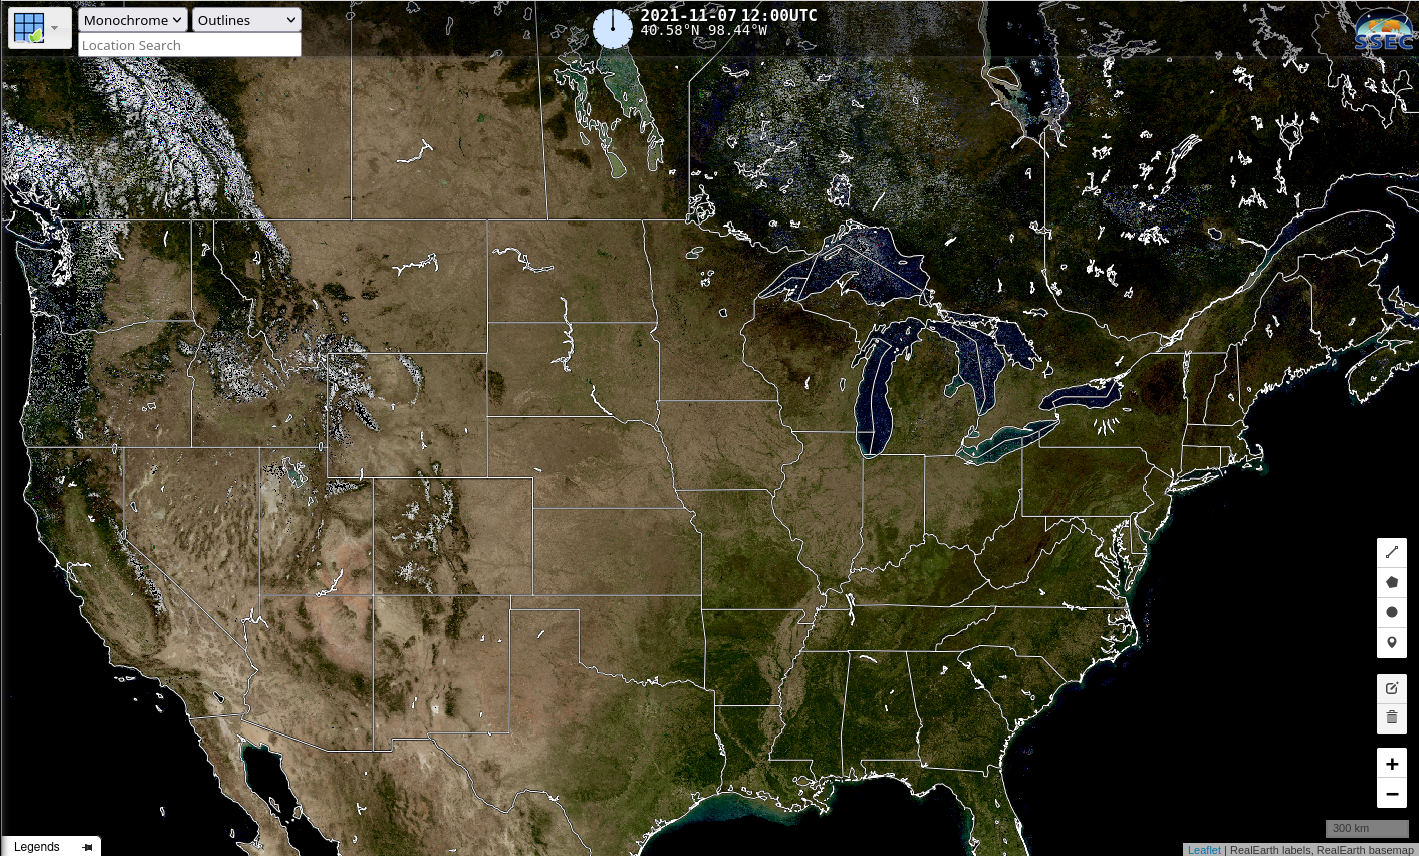
Quiz Time: What county in the USA has all boundaries visible from satellite?
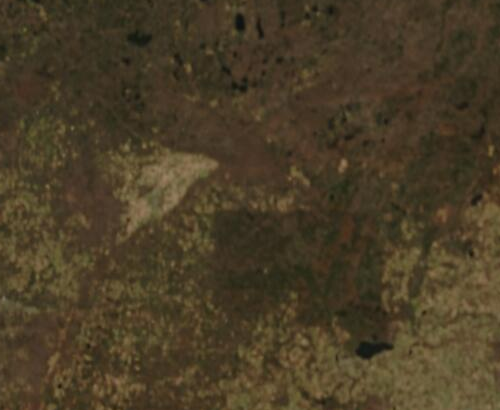
MODIS-derived (from Terra and Aqua satellites) Bidirectional Reflectance Distribution Function (BRDF), above, (as noted in this blog post), shows the (meager) snow distribution as of early December. How many counties (or parishes) in the United States (out of more than 3000!) are clearly delineated in Satellite Imagery such as what is shown... Read More