VIIRS views Severe Clear over the Great Lakes
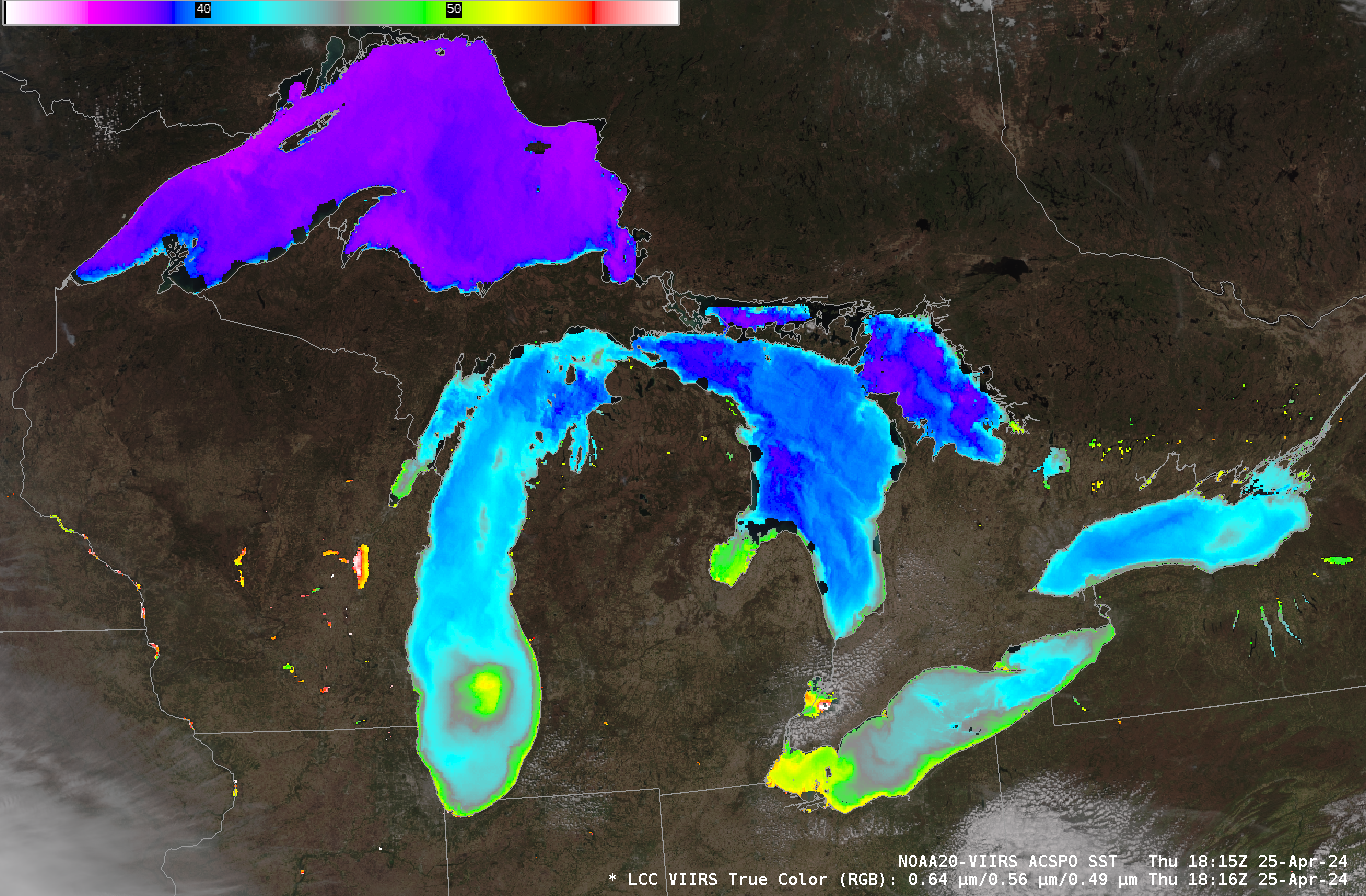
High Pressure over the Great Lakes on 25 April meant a spectacular true-color view of the 5 Great Lakes (apologies to Lake Champlain) by the VIIRS instruments on NOAA-20. A similar view was recorded at 1755 UTC by Suomi-NPP, shown below.Clear skies also meant a determination of Lake Surface Temperatures, shown below (compare these to Monday,... Read More
