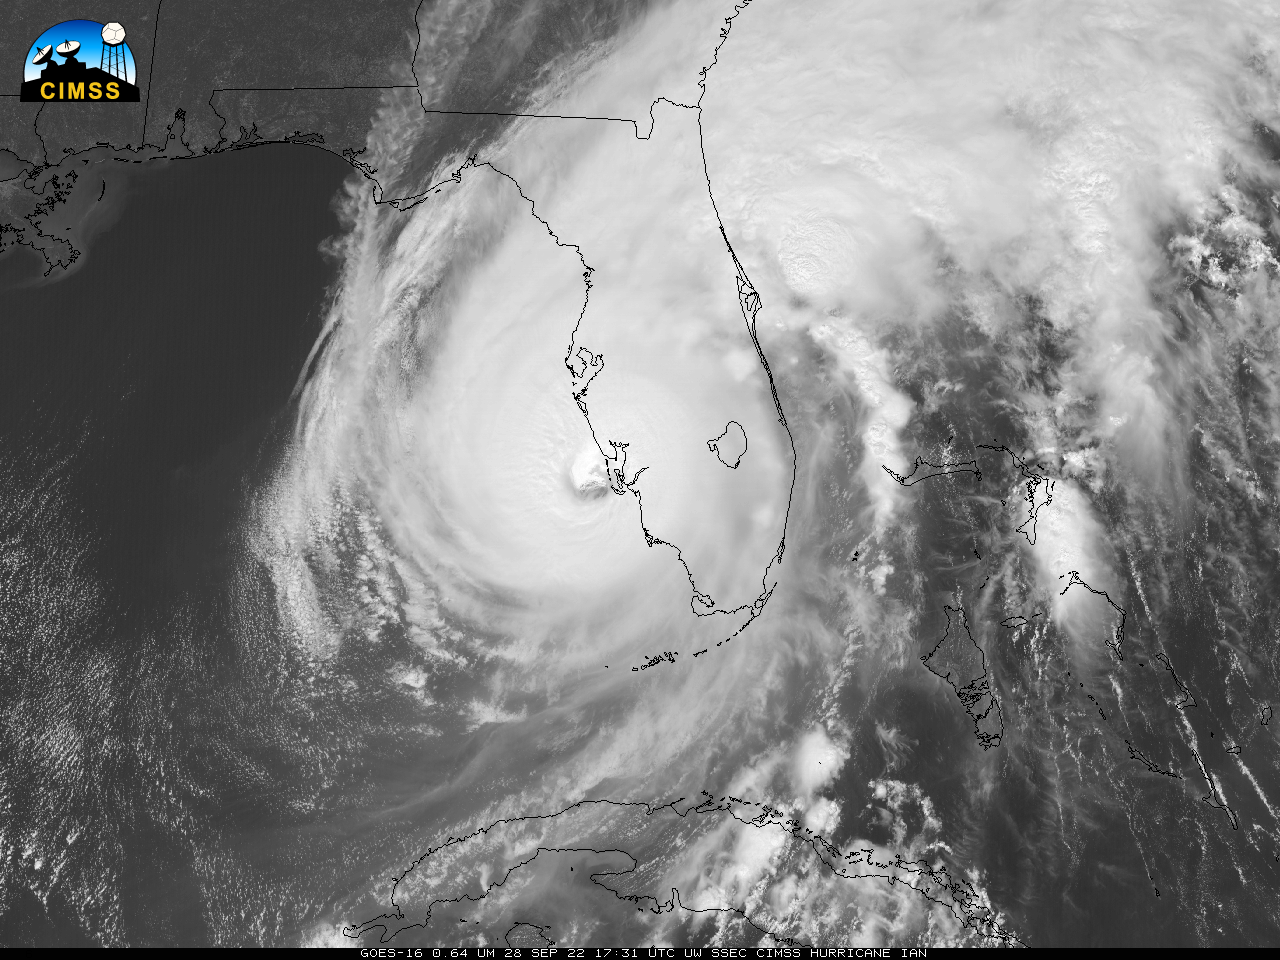
Archive for the ‘GOES-12’ Category

MCV over Texas

Monday, August 11th, 2008

Small IR Loop

Mesoscale Convective Vortices (MCVs) will occasionally emerge from under the eroding cirrus canopy of a Mesoscale Convective System (MCS). Typically, an MCS will dissipate shortly after sunrise, but in atmospheres that include plentiful moisture and little vertical wind shear, the MCV that very frequently develops in an MCS can persist and serve to force subsequent convective development. (Previous MCVs have been documented in the CIMSS Satellite Blog here, here and here).

Strong convection that developed over western Texas early in the morning on Monday 11 August grew into a MCS that quickly eroded near sunrise. However, a swirl of mid-level clouds in the IR image loop above, and in the visible loop here, clearly show the persistence of an MCV. Note in the visible loop how subsequent convection develops very near the propagating MCV, first just to the northwest of the vortex (with the convection spreading south) and then to the north and east.

An MCV is driven mostly by the release of latent heat in convective clouds. Such heating will alter the stability and thus force the development of a vortex. The persistence of the vortex is a balance between the effects of ongoing convection releasing latent heat (maintaining the vortex) and the effects of strong vertical wind shear that serves to weaken the vortex. On this day, a rich moisture source is evident, as noted in the plot here of surface (yellow, in degrees Fahrenheit) and 850-mb dewpoints (white, in degrees Celsius). In addition, GFS model output of 850-500mb shear at 1200 UTC and 1800 UTC show minimal values in Texas where the MCV persisted.

Because forcing associated with the MCV can aid subsequent convective development, noting their presence — an easy task in satellite animation — is vital.

Satellite indicators of potential turbulence

Sunday, July 27th, 2008

GOES-12 10.7µm IR images (Animated GIF)

There are a number of satellite signatures that denote areas of potential turbulence, and AWIPS images of the GOES-12 10.7 µm IR channel on 27 July 2008 (above) displayed two of the more common indicators: rapidly developing convection, and transverse banding. A decaying mesoscale convective system was moving southeastward across Minnesota and Iowa, with pulses of new convection developing rapidly over northern Iowa — one pilot reported a severe updraft that caused a rapid increase in altitude of 2000 feet as the aircraft was flying over the Minnesota/Iowa border region.

Along the periphery of the northeastern quadrant of the decaying MCS, a well-defined area of “transverse banding” formed (the narrow cloud band features were generally perpendicular to the mean wind direction aloft) –  there were a few reports of turbulence that appeared to be associated with this transverse banding feature: over Lake Michigan around 17:30 UTC,  over northeastern Wisconsin around 19:20 UTC, and over western Lower Michigan around 20:09 UTC.

MODIS 11.0 µm IR image

The transverse banding features that were seen on the 4-km resolution GOES IR imagery were even more obvious on an AWIPS image of the 1-km resolution MODIS 11.0 µm IR channel (above), and also on a comparison of 250-m resolution MODIS true color images from the SSEC MODIS Today site (below).

MODIS true color images (Animated GIF)

Since we’re on the topic of potential aviation hazards, also note the hazy features that were evident on the MODIS true color images (just to the east of the transverse banding) — these hazy features were due to the presence of thick smoke from wildfires that had been burning over parts of northern Saskatchewan, Canada for several days (see the US Air Quality “Smog Blog” for details).  GOES-12 visible imagery indicated that this smoke began moving southeastward across Manitoba and into the north-central US on 25 July (QuickTime animation). The smoke was likely confined to layers aloft, but aircraft flying through those smoke layers would encounter significantly reduced visibilities at those altitudes. An AWIPS image of the 1-km resolution MODIS 3.7 µm IR channel (below) showed a large number of fire “hot spot” signatures across far northern Saskatchewan at 04:05 UTC (10:05 PM the previous evening, local time).

MODIS 3.7 µm shortwave IR image

Hurricane Dolly

Monday, July 21st, 2008

GOES-12 visible images (Animated GIF)

The GOES-12 satellite was placed into Rapid Scan Operations (RSO) mode to monitor Tropical Storm Dolly on 21 July 2008 — the RSO visible images at 5-10 minute intervals (above) showed that deep convection was increasing around the core of the tropical cyclone. Dolly was moving northwestward across the Gulf of Mexico –  AWIPS images of the MODIS Sea Surface Temperature (SST) product (below) showed rather warm SST values (mid 80s to near 90 F, red colors) across much of the western Gulf of Mexico on the previous day, which argued in favor of a trend of intensification to hurricane strength. For additional satellite imagery and the latest information on  Dolly, see the CIMSS Tropical Cyclones site.

MODIS Sea Surface Temperature product (Animated GIF)

** 23 July UPDATE: Dolly reached hurricane intensity late in the day on 22 July (CIMSS Advanced Dvorak Technique intensity plot). GOES-12 RSO visible images (below) show the ragged eye of Hurricane Dolly approaching  South Padre Island along the southern coast of Texas. A peak wind gust of 76 mph was reported at Port Mansfield and Rincon in Texas, with a ship captain off South Padre Island estimating a wind gust of 100 mph — wave heights over 24 feet were recorded by an offshore buoy. In addition to the strong winds, there were also several tornadoes and waterspouts, along with rainfall in excess of 12 inches.

GOES-12 visible images (Animated GIF)

AWIPS  images of the 4-km resolution GOES-12 10.7 µm IR channel (below) revealed that cloud top brightness temperature values around the eye and in the outer band regions were in the -70º to -80º C range (black to white colors).

GOES-12 10.7 µm IR images (Animated GIF)

AWIPS images of the 1-km resolution MODIS 11.0 µm IR channel (below) indicated that cloud top brightness temperatures were as cold as -84º C (purple colors) on 22 July as the storm reached hurricane intensity.

MODIS 11.0 µm IR images (Animated GIF)