Standing wave south of the Aleutian Islands
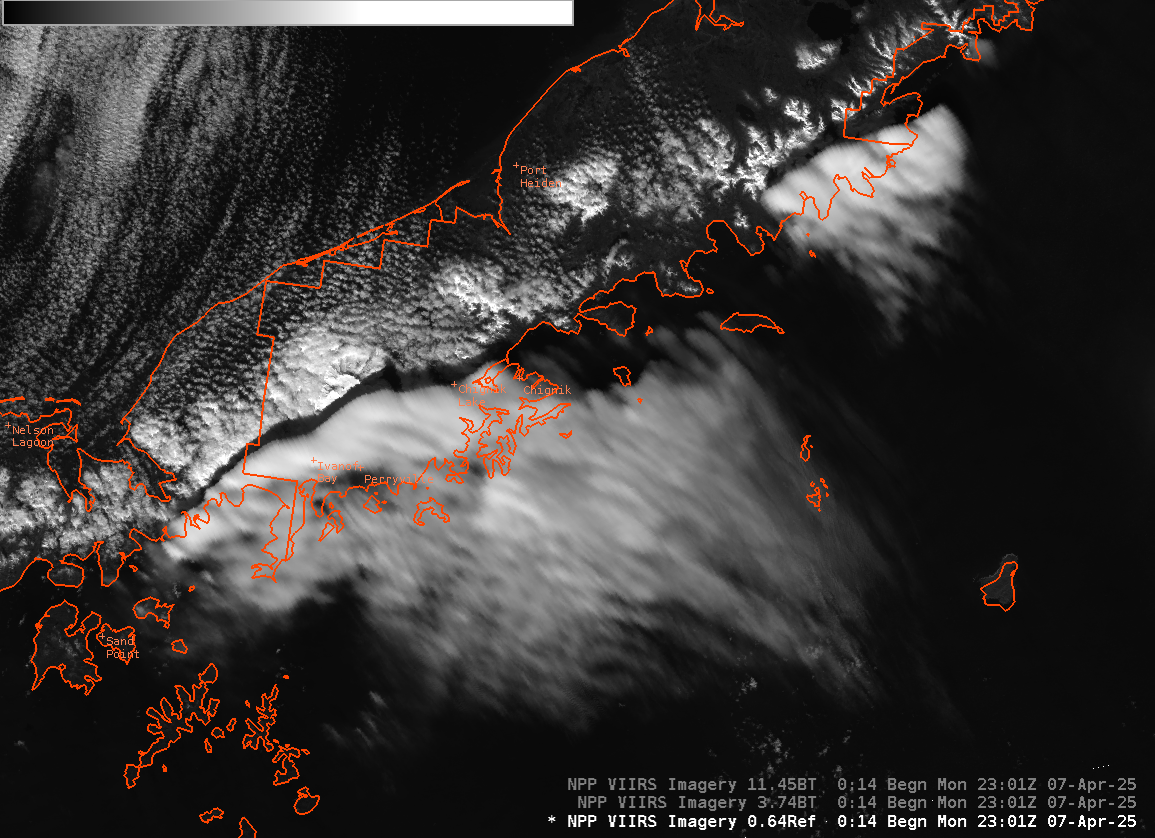
GOES-18 True Color imagery during the day on 7 April, above, shows the development of a standing wave downwind of the elevated topography on the Aleutian peninsula between King Salmon and Perryville. (Note also the faint signal of volcanic ash as discussed here) What atmospheric conditions support the development of... Read More