Hurricane Joaquin
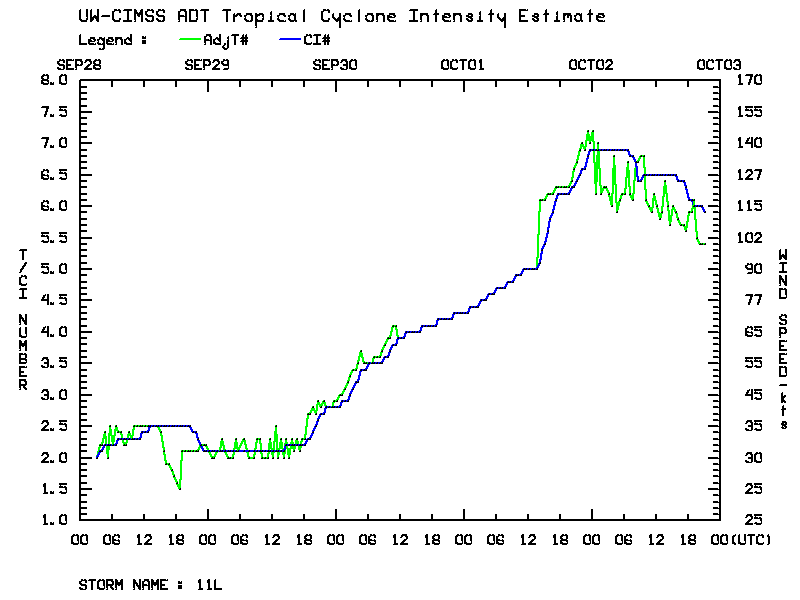
![DMSP-18 SSMIS Microwave (85 GHz) and GOES-13 Infrared (10.7 µm) images [click to enlarge]](https://cimss.ssec.wisc.edu/satellite-blog/wp-content/uploads/sites/5/2015/09/150930_1245utc_goes13_ir_1259utc_ssmis_mw_Juaquin_anim.gif)
DMSP-18 SSMIS Microwave (85 GHz) and GOES-13 Infrared (10.7 µm) images [click to enlarge]
The GOES-13 (GOES-East) satellite was placed into Rapid Scan Operations (RSO) mode, providing images as frequently as every 5-7 minutes. Visible (0.63 µm) images (below; also available as an MP4 movie file) showed a number of convective bursts during the day, with a few overshooting tops.
![GOES-13 Visible (0.63 µm) images [click to play animation]](https://cimss.ssec.wisc.edu/satellite-blog/wp-content/uploads/sites/5/2015/09/150930_goes13_visible_Hurricane_Joaquin_anim.gif)
GOES-13 Visible (0.63 µm) images [click to play animation]
![GOES-13 Infrared (10.7 µm) images [click to play animation]](https://cimss.ssec.wisc.edu/satellite-blog/wp-content/uploads/sites/5/2015/09/150930_goes13_ir_Hurricane_Joaquin_anim.gif)
GOES-13 Infrared (10.7 µm) images [click to play animation]
===== 01 October Update =====
The ASCAT Scatterometer on board METOP-A sampled the eastern half of Joaquin shortly after 0230 UTC on 1 October, as shown below. Hurricane-force winds were observed 20-30 miles away from the storm center; tropical storm-force winds extended about twice as far out.
![GOES-13 Infrared (10.7 µm) images and METOP-A ASCAT Scatterometer winds, 0230 UTC on 1 October; the NHC Forecast track for Joaquin is indicated [click to enlarge]](https://cimss.ssec.wisc.edu/satellite-blog/wp-content/uploads/sites/5/2015/09/ASCAT_Joaquin_0230_01Oct2015.png)
GOES-13 Infrared (10.7 µm) images and METOP-A ASCAT Scatterometer winds, 0230 UTC on 1 October; the NHC Forecast track for Joaquin is indicated [click to enlarge]
![GOES-13 Infrared (10.7 µm) images [click to play animation]](https://cimss.ssec.wisc.edu/satellite-blog/wp-content/uploads/sites/5/2015/10/151001_goes13_ir_Hurricane_Joaquin_anim.gif)
GOES-13 Infrared (10.7 µm) images [click to play animation]
![GOES-13 Visible (0.63 µm) images [click to play animation]](https://cimss.ssec.wisc.edu/satellite-blog/wp-content/uploads/sites/5/2015/10/151001_goes13_visible_Hurricane_Joaquin_anim.gif)
GOES-13 Visible (0.63 µm) images [click to play animation]