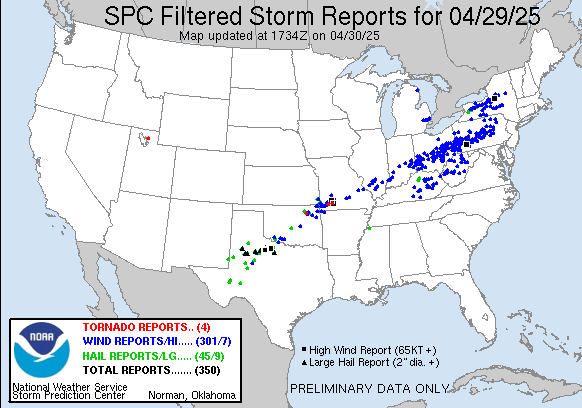
Storm Prediction Center storm reports for the 24 hours ending 1200 UTC on 30 April 2025 show a line of strong wind reports from the mid-Mississippi River valley east-northeastward into central Pennsylvania.
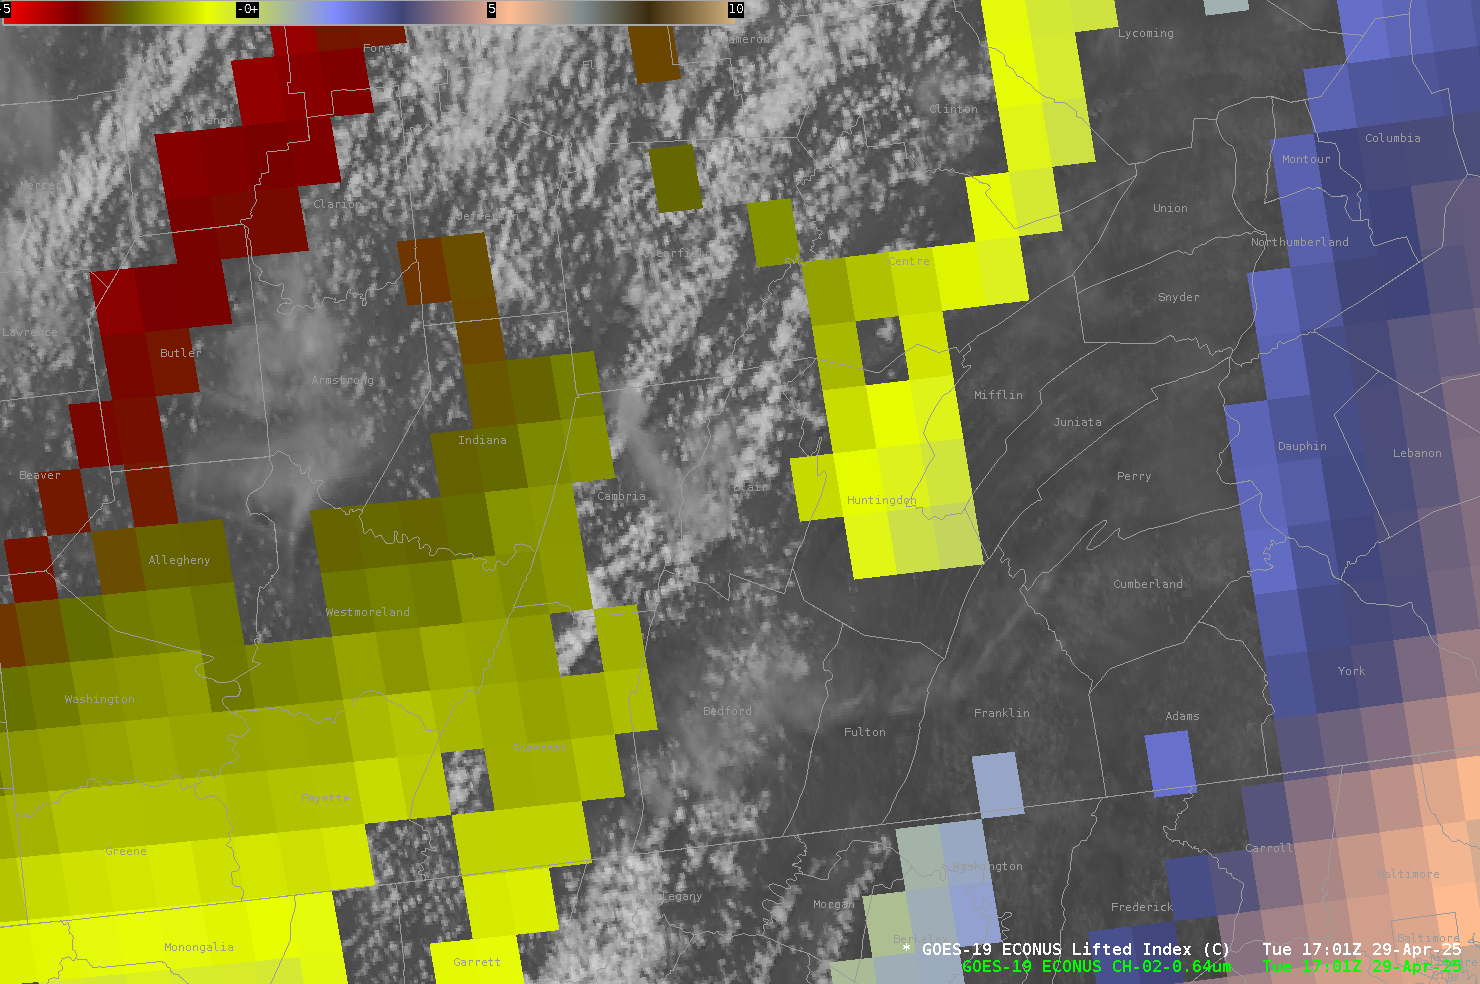
What satellite products could have been useful on 29 April to anticipate the arrival of these strong winds? The animation below shows Derived Lifted Index (a clear-sky only product) values plotted on top of visible imagery. Lifted Index values between -2 and -5 are widespread through much of the animation over western Pennsylvania. Convection moving in from the west will be able to access this instability.
NUCAPS profiles were also available over Pennsylvania in a cluster from 1500-1800 UTC, as shown in the animation below. The ‘Sounding Availability Plot’ includes more than one overpass, and selected profiles are shown over central Pennsylvania. Of particular note is the region in very rural Clearfield County where three profiles were sensed over the course of 3 hours! It’s worth repeating that the NUCAPS points are actually a volume of air, a tube about 50km in diameter that matches the ATMS footprint. Considerable destabilization is diagnosed over the three hours. Based on these profiles, a forecaster observing the severe weather reports upstream might not suspect that incoming convection will weaken. (Here’s an animation of just the three profiles over rural Clearfield County).

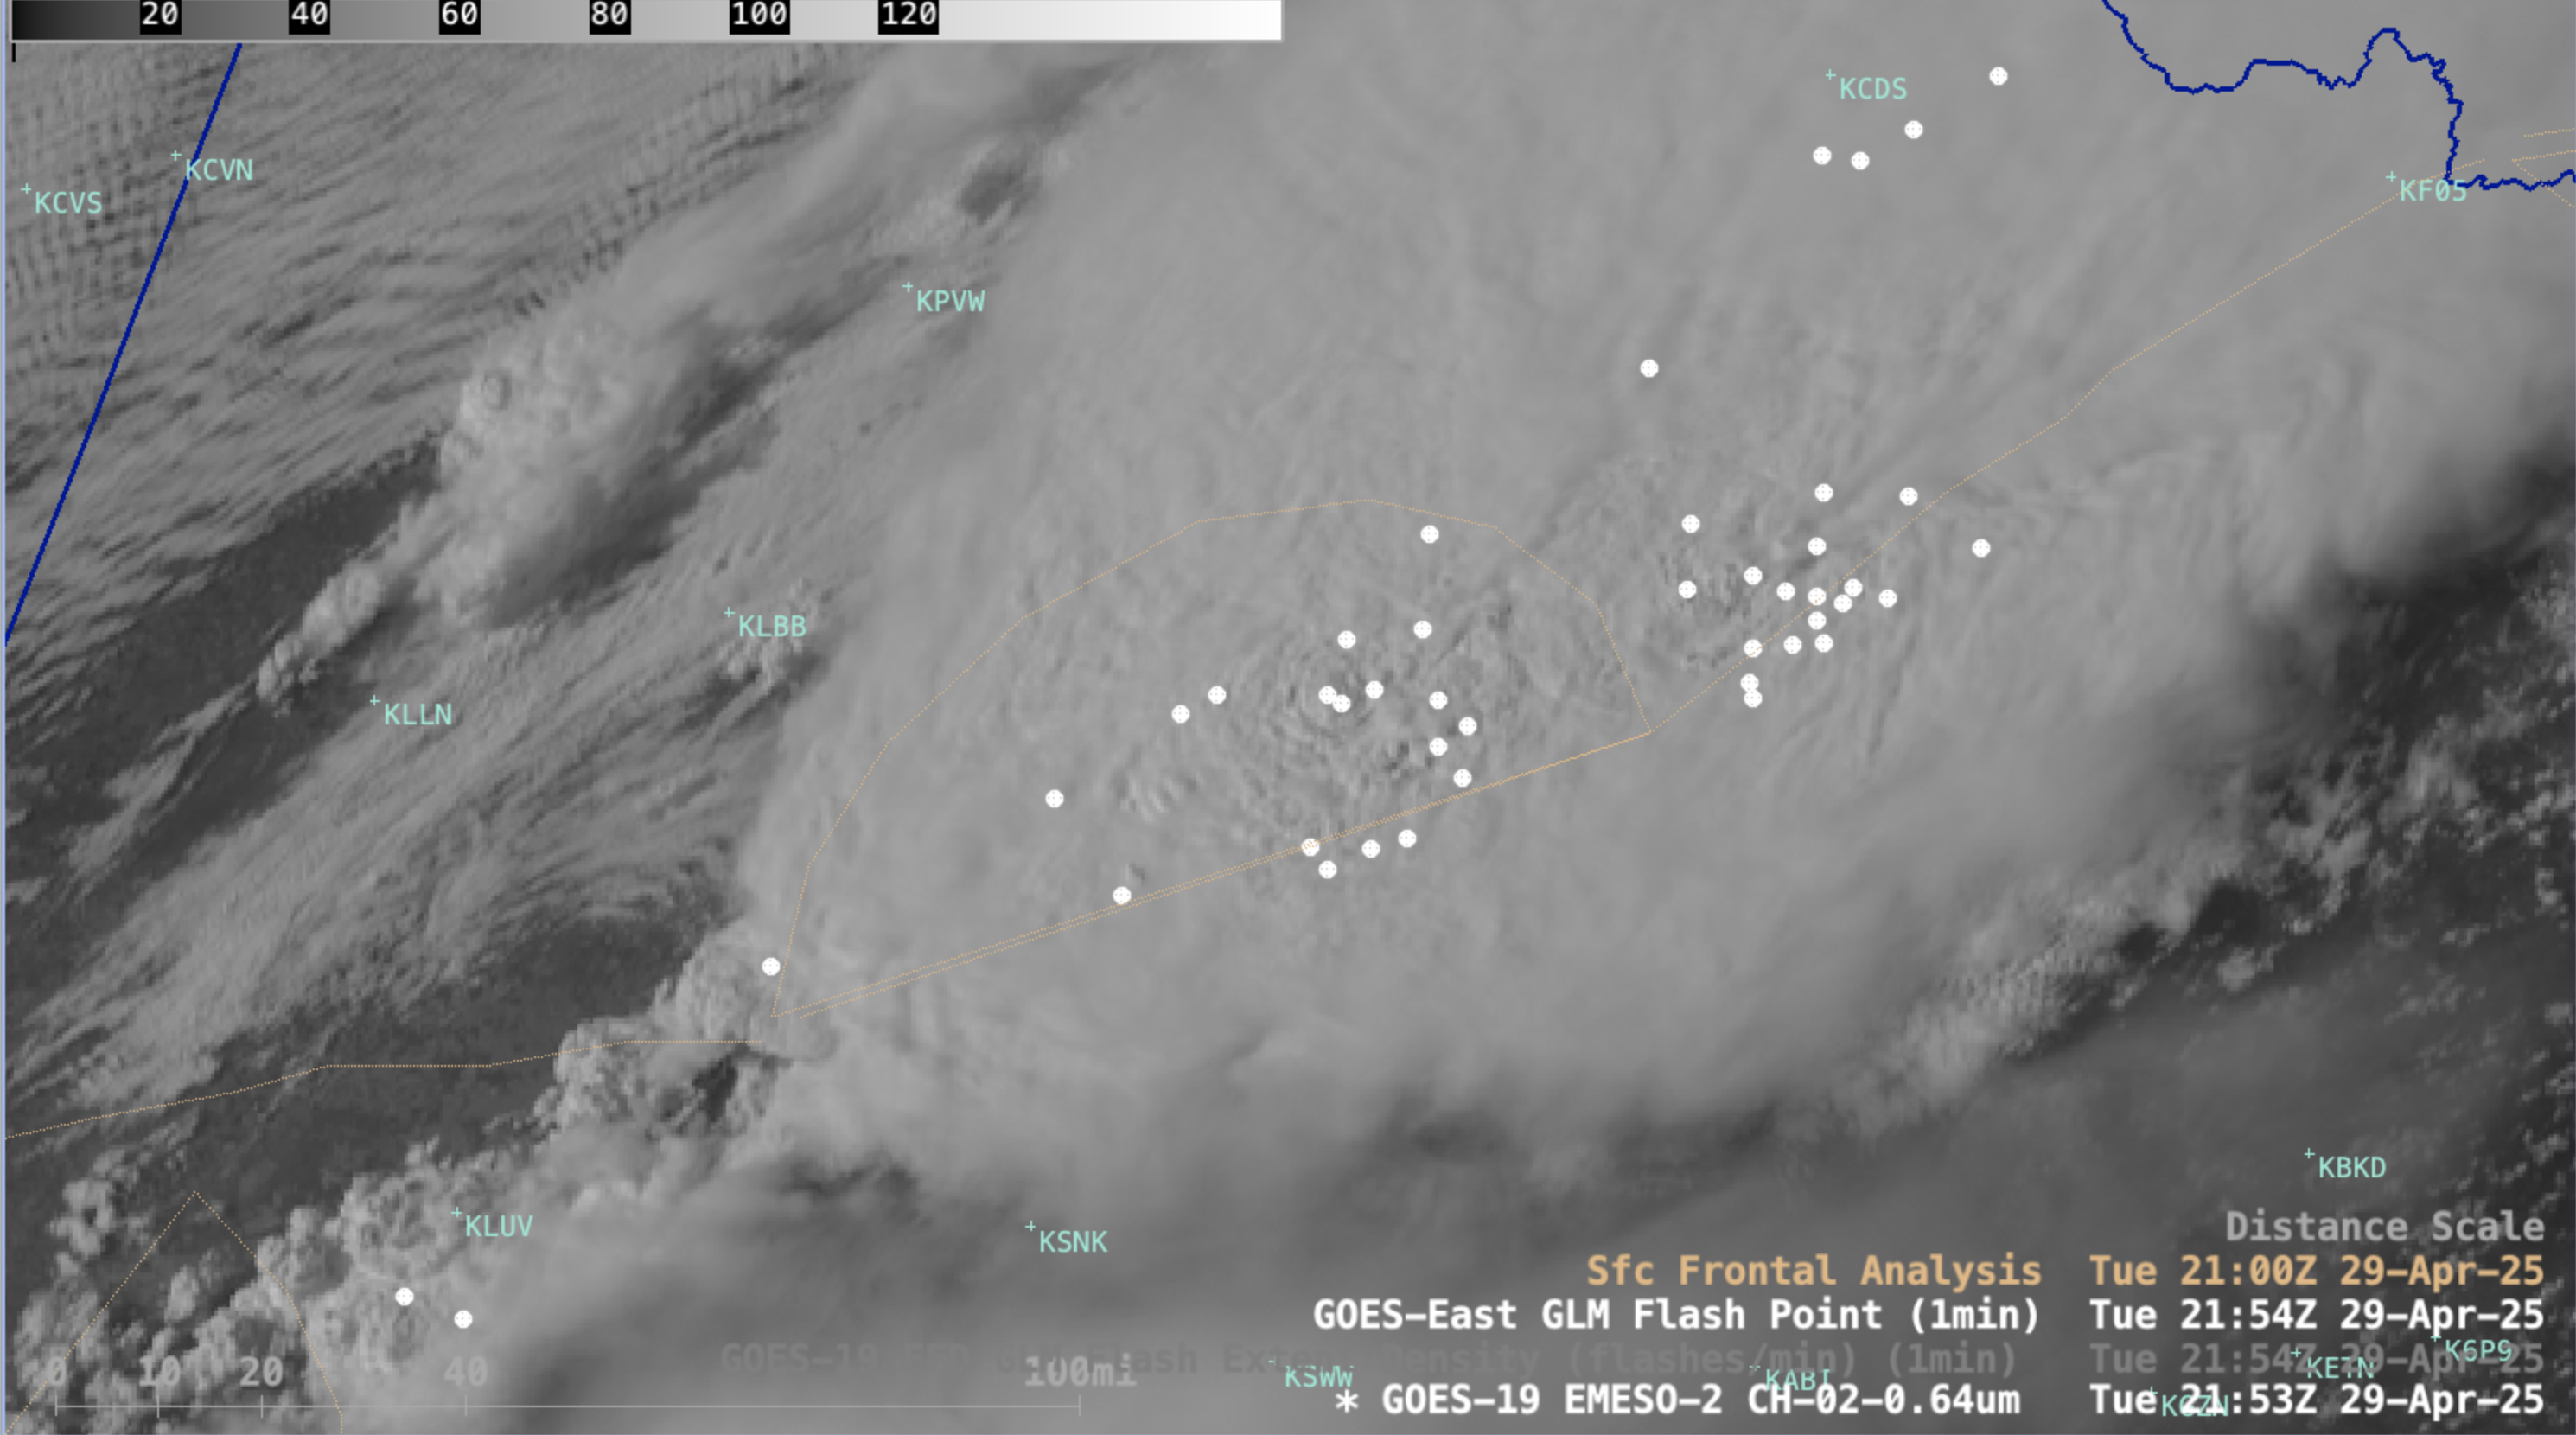
Clean window infrared imagery, below, spanning from 1900 UTC on 29 April through 0300 UTC on 30 April 2025, shows that coldest cloud tops warmed as the convection moved into central Pennsylvania. However, widespread power outages were reported, as shown here from this source.
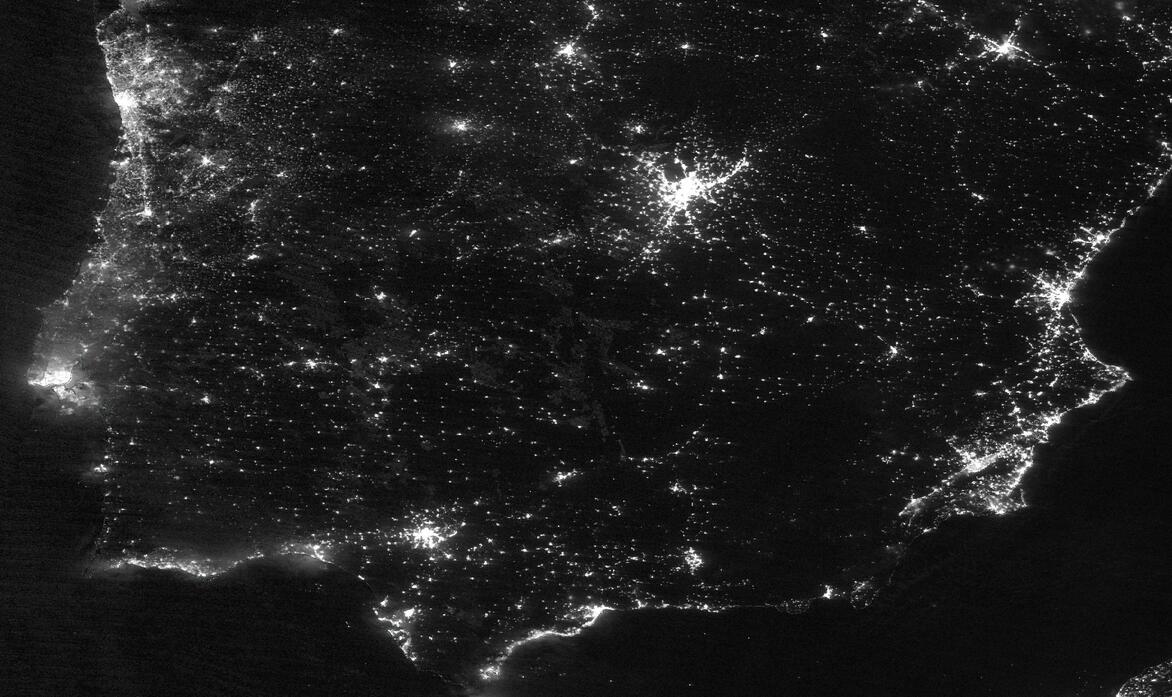
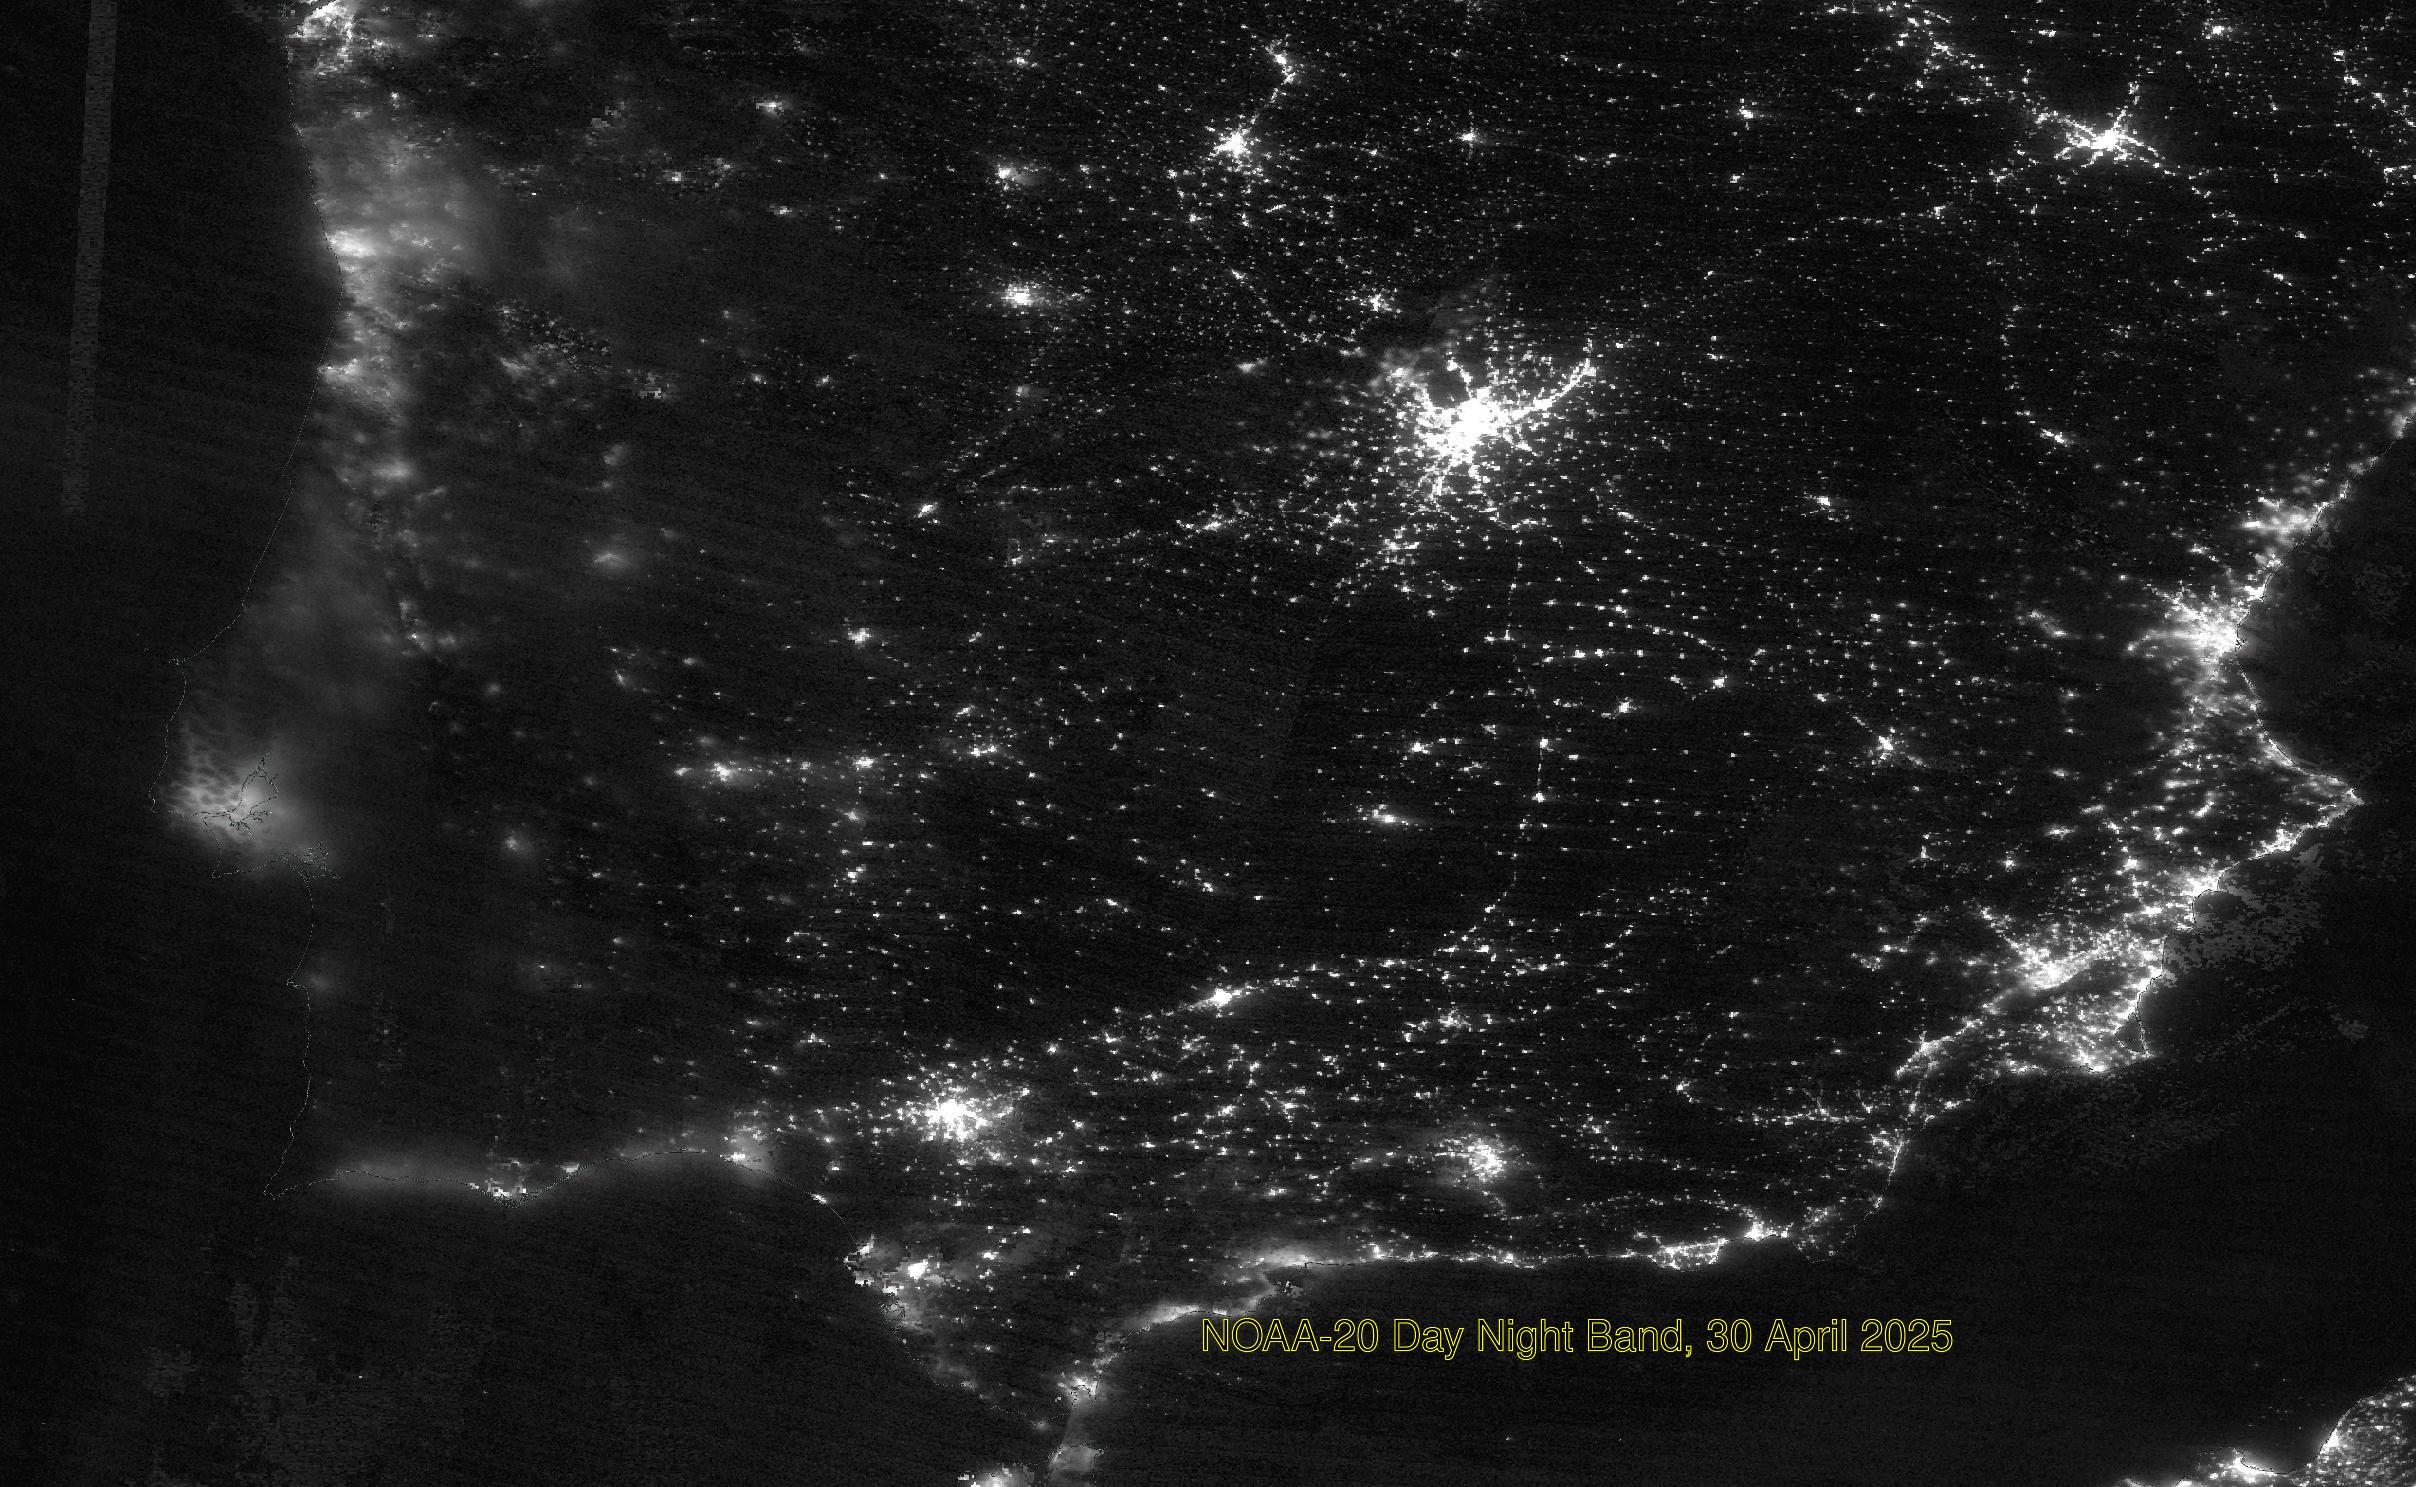
Were the power outages caused by the storms visible in the Day Night band, similar to this event in Spain? The toggle below compares Day Night Band imagery from early morning on the 29th (before the storms) and early morning on the 30th (just after the storms). It’s hard to tell for sure because a lot of the changes in illumination on 30 April are due to the thick cloud cover from the storms.
View only this post Read Less


