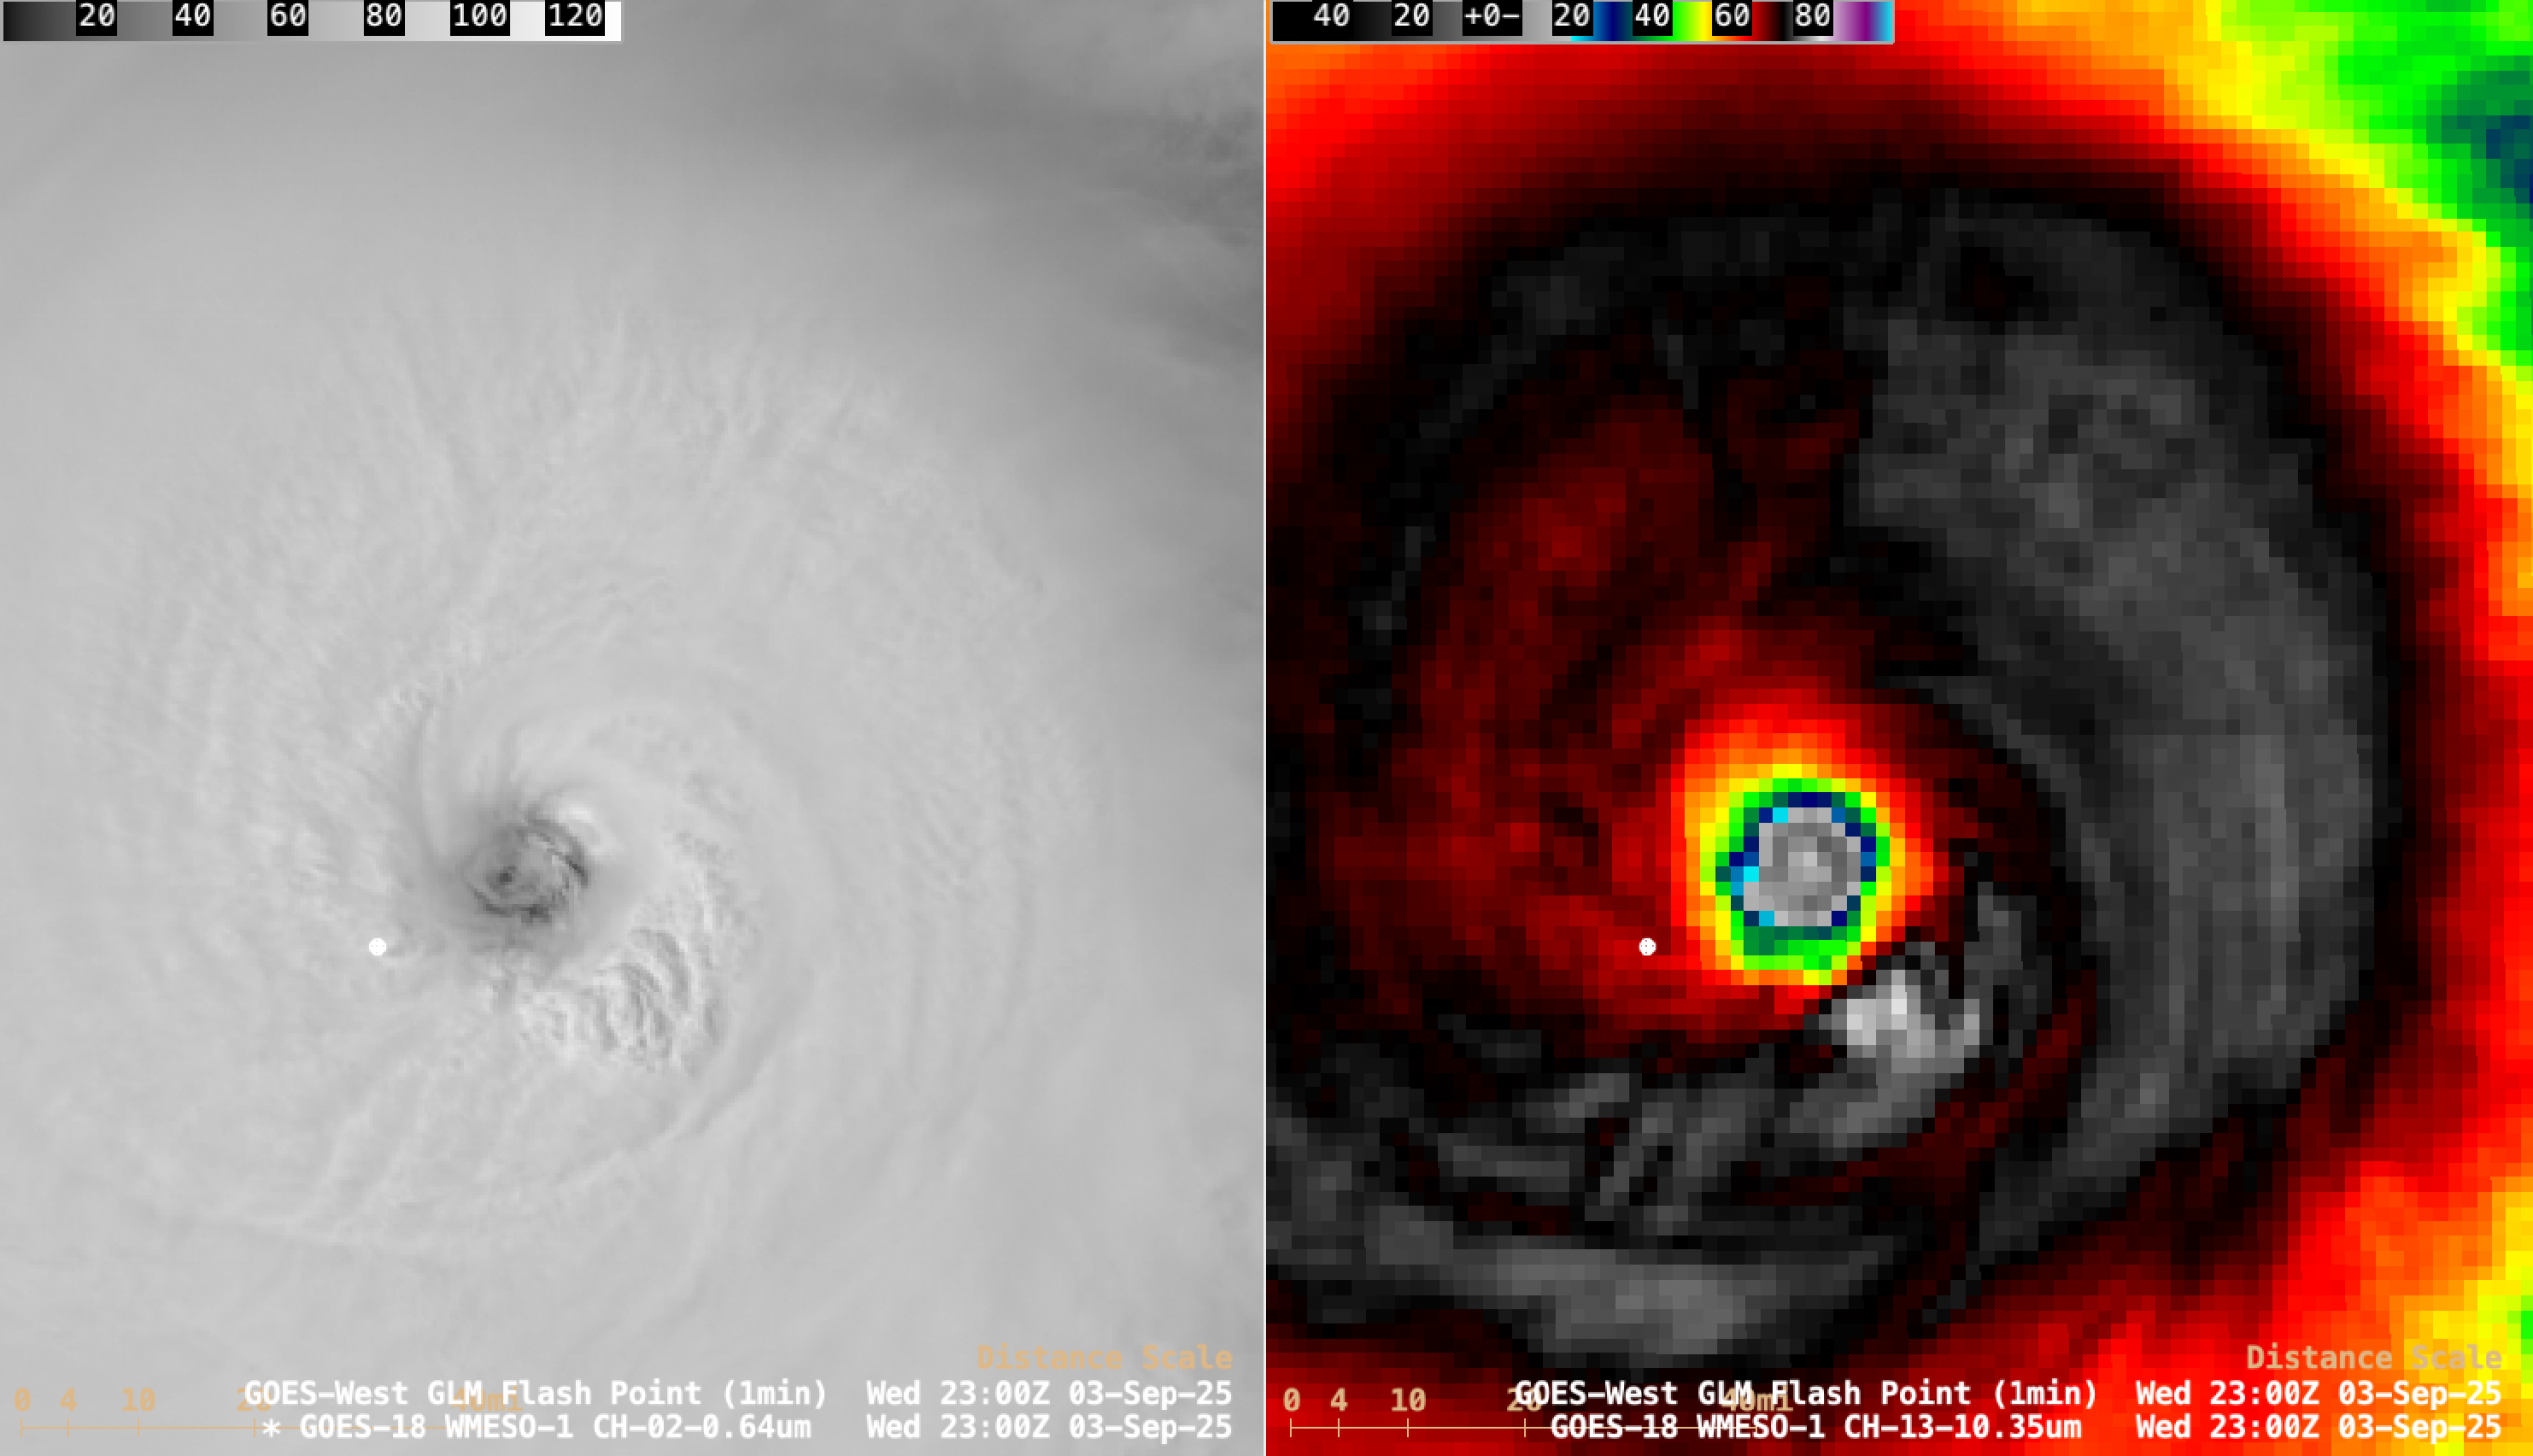
1-minute Mesoscale Domain Sector GOES-18 (GOES-West) Visible and Infrared images (above) showed the westward motion of of Hurricane Kiko during an 8.5-hour period as the tropical cyclone was rapidly intensifying (SATCON) from a Category 2 storm at 1500 UTC on 03 September 2025 to a Category 3 storm at 1800 UTC and... Read More

1-minute GOES-18 Visible and Infrared images with plots of 1-minute GOES-18 GLM Flash Points, from 1733 UTC on 03 September to 0200 UTC on 04 September [click to play MP4 animation]
1-minute Mesoscale Domain Sector GOES-18
(GOES-West) Visible and Infrared images
(above) showed the westward motion of of
Hurricane Kiko during an 8.5-hour period as the tropical cyclone was rapidly intensifying (
SATCON) from a Category 2 storm at
1500 UTC on 03 September 2025 to a Category 3 storm at 1800 UTC and then to a Category 4 storm at
2100 UTC. Visible imagery revealed low-altitude mesoscale vortices that were occasionally evident within the eye. Plots of 1-minute GOES-18
GLM Flash Points displayed intermittent lightning activity within the eyewall — and the coldest cloud-top infrared brightness temperatures within the eyewall were in the -80ºC to -85ºC range.
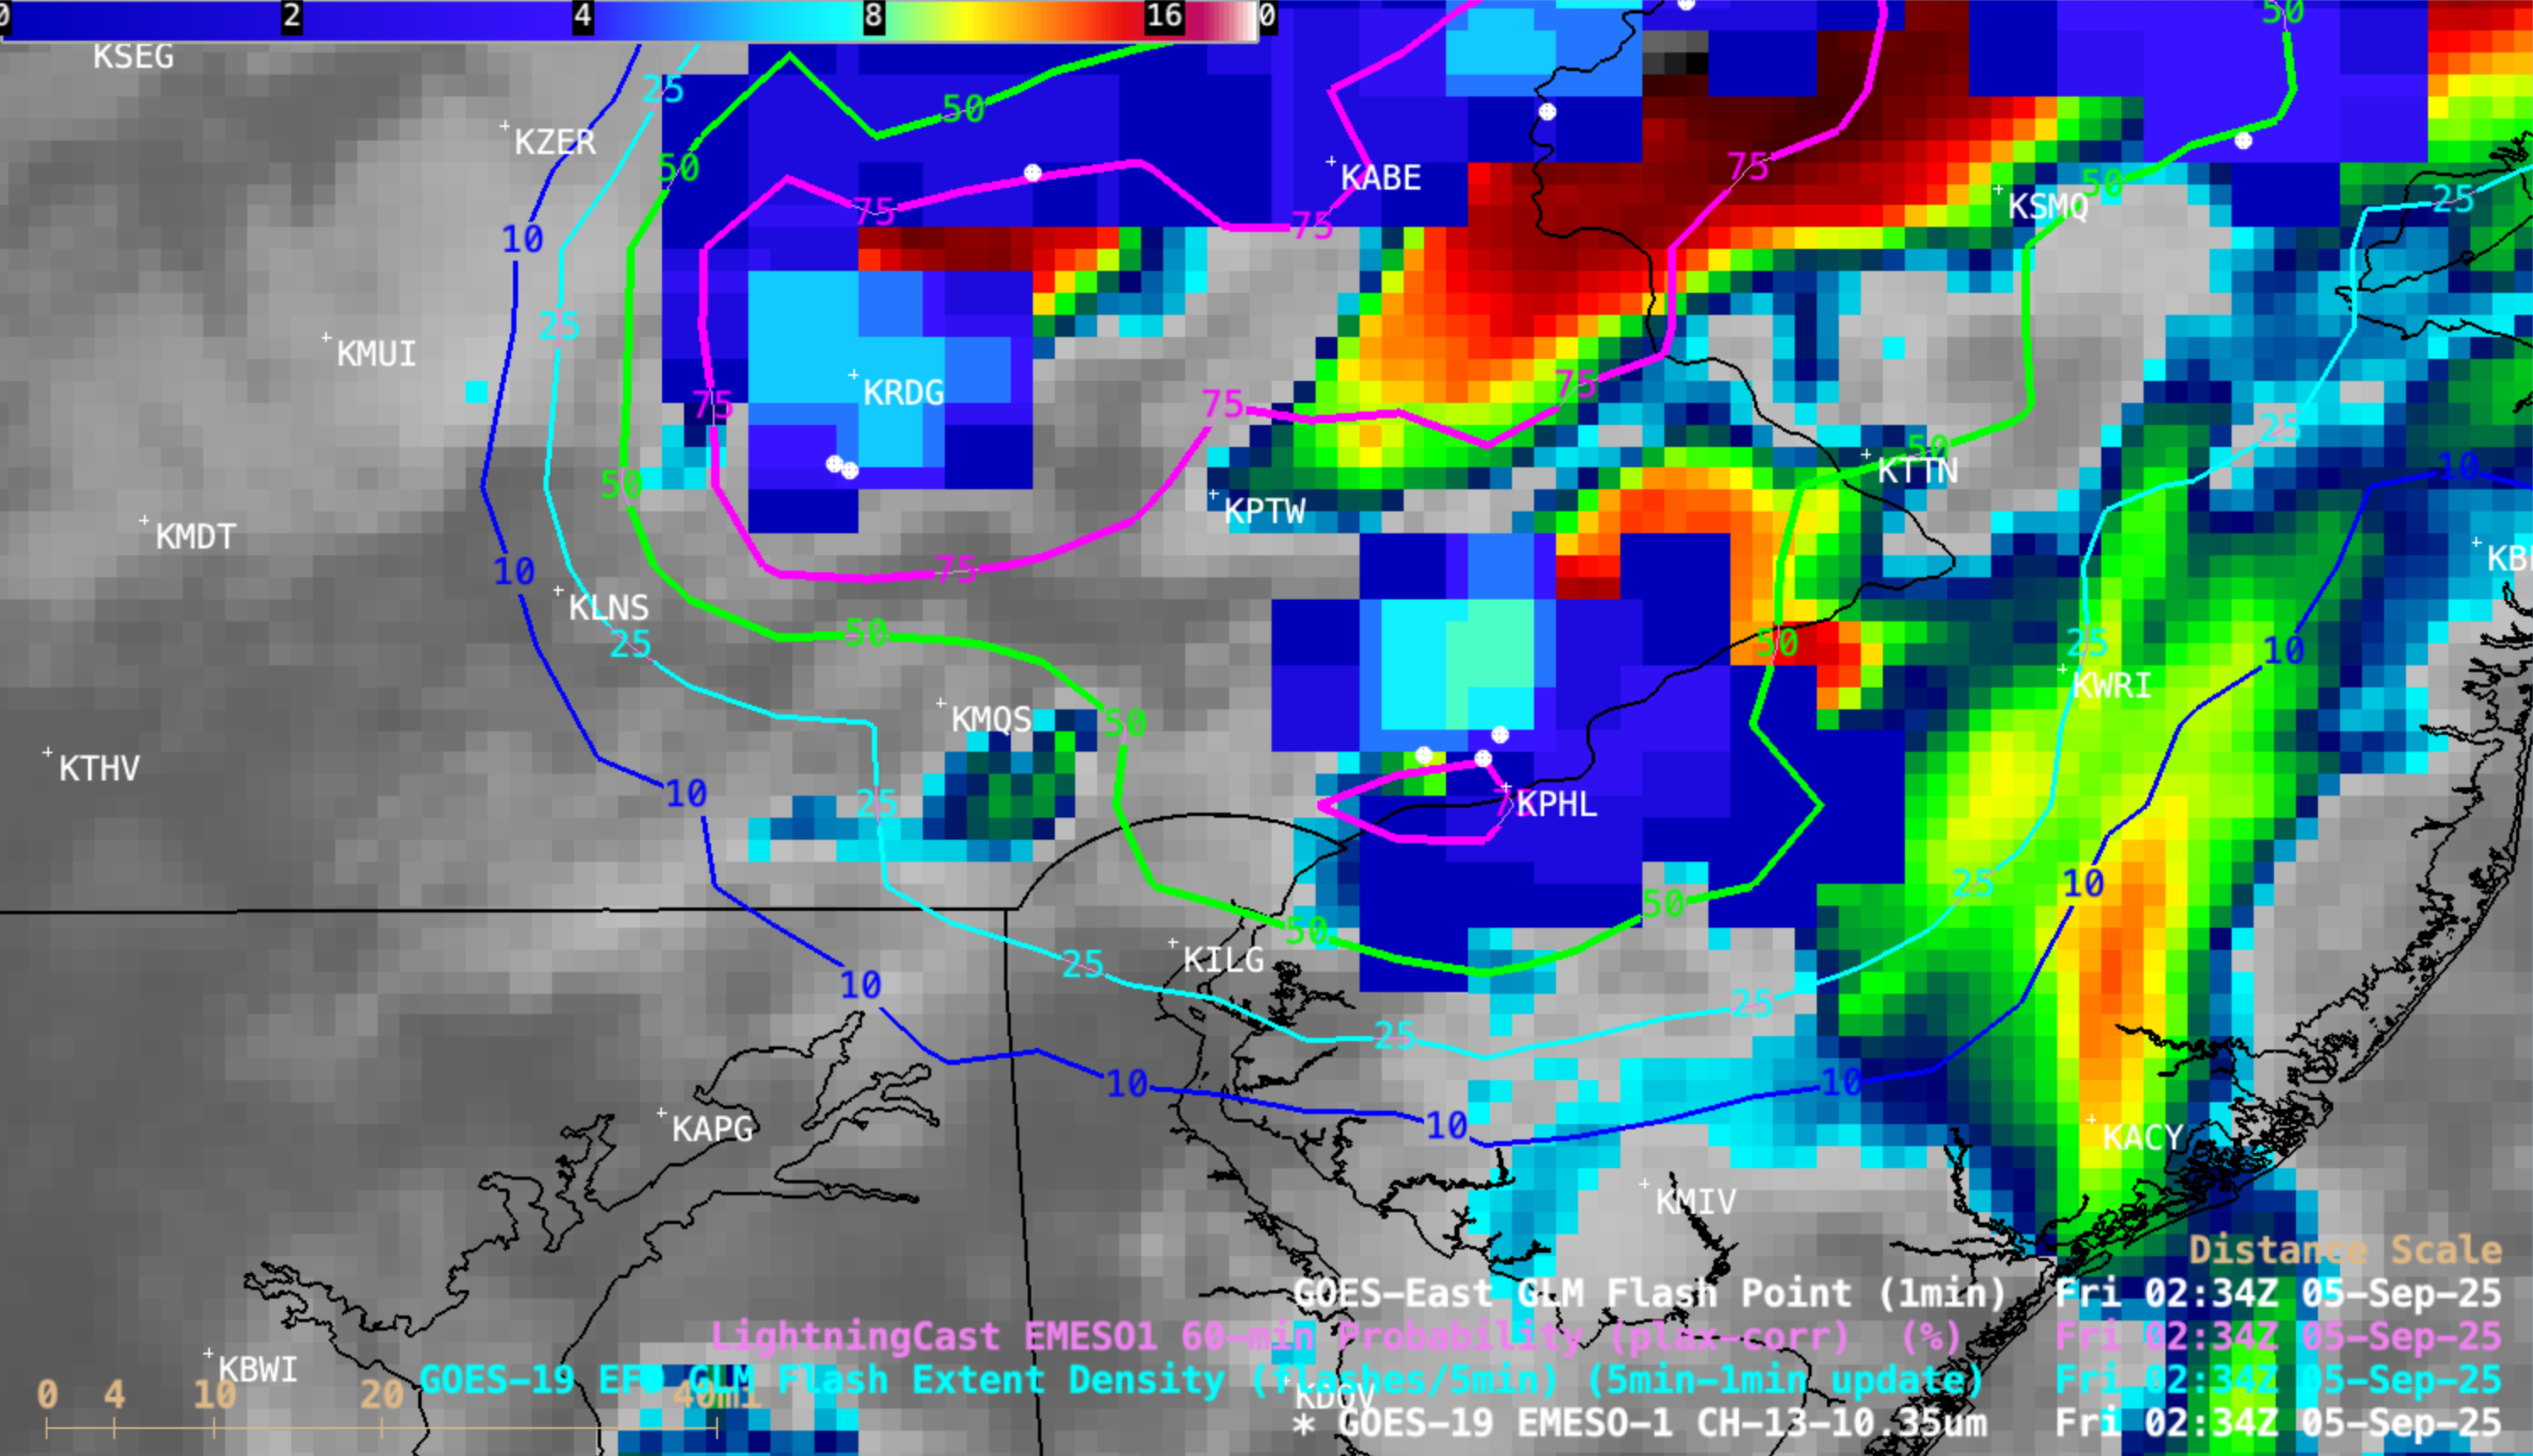
Kiko was moving through an environment characterized by low values of deep-layer wind shear (below), and moving over relatively warm water — two factors that were favorable for tropical cyclone intensification.
GOES-18 Infrared images with an overlay of contours and streamlines of Deep-Layer Wind Shear at 2200 UTC on 03 September
An AMSU-B Microwave image at 1815 UTC (below) displayed a closed eyewall around the time that Kiko reached Category 4 intensity.

AMSU-B Microwave (183 GHz) image at 1815 UTC
A RCM-2 Synthetic Aperture Radar (SAR) image (source) at 0301 UTC on 04 September (below) depicted a maximum wind speed of 118.35 kts within the eyewall of Kiko.

RCM-2 SAR wind speed image at 0301 UTC on 04 September [click to enlarge]
1-minute CIMSS True Color RGB images created using
Geo2Grid (below) showed a larger-scale view of Kiko.

1-minute GOES-18 CIMSS True Color RGB images, from 1800 UTC on 03 September to 0259 UTC on 04 September (courtesy Mat Gunshor, CIMSS) [click to play animated GIF | MP4]
images
(below) indicated that Kiko (centered around 13ºN and moving between 130ºW and 140ºW) was beginning to tap moisture from the Intertropical Convergence Zone (ITCZ).

Hourly MIMIC Total Precipitable Water images, from 0000 UTC on 03 September to 2300 UTC on 04 September
View only this post
Read Less


