A morphed microwave imagery loop (from the MIMIC website at CIMSS) shows 48 hours of structural changes as observed from microwave imagery. Note the strong eyewall-like structures at the beginning of the loop, with persistent strong convection noted west of the storm center. As the storm moves over colder water,... Read More

A morphed microwave imagery loop (from the MIMIC website at CIMSS) shows 48 hours of structural changes as observed from microwave imagery. Note the strong eyewall-like structures at the beginning of the loop, with persistent strong convection noted west of the storm center. As the storm moves over colder water, and as southwesterly shear increases, the structure deteriorates and strong convection becomes concentrated in regions some distance east and north of the storm center.

The color-enhanced loop, above, of 11-micron brightness temperature also shows Hurricane Ida (dowgraded to a Tropical Storm at 9 AM EDT on Monday) moving northward from the Straits of Yucatan into the central Gulf of Mexico. As it moves, the appearance of the storm deteriorates markedly. At the start of the loop, a relatively warm region in the center of the central dense overcast (CDO) that might be the eye of the storm migrates to the southwest edge of the CDO and then vanishes. This change shows the effects of strong southwesterly winds that are moving the tops of the thunderstorm away from the center of the storm.
Maps of shear (wind vector differences between the upper and lower troposphere) show a more hostile environment for the storm between 1200 UTC Sunday — when Ida was a strengthening category 1 hurricane in the Straits of Yucatan — and 1200 UTC Monday, when Ida was a weakening category 1 hurricane over the central Gulf of Mexico. Maps of mid-level shear, that is changes in wind between the lower and middle troposphere, for 1200 UTC Sunday and Monday tell a similar tale.

Ida’s path is forecast over progressively cooler sea-surface temperatures. That in combination with the hostile shear environment suggest that re-strengthening to hurricane status is unlikely. Strong high pressure off the East Coast of the United States, however, as shown in an analysis here suggest a large pressure gradient that will support strong winds over the entire southeast part of the United States as Ida approaches the central Gulf Coast.

Visible imagery, above (from GOES-14), show the results of shear on the cloud patterns. Deep convection is offset to the northeast of the circulation center (shown as the yellow dot in the imagery, from the 1500 UTC National Hurricane Center discussion). Latent heat in the storms cannot affect the southern/western semicircles of the storm if the storms are all displaced by shear to the north and east, as in this rocking loop. A similar loop from GOES-12 is shown here.

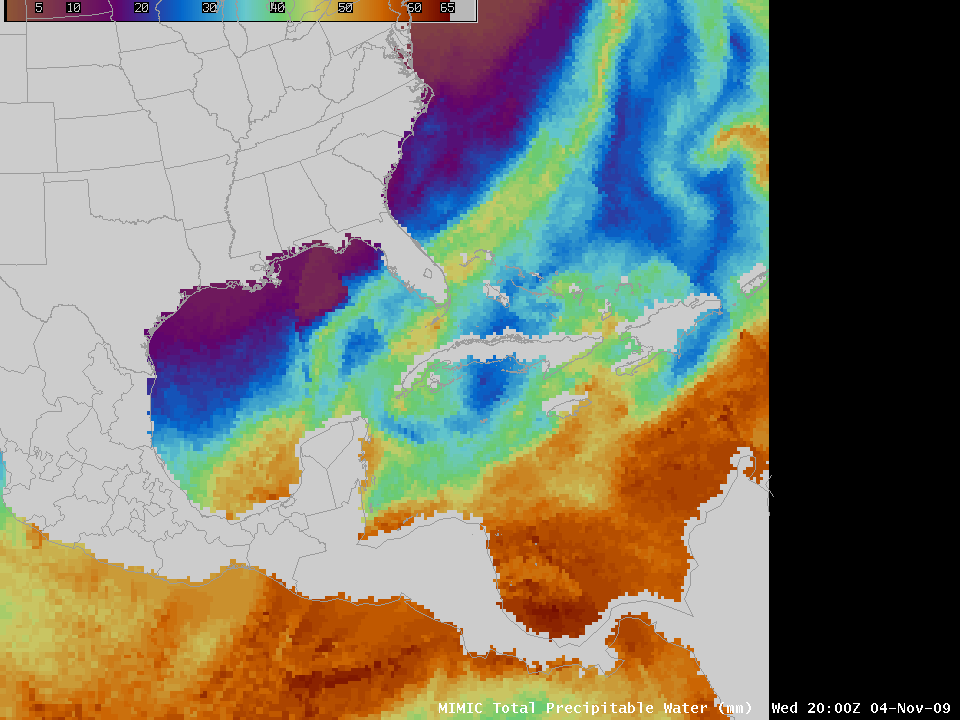
Precipitable water estimates from microwave imagery, above, show deep tropical moisture over the Gulf of Mexico. As this tropical moisture moves over the cooler air at the surface over the southeast part of the United States, it will cool and water will condense out. Heavy rains are predicted in the next two days as that happens.
For more information on Ida, please visit the CIMSS Tropical Weather Website or the National Hurricane Center website.
Added: Late afternoon infrared satellite imagery from GOES 14 and visible imagery from GOES 14 show convection nearly wrapping around the center of the storm, just south of the mouth of the Mississippi River. However, persistent shear appears to be over-riding that tendency.
View only this post
Read Less
")

")


