On yet another relatively rare SPC “High Risk” Convective Outlook day, a major outbreak of damaging tornadoes occurred across parts of Oklahoma and Kansas on 10 May 2010 (see: SPC storm reports | NWS Norman OK | NWS Witchita KS). McIDAS images of the GOES-13 0.63 µm visible channel data (above) showed the development of numerous long-track supercell thunderstorms across the southern... Read More

GOES-13 0.63 µm visible images
On yet another relatively rare SPC “High Risk” Convective Outlook day, a major outbreak of damaging tornadoes occurred across parts of Oklahoma and Kansas on 10 May 2010 (see: SPC storm reports | NWS Norman OK | NWS Witchita KS). McIDAS images of the GOES-13 0.63 µm visible channel data (above) showed the development of numerous long-track supercell thunderstorms across the southern Plains region — much of this development was along and ahead of an advancing dryline, where GOES-13 Sounder Derived Product Imagery (DPI) showed Lifted Index (LI) values in Oklahoma as low as -14º C 21 UTC (along with Convective Available Potential Energy (CAPE) values as high as 6000 J kg-1 at 19 UTC).
Also note the large hazy plume of blowing dust that was moving northeastward from the Texas panhandle across western and central Oklahoma, as well as a smaller area of blowing dust that moved southward out of southwestern Kansas and into the Oklahoma panhandle region later in the day — this was an indicator of the strong lower tropospheric wind fields that were present over much of the region on that day.
The corresponding set of GOES-13 10.7 µm IR images (below) revealed several “enhanced-v” storm top signatures and a number of pronounced cold overshooting tops — cloud top IR brightness temperatures became progressively colder into the late afternoon and early evening hours, with a number of cloud tops in the -70º C to -80º C range (black to white enhancement).

GOES-13 10.7 µm IR images
A 1-km resolution MODIS water vapor image (below) showed a very complex array of middle tropospheric wave structures, an indication that the very strong winds were interacting with the terrain of the region.
We will begin by focusing our attention on the severe storm that can be seen developing over northern Oklahoma, near the triple point intersection of the cold front, the dry line, and the warm front.

MODIS 6.7 µm water vapor image + surface fronts
The GOES-13 satellite was placed into Super Rapid Scan Operations (SRSO) to support the VORTEX 2 field experiment — so satellite imagery was available at 1-minute intervals for short periods during the afternoon and early evening hours. GOES-13 SRSO visible images (below; also available as a QuickTime animation) showed some very interesting storm evolution and structure associated with a few of the earlier thunderstorms that developed across the Oklahoma/Kansas border region.
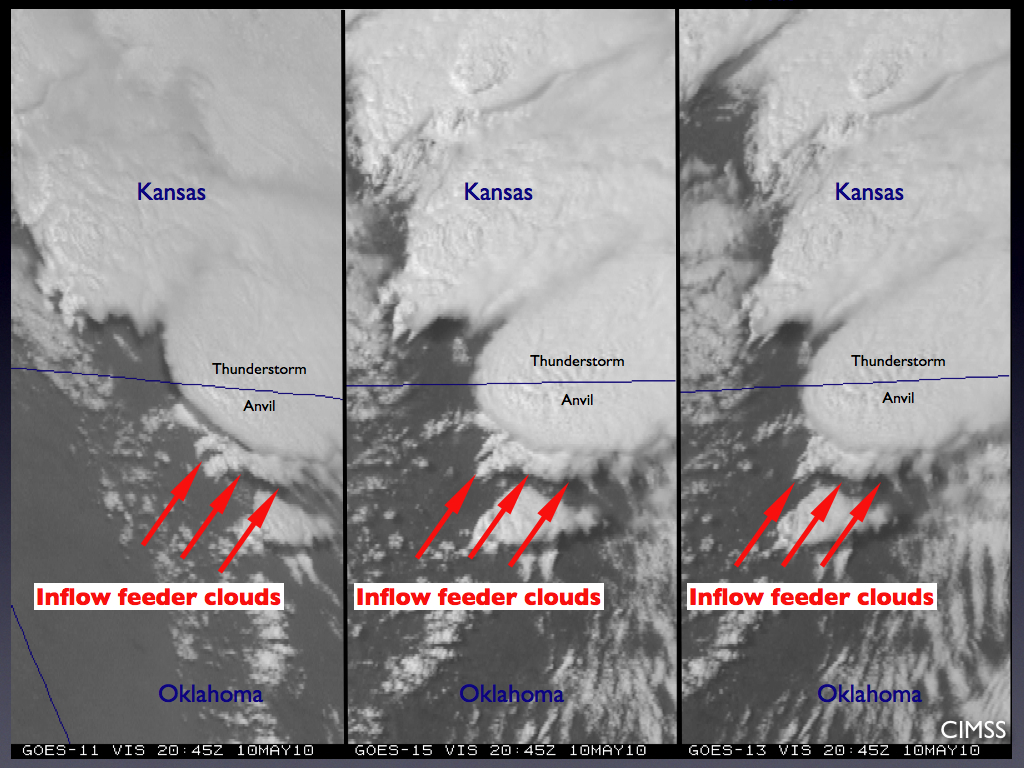
Of particular interest was the appearance of inflow feeder clouds that were seen to develop and become ingested into the southwest quadrant of one of the stronger storms during the 20:15 – 20:45 time period — and not long after these inflow feeder clouds were seen on the visible satellite imagery, this storm intensified and produced hail of 4.25 inches in diameter and a large tornado.
")
GOES-13 0.63 µm visible images (SRSO at 1-minute intervals)
A comparison of the GOES-11, GOES-15, and GOES-13 visible images that were available during the 20:30 – 20:45 UTC period when these inflow feeder clouds were being ingested into the storm show the value of more frequent imaging, which allows the evolution of such features to be more clearly visualized and understood (below). The images are shown in the native projections of each GOES satellite.

GOES-11, GOES-15, and GOES-13 visible images during the 20:30-20:45 UTC period
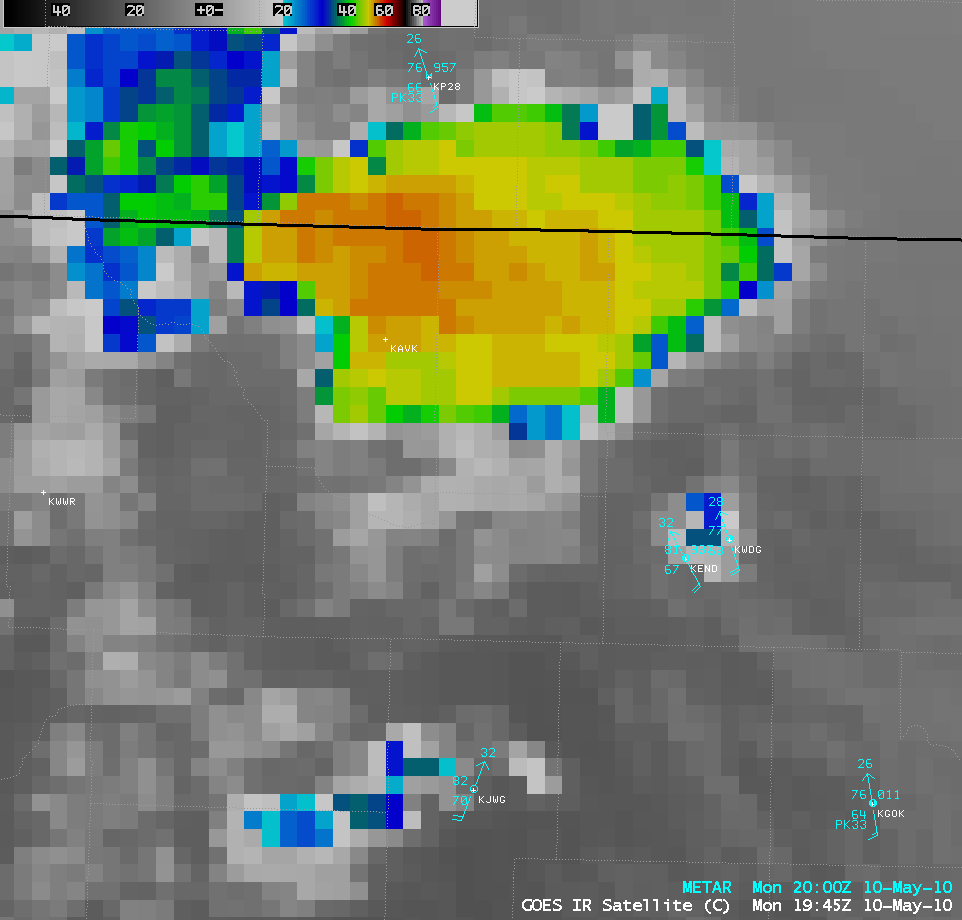
A 1-km resolution MODIS 11.0 µm IR image at 19:49 UTC (below) revealed the presence of a well-defined cold/warm cloud top temperature couplet associated with a developing “enhanced-v” signature — both cloud top signatures can be indicators a potential for that storm to produce severe weather (a 20-30 minute lead time is typical for such satellite storm top signatures). In fact, this storm did later produce hail of 4.25 inches in diameter at around 20:10 UTC, and then a strong tornado around 20:33 UTC. Note that neither the cold/warm couplet nor the developing enhanced-v signature was apparent on the 4-km resolution GOES-13 10.7 µm IR imagery at that time.

MODIS 11.0 µm IR image + SPC storm reports
============================================

POES AVHRR 12.0 µm IR image
Farther to the south, additional large areas of severe convection developed a couple of hours later over southwestern Oklahoma, which then moved eastward and produced large hail and tornadoes in the Oklahoma City and Norman areas. An AWIPS image of the AVHRR 12.0 µm IR channel data (above) showed the dramatic increase in areal coverage of cold cloud tops in southern and central Oklahoma at 22:32 UTC. A close-up view of that AVHRR IR image with an overlay of SPC storm reports (below) revealed a cluster of very cold cloud top brightness temperatures (as cold as -84º C, purple color enhancement) that was likely associated with the reports of tornadoes and hail of 4.00 and 3.75 inch in diameter in the Norman and Tinker Air Force Base areas.

POES AVHRR 12.0 µm IR image + SPC storm reports + surface METAR data
AWIPS images of the CIMSS experimental “Convective Initiation”, “Cloud Top Cooling Rate”, and “Overshooting Top” products are shown below; these products appeared to have some skill in providing some lead time to the development of this severe convection that later affected Oklahoma City and Norman. These CIMSS products are being provided to the Storm Prediction Center as part of the Hazardous Weather Testbed evaluation (a component of the GOES-R Proving Ground activities).

GOES IR + Convective Initiation + Cloud Top Cooling + Overshooting Top products
UPDATE: Added an N-AWIPS loop of Visible imagery with lightning and Convective Initiation, along with an N-AWIPS loop of Visible Imagery with Cloud-top cooling and warning polygons.
View only this post
Read Less


 and false color (bands 7/2/1) RGB images")
")
 product")
 and false color (using bands 7/2/1) images")
