")
GOES-13 0.63 µm visible channel images (click image to play animation)
AWIPS images of GOES-13 0.63 µm visible channel data (above; click image to play animation) showed that 17 May 2011 was a generally cloud-free day over the state of Wisconsin.
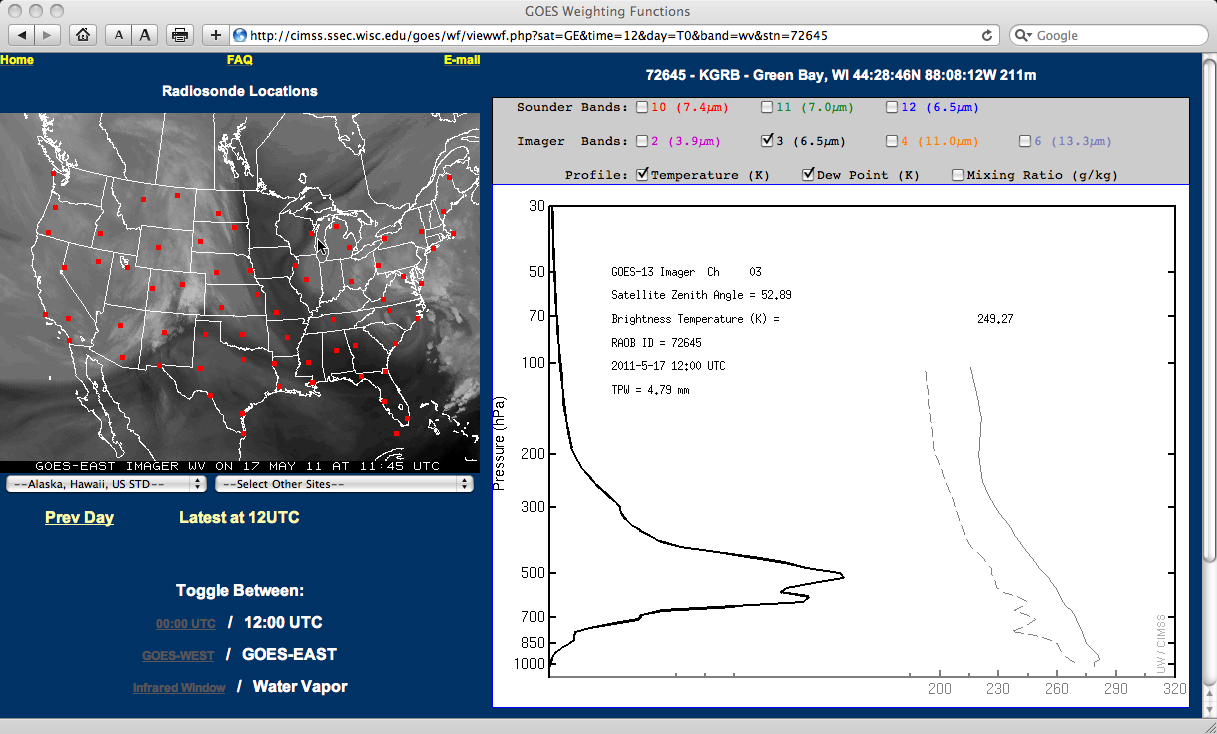
However, the GOES-13 6.5 µm “water vapor channel” images (below; click image to play animation) displayed a series of well-defined “dry cyclonic swirls” aloft that were propagating southwestward. Due to the dry air associated with these features, the weighting function of the GOES-13 imager water vapor channel was shifted downward, sampling a layer that peaked near 500 hPa. GOES imager and sounder weighting functions for a particular rawinsonde location are available here.
")
GOES-13 6.5 µm water vapor channel images (click image to play animation)
A comparison of the 1-km resolution MODIS 6.7 µm water vapor image with the corresponding 4-km resolution GOES-13 6.5 µm water vapor image (below) demonstrated the advantage of improved spatial resolution for displaying the edges and gradients associated with such features. The effect of parallax (due to the large viewing angle of the geostationary satellite positioned at the Equator) acted to shift the location of the GOES-13 features slightly to the northwest compared to the image from the polar-orbiting satellite that carries the MODIS instrument.

MODIS 6.7 µm water vapor image + GOES-13 6.5 µm water vapor image
Hourly images of the GOES-13 sounder Total Column Ozone product (below; click image to play animation) revealed that ozone levels were quite high (over 400 Dobson Units, darker red color enhancement) within the large “dry swirl” feature that was moving over Wisconsin — this suggests that the dry vortex features seen on the water vapor imagery were actually stratospheric intrusion vortices (since high ozone is a characteristic of stratospheric air).
")
GOES-13 sounder Total Column Ozone product (click image to play animation)
The Advanced Baseline Imager (ABI) instrument on the future GOES-R satellite will have an ozone channel, which will allow for this type of total column ozone product to be generated at higher spatial and temporal resolution that the current GOES Sounder instrument can provide.
A northwest-to-southeast oriented vertical cross section using RUC13 model fields (below) illustrated how low the tropopause (taken to be the height of the “PV1.5” Potential Vorticity surface) had descended within the PV anomaly associated with the stratospheric intrusion vortex over Wisconsin at 16:00 UTC.

RUC-13 model northwest-to-southeast oriented vertical cross section
As is sometimes the case with these features, there were a few pilot reports of light to moderate turbulence around the periphery of the well-defined stratospheric intrusion vortex as it moved across the region (below; click image to play animation).
")
GOES-13 6.5 µm water vapor images + pilot reports of turbulence (click image to play animation)
CIMSS participation in GOES-R Proving Ground activities includes making products such as the GOES Sounder Total Column Ozone and MODIS imagery available for National Weather Service forecasters to add to their AWIPS workstations. The VISIT training lessons “Water Vapor Imagery and Potential Vorticity Analysis” and “MODIS Products in AWIPS” are available to help users understand the products and their applications to weather analysis and forecasting.
View only this post Read Less


")

 images")


")
