")
GOES-13 0.63 µm visible channel images (click image to play animation)
McIDAS images of GOES-13 0.63 µm visible channel data (above; click image to play animation) showed that there was still a great deal of ice remaining in much of Hudson Bay, Canada on 29 June 2011. However, it is interesting to note the motion of the ice on the high-speed animation — some of the ice features move in one direction, stop, and then move in a nearly opposite direction during the course of the day. A ridge of high pressure was in place across the region, with surface winds generally from the northeast over the eastern portion of Hudson Bay, and surface winds from the southwest over the western portion of Hudson Bay (ASCAT winds).
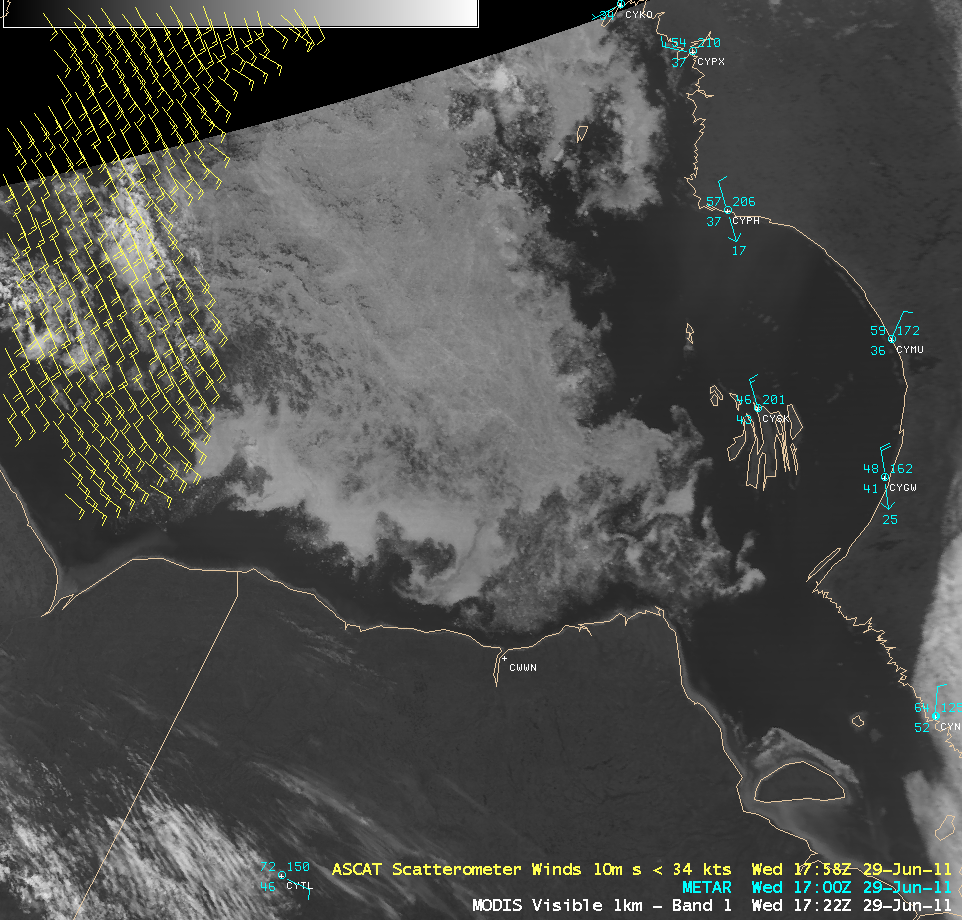
A comparison of AWIPS images of the MODIS 0.65 µm visible channel and a false color Red/Green/Blue (RGB) image (created using MODIS bands 01/07/07 as the R/G/B components of the image) confirmed that it was ice occupying the majority of Hudson Bay — ice features (as well as glaciated clouds) appear as shades of red on the false color image. According to an analysis performed by the Canadian Ice Service, this consisted of thick to medium first year ice.

MODIS 0.65 µm visible channel image + MODIS false color RGB image
Toward the end of the GOES-13 visible channel animation above, the hazy signature of smoke aloft could be seen drifting south-southwestward over the far eastern part of Hudson Bay. This smoke — a result of wildfires burning in northern and western Canada — also showed up well in a MODIS true color RGB image (below) from the SSEC Direct Broadcast site.

MODIS true color RGB image
An AWIPS image of the MODIS Sea Surface Temperature (SST) product (below) revealed that SST values were still in the 30s F (darker blue color enhancement) across much of Hudson Bay, with a few pockets of warmer water seen in various locations.

MODIS Sea Surface Temperature product
CIMSS participation in GOES-R Proving Ground activities includes making a variety of MODIS images and products available for National Weather Service offices to add to their local AWIPS workstations. The VISIT training lesson “MODIS Products in AWIPS” is available to help users understand these products and their applications to weather analysis and forecasting.
View only this post Read Less

")
")


 images")


