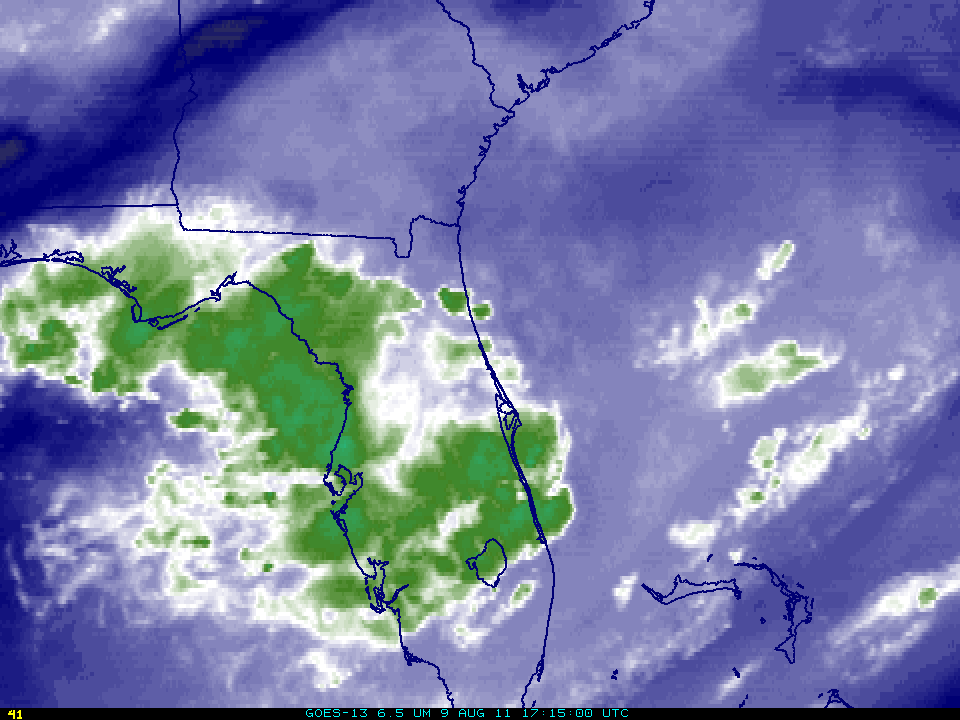
Turbulence associated with a developing line of convection over the Atlantic Ocean east of Florida was severe enough on August 9th to cause five injuries on a Miami-to-Washington DC flight and force an unscheduled landing of the 737-800 aircraft in Charleston, SC. The GOES-13 image, above, shows the path that... Read More

GOES-13 Visible with Airplane Positions
Turbulence associated with a developing line of convection over the Atlantic Ocean east of Florida was severe enough on August 9th to cause five injuries on a Miami-to-Washington DC flight and force an unscheduled landing of the 737-800 aircraft in Charleston, SC. The GOES-13 image, above, shows the path that the aircraft took through a line of developing convection east of Florida (Click here for a flash-based animation). The time that the satellite was scanning the region east of Florida was between 1935 and 1936 UTC (the nominal time of the image, 1932 UTC, refers to the first line scanned in by GOES-13; it takes almost 5 minutes to completely scan North America. See this NESDIS website for the normal scanning schedule).
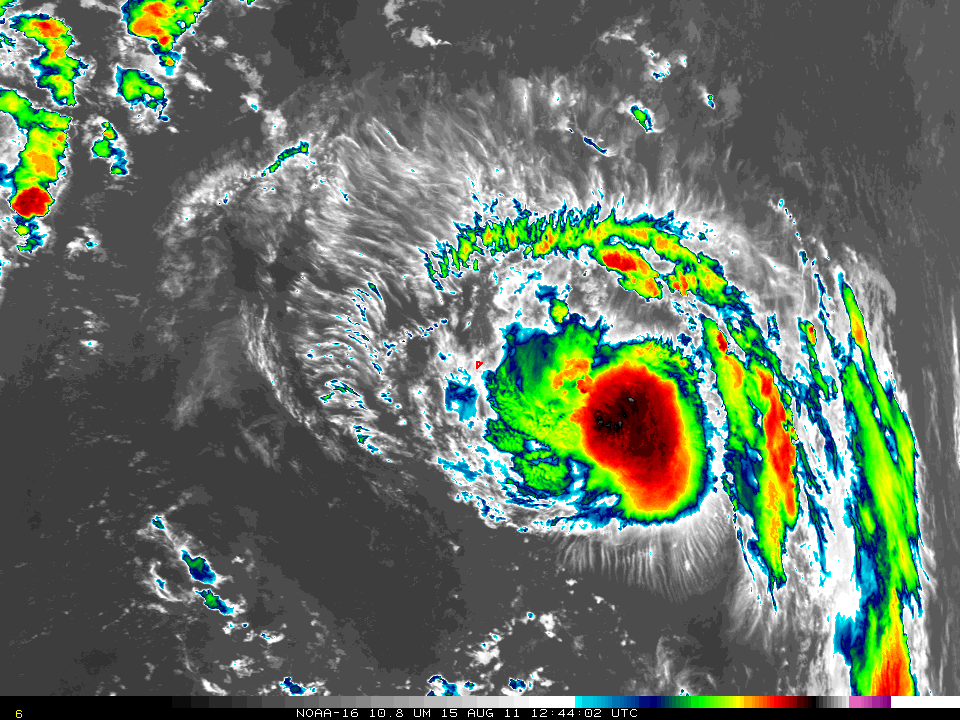
Animations of visible imagery, 10.7-micrometer infrared imagery, and 6.5-micrometer infrared imagery (the so-called ‘water vapor channel’) all show a similar evolution, namely strong thunderstorms at the coast of Florida at the start of the loop followed by the development of a line of thunderstorms northeastward. It is through this developing line that the airline penetrated. (The flight path is here).
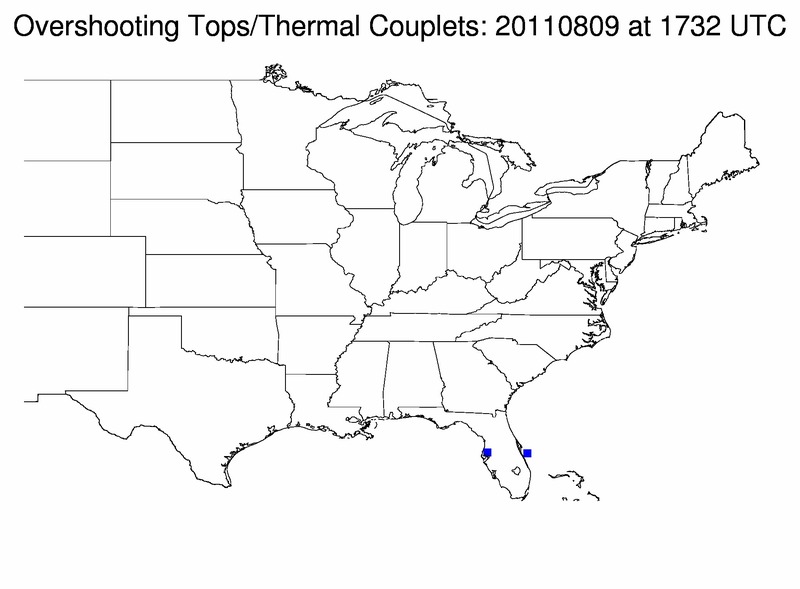
GOES Satellite data are routinely monitored to detect both the initiation of convection, and the presence of Overshooting Tops and Thermal couplets, the latter two features being well-correlated with severe weather and turbulence. Detection suffers, however, because of the relatively poor spatial and temporal resolution afforded by routine GOES scanning. What was detected on this day?
Overshooting tops were detected over the Florida peninsula at 1715 UTC and at 1732 UTC. The top at 1732 UTC is quite apparent in both the visible and infrared loops. Overshooting tops were not detected in the area again before the turbulence event, but their detection prior to the event suggests an airmass with the potential for strong convective development.
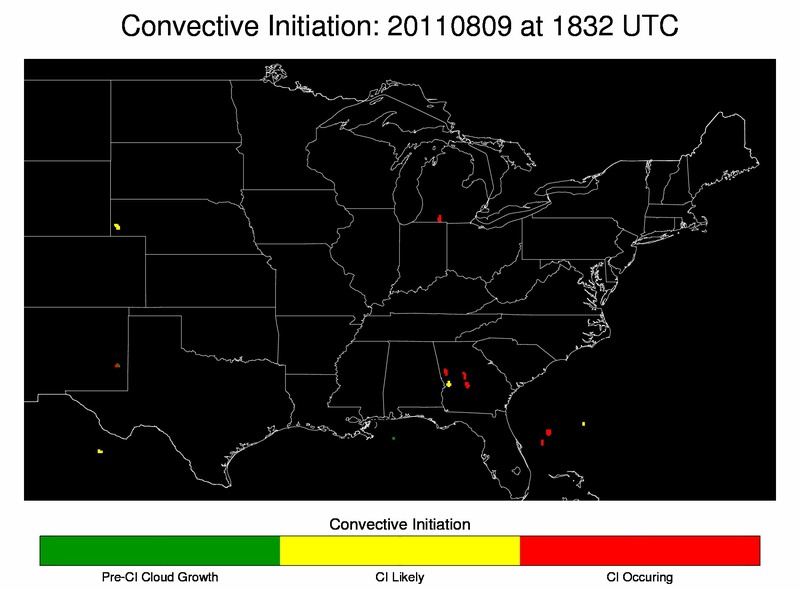
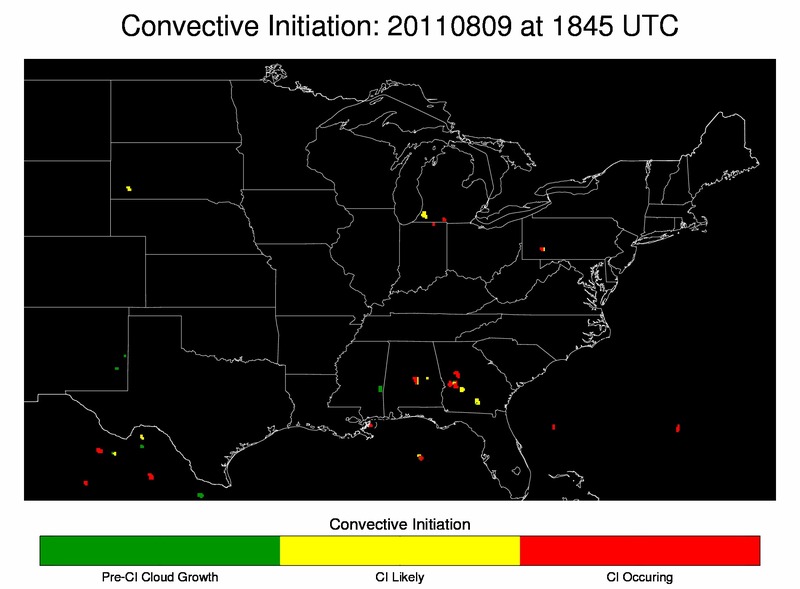
Convective Initiation (CI) was flagged along the southwest-to-northeast line of developing convection at 1832 UTC and 1845 UTC, roughly an hour before the turbulence event. (See this link for all Blog Posts on Convective Initiation). Note that the CI detection in this case — occurring — means that glaciation of the clouds has started. CI is drawing the eye to the convective towers that are growing most rapidly; therefore, their tops cool most quickly. It is to these growing cells that a forecaster must pay attention, particularly when they appear in an environment that will sustain overshooting tops.
(Here is an article on this flight from The Aviation Herald).
View only this post
Read Less


