This website works best with a newer web browser such as Chrome, Firefox, Safari or Microsoft
Edge. Internet Explorer is not supported by this website.
Target Sector (2.5-minute interval) JMA Himawari-9 AHI Red Visible (0.64 µm) and Clean Infrared Window (10.4 µm) images (above) showed Cyclone Errol as it was rapidly intensifying off the northern coast of Western Australia on 15-16 April 2025. About 2 hours after the end of the above animation, Errol peaked... Read More
2.5-minute JMA Himawari-9 Red Visible (0.64 µm, left) and Clean Infrared Window (10.4 µm, right) images, from 2302 UTC on 15 April to 0942 UTC on 16 April [click to play animated GIF | MP4]
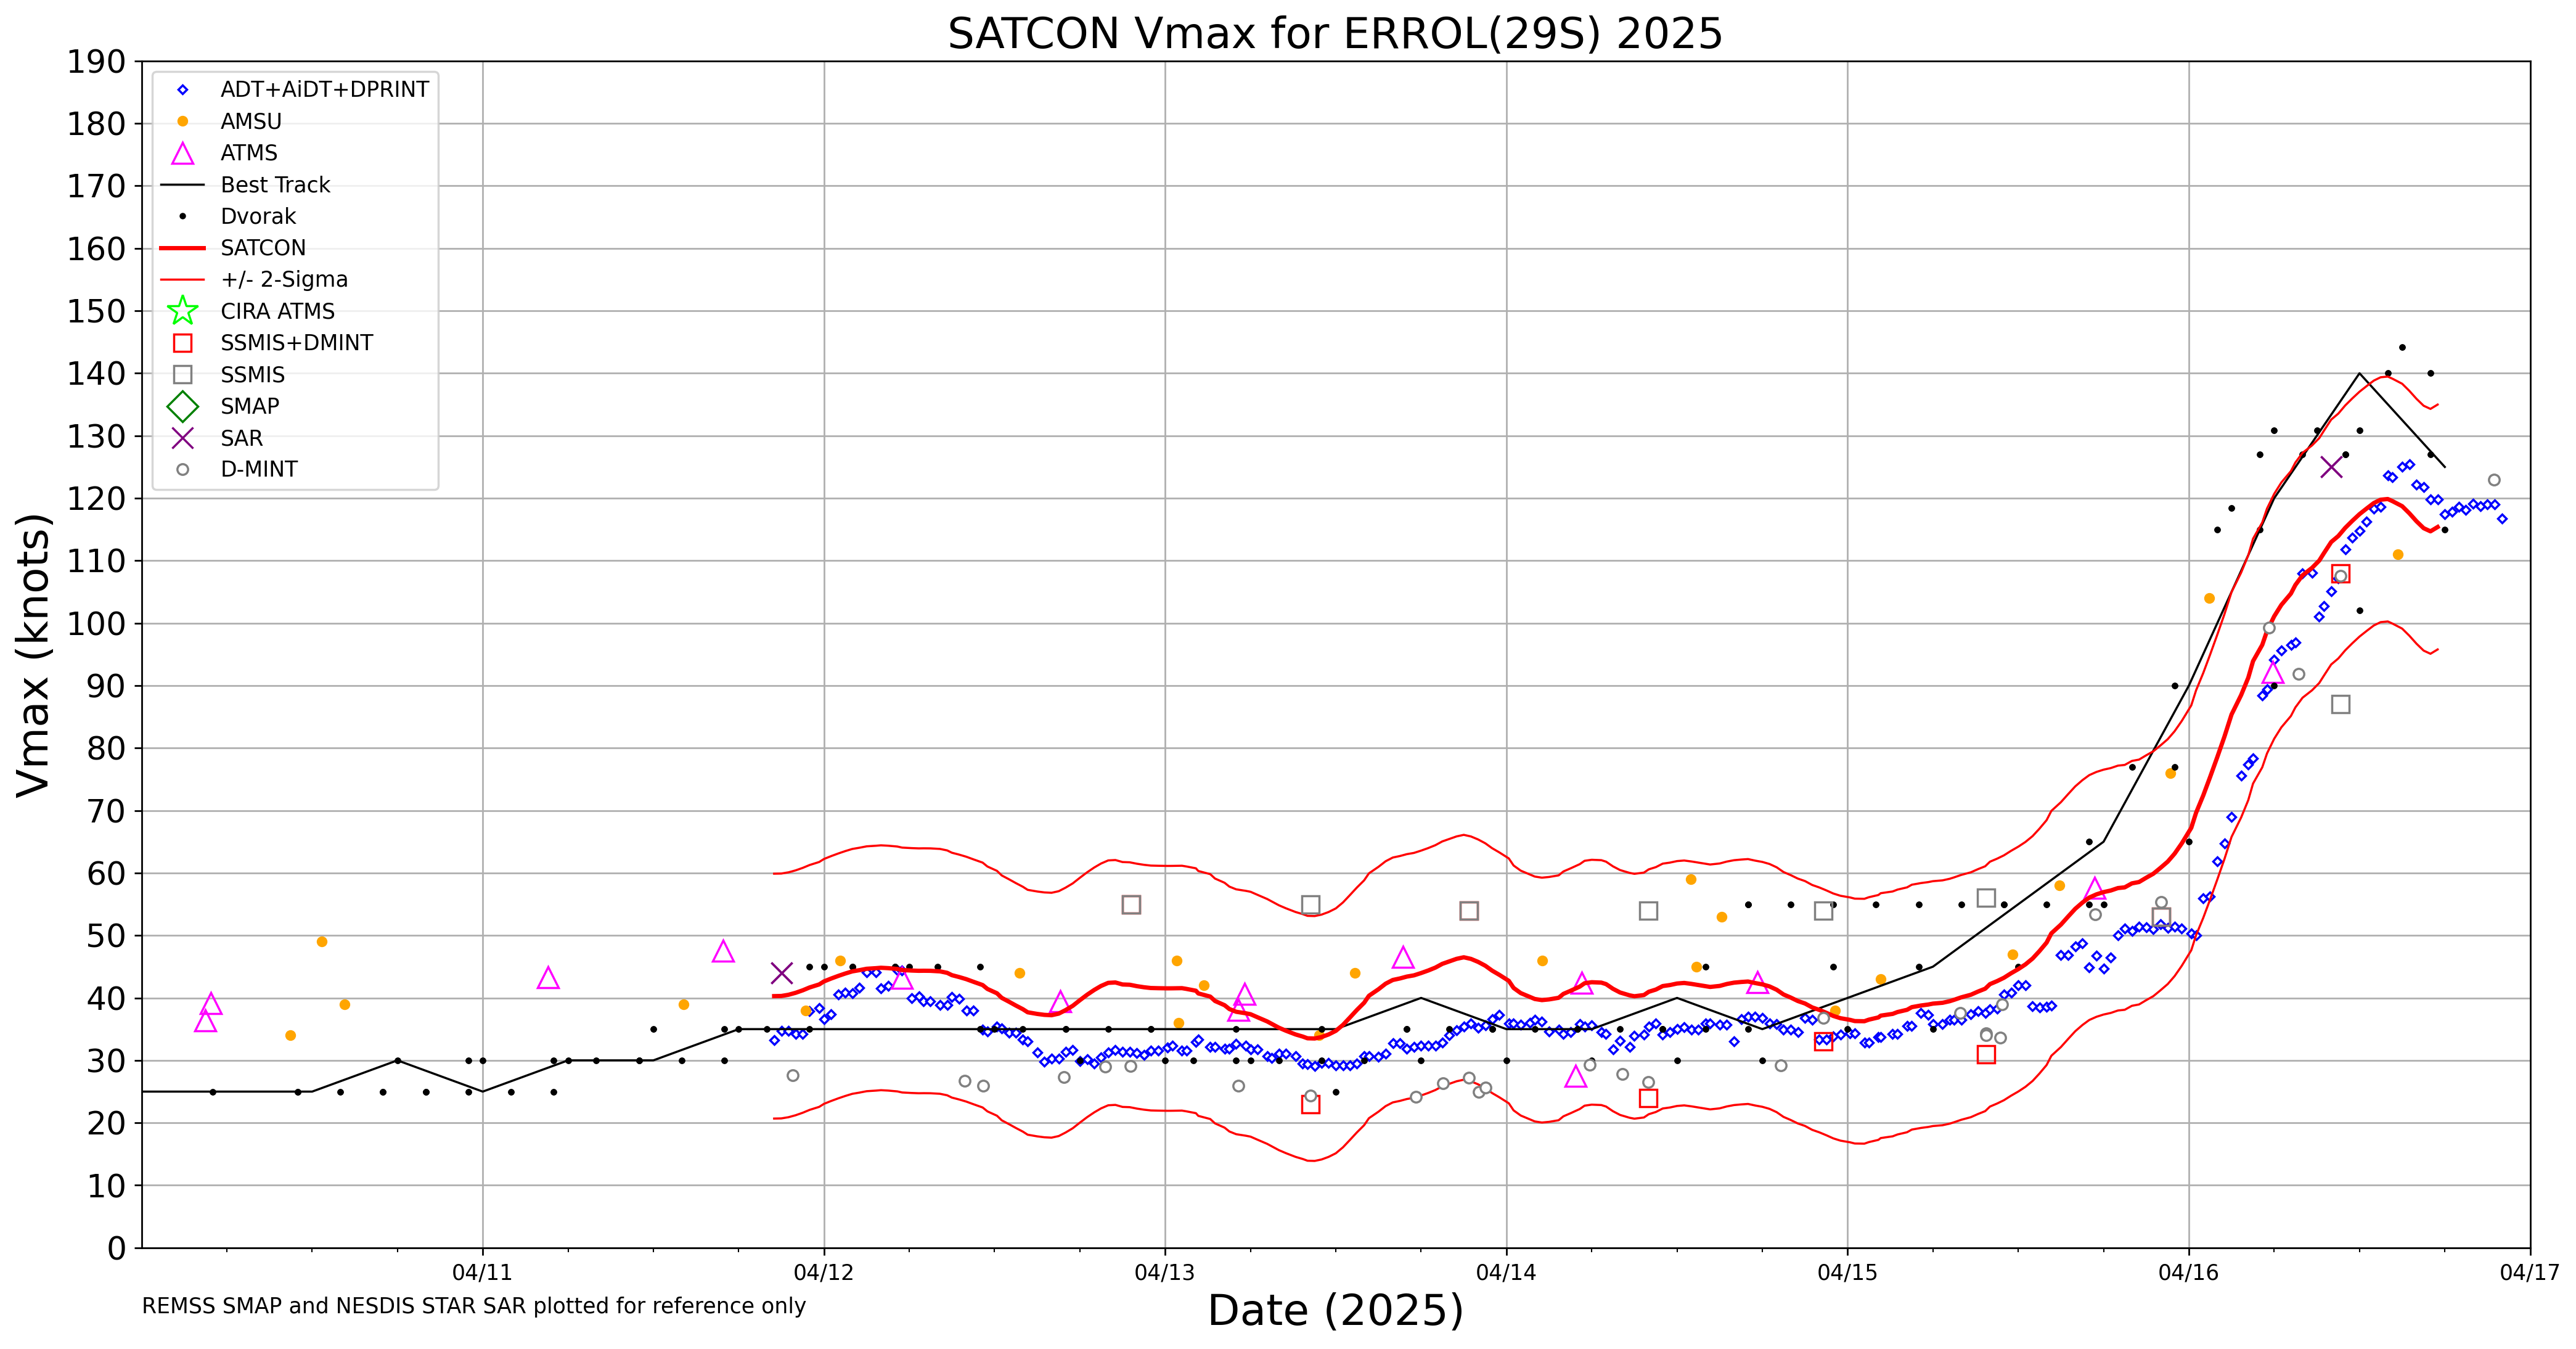
Target Sector (2.5-minute interval) JMA Himawari-9 AHI Red Visible (0.64 µm) and Clean Infrared Window (10.4 µm) images (above) showed Cyclone Errol as it was rapidly intensifying off the northern coast of Western Australia on 15-16 April 2025. About 2 hours after the end of the above animation, Errol peaked at 140 kts — Category 5 intensity — at 1200 UTC (SATCON). Errol exhibited a pinhole eye during the time period shown — a feature frequently observed with rapidly-intensifying tropical cyclones. Cloud-top infrared brightness temperatures in the eyewall region of Errol were in the -80s C (shades of violet to purple).
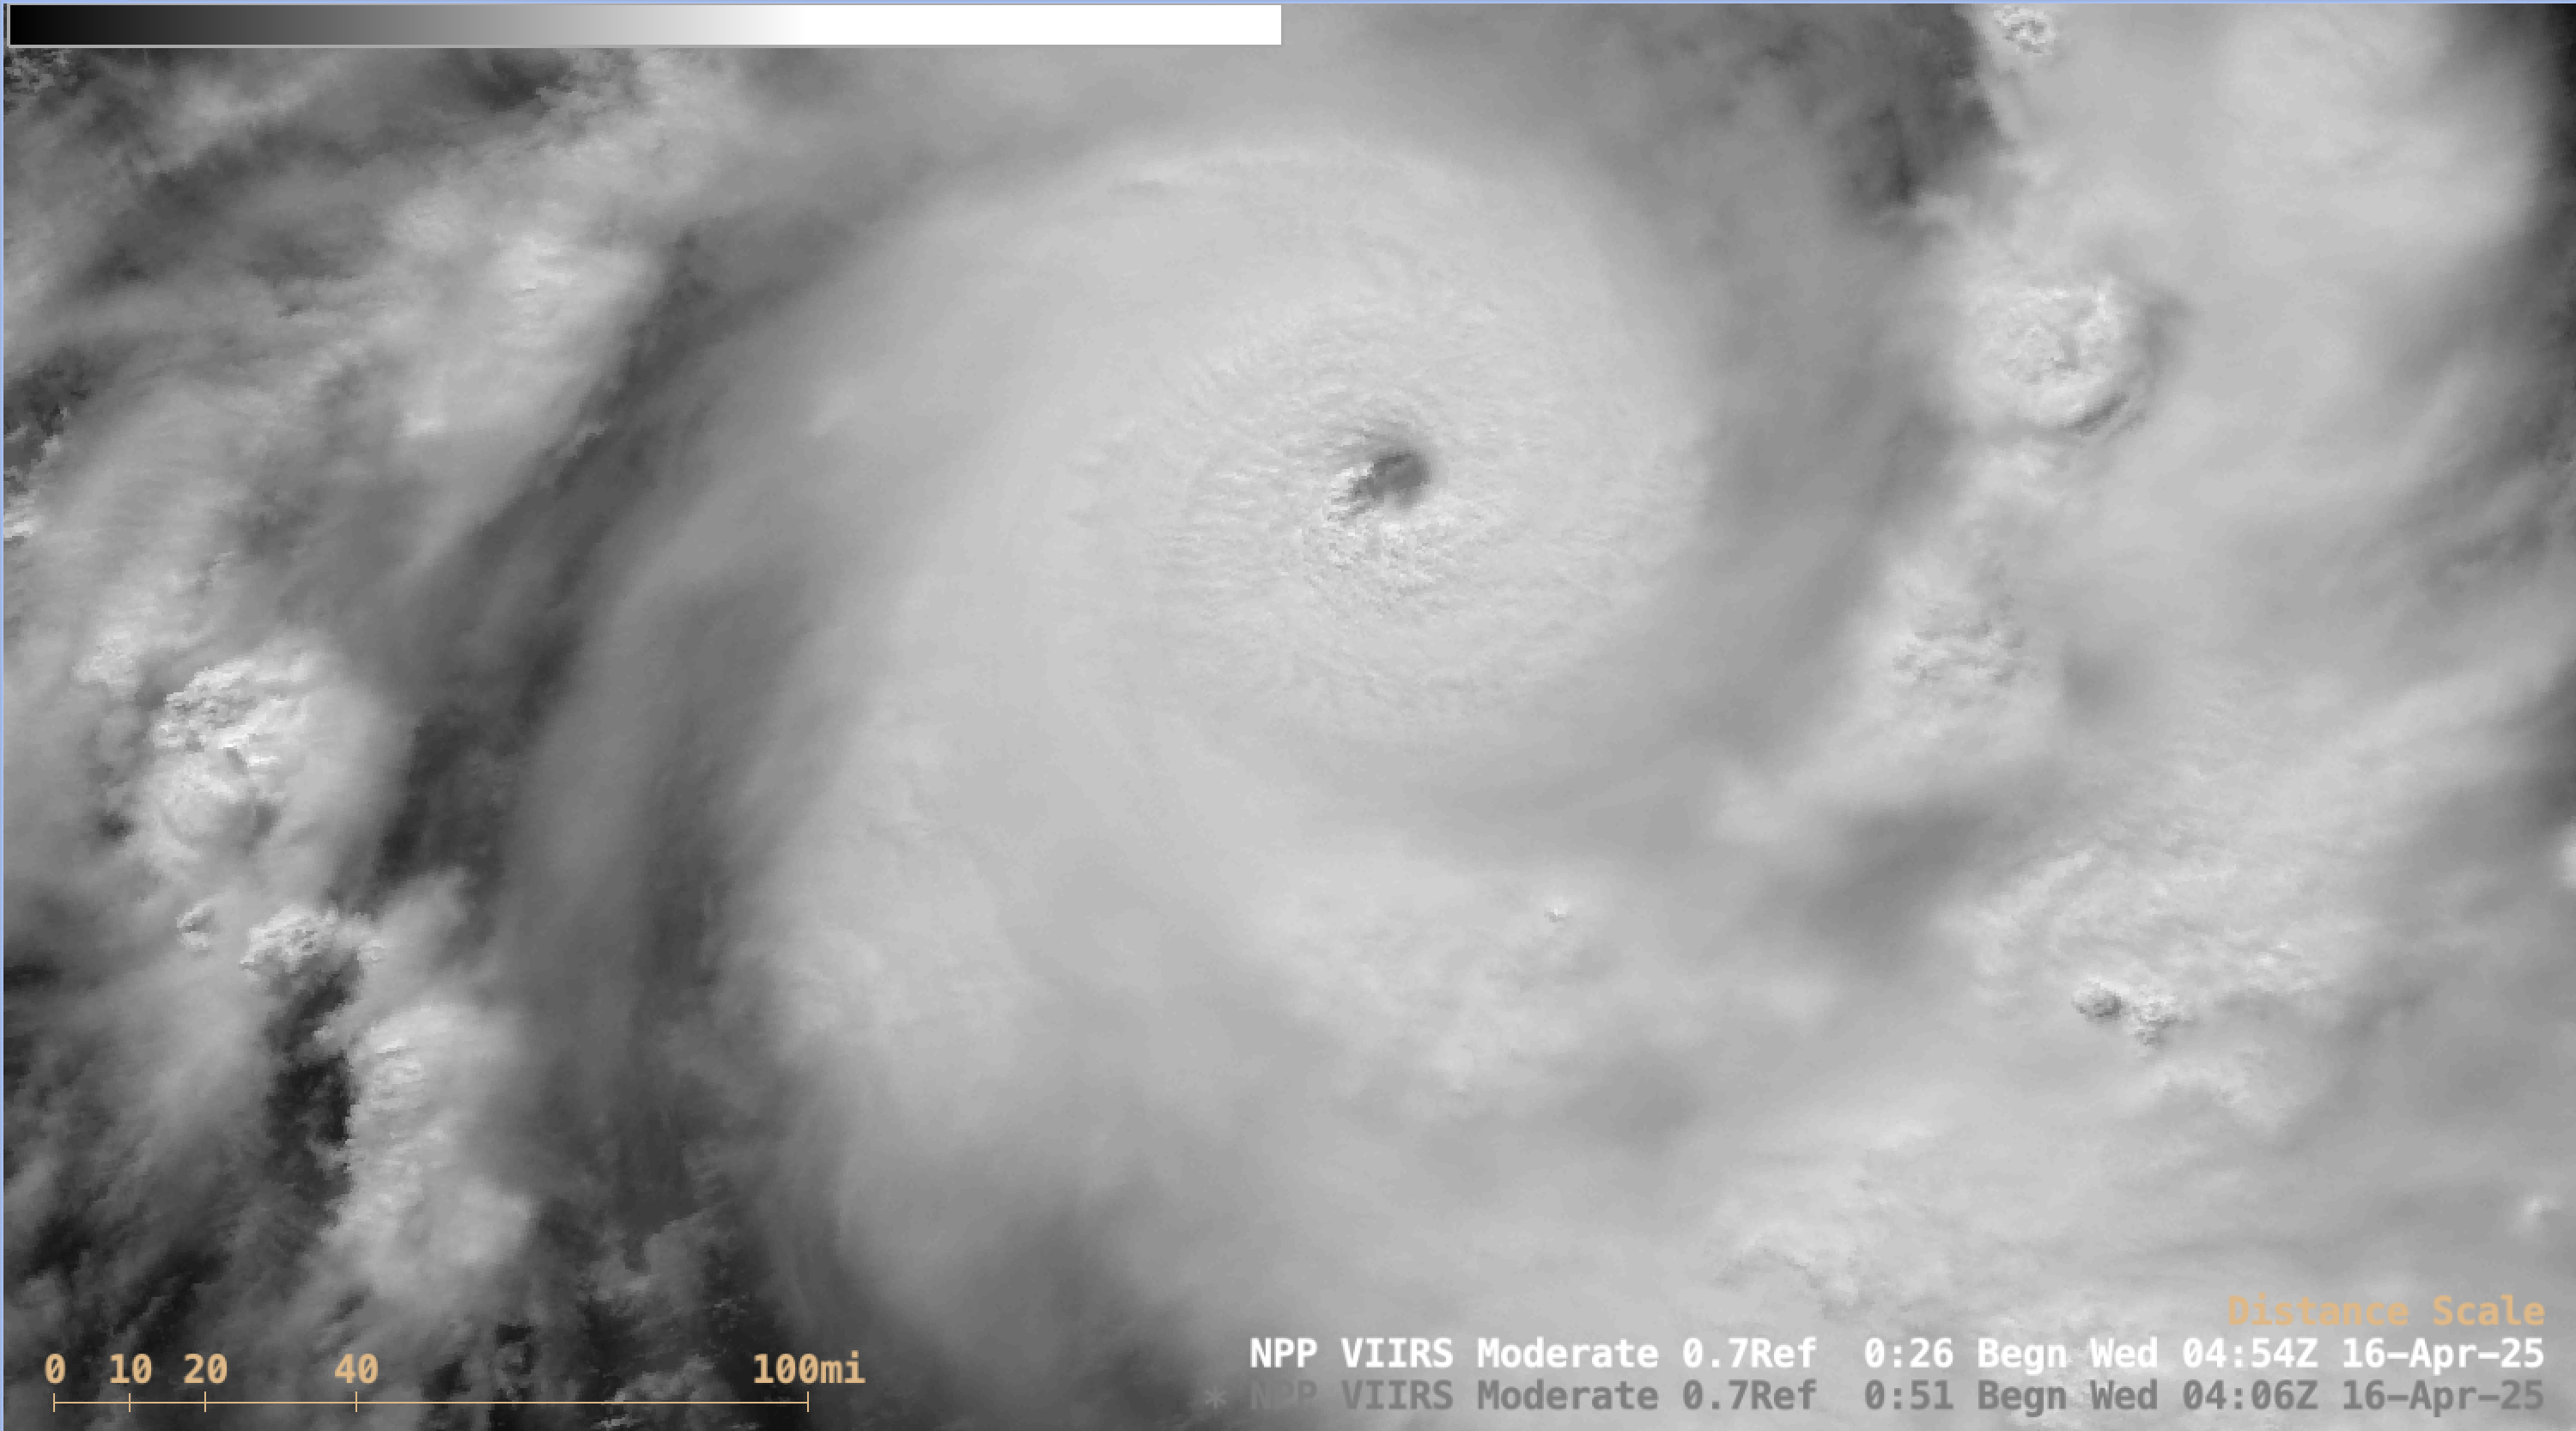
A NOAA-20 VIIRS Day/Night Band image valid at 0503 UTC (below) provided a higher-resolution view of the 10-mile diameter pinhole eye.
NOAA-20 VIIRS Day/Night Band (0.7 µm) image valid at 0503 UTC on 16 April [click to enlarge]
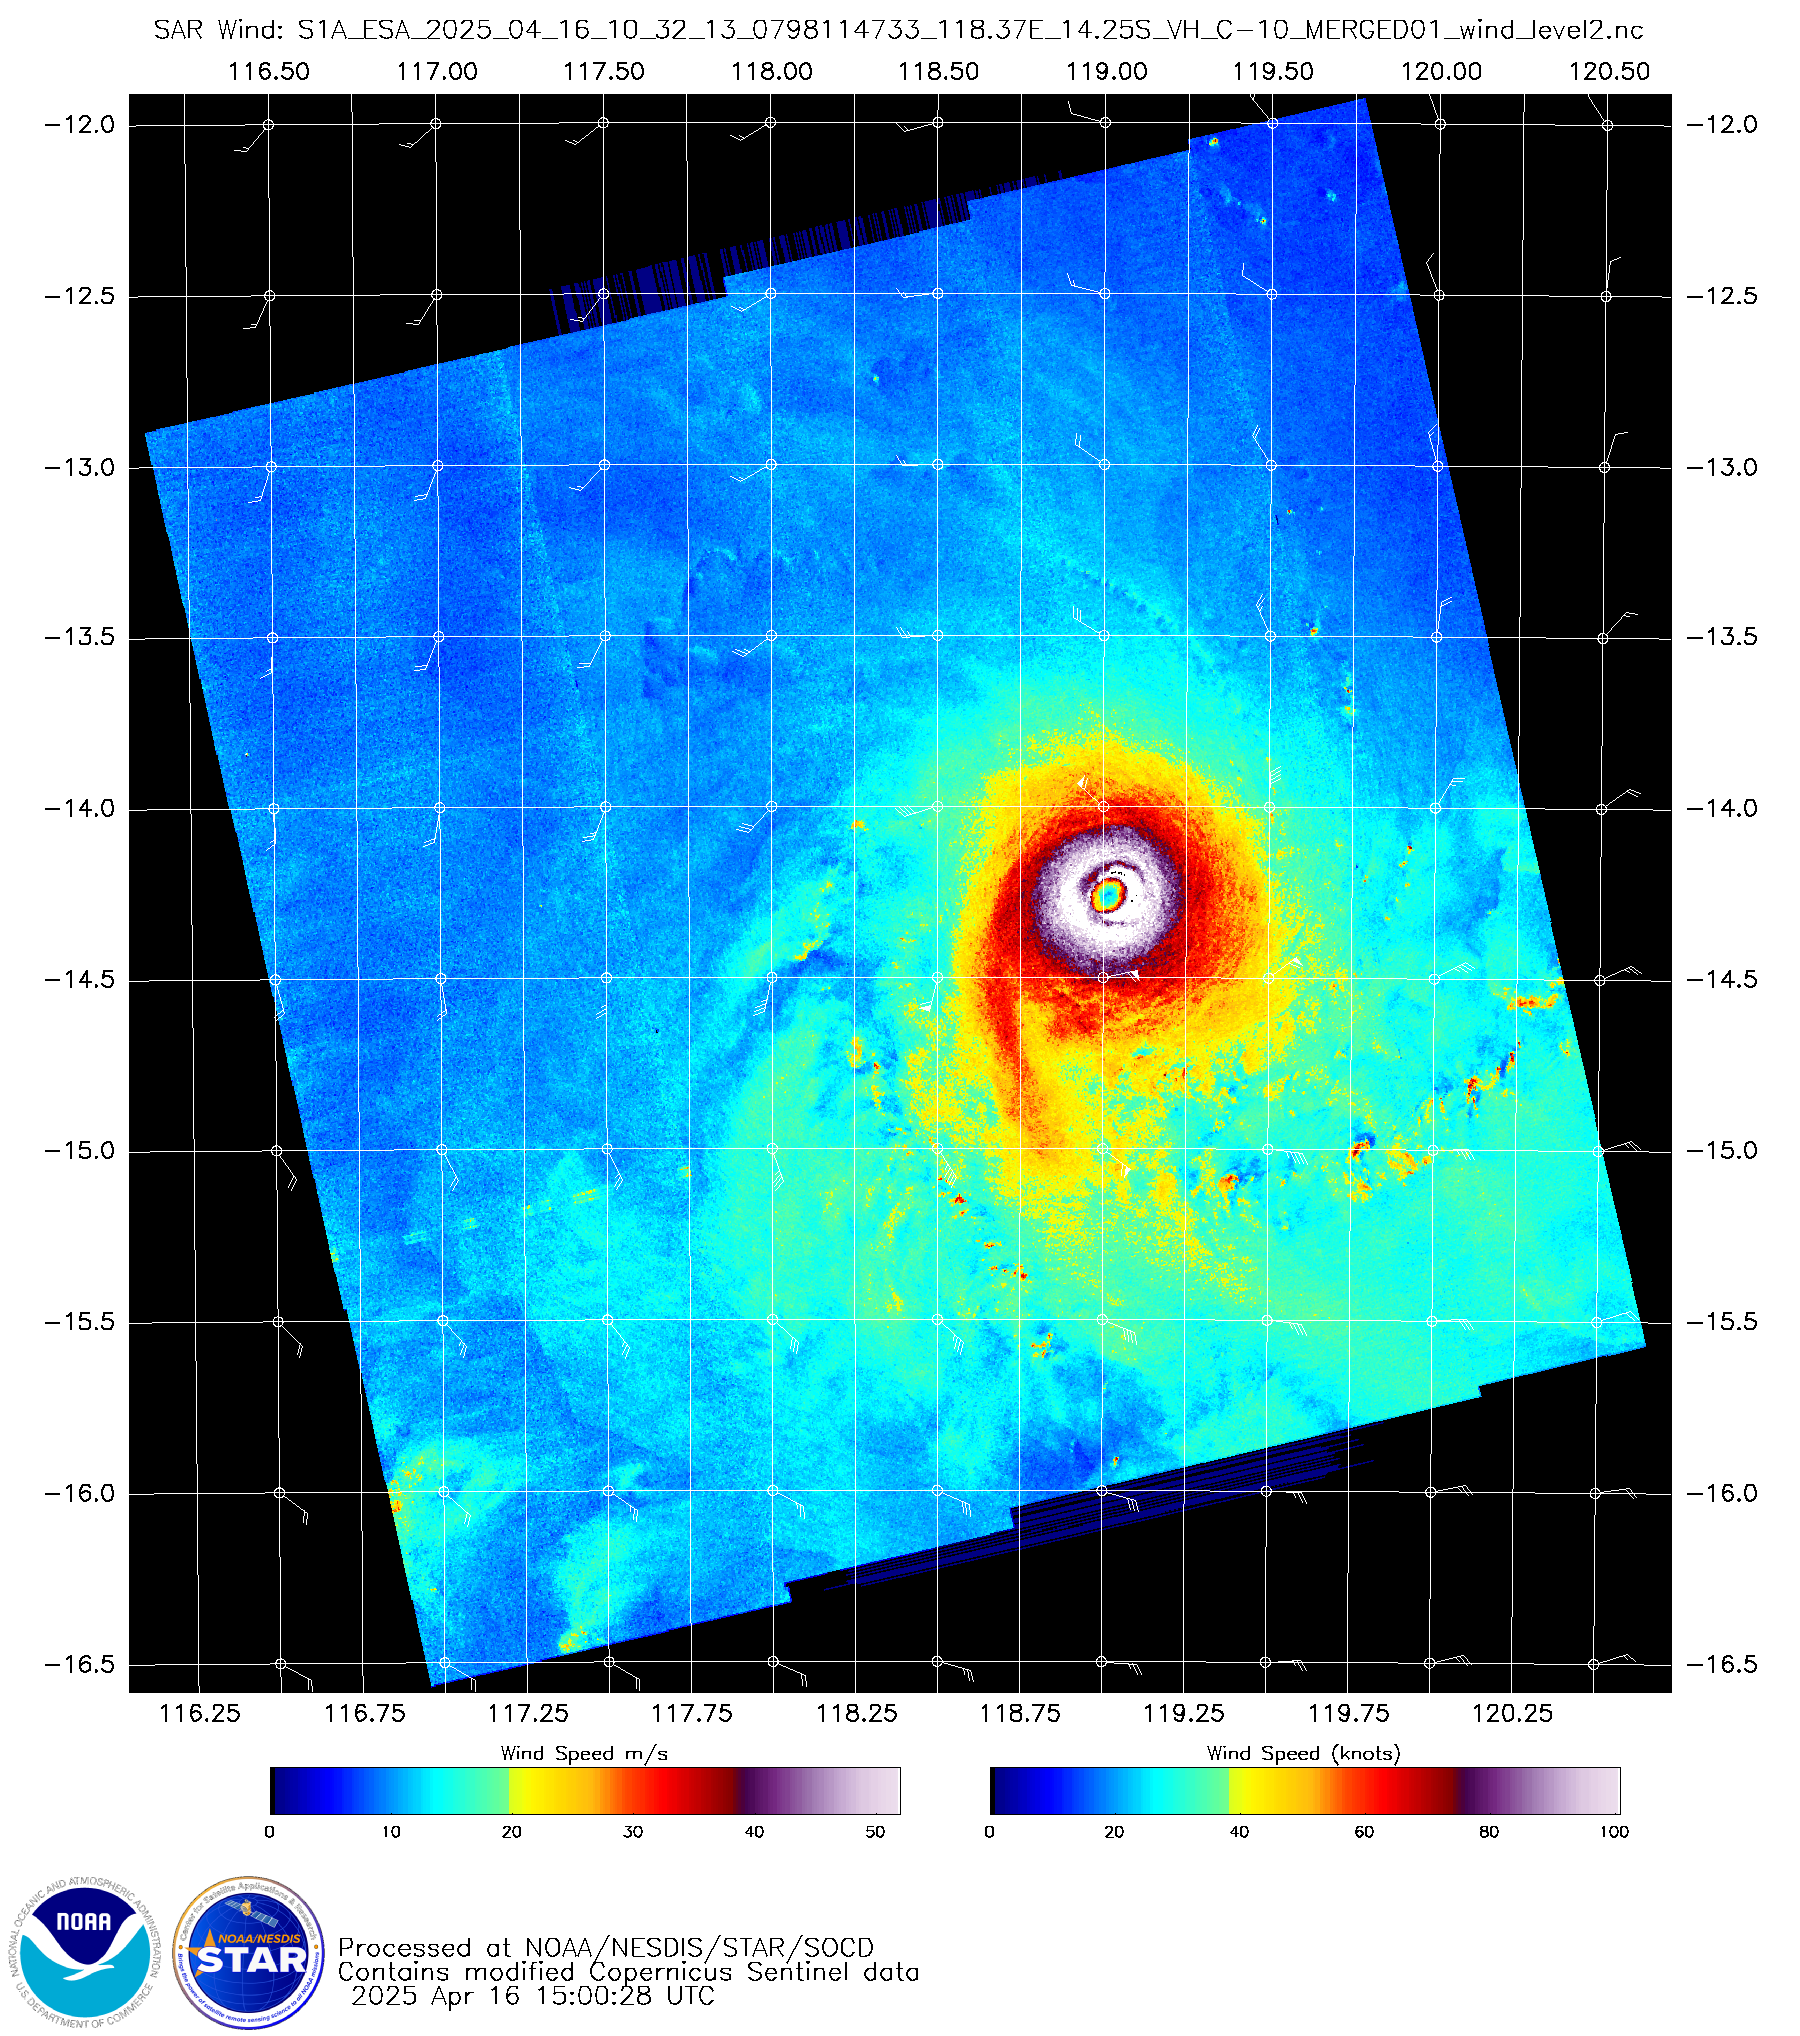
A Sentinel-1A Synthetic Aperture Radar (SAR) image (source) at 1610 UTC (below) sensed a maximum radial wind velocity of 124.8 knots in the northeast quadrant of Errol.
Sentinel-1A SAR image at 1032 UTC on 16 April [click to enlarge]
Factors favoring Errol’s rapid intensification included very warm water that the storm was traversing, and an environment of low deep-layer wind shear(below). Sea Surface Temperature and Wind Shear images were sourced from the CIMSS Tropical Cyclones site.
Plots of deep-layer wind shear centered on Errol, from 2100 UTC on 15 April to 1500 UTC on 16 April
Instrument issues at the weather station in Pago Pago (related to Hydrogen generation) means that balloon launches occur only once every other day, at 0000 UTC on odd days. The sounding for 15 April/0000 UTC (1 PM Samoa Standard time on 14 April) is shown below.Two different JPSS satellites overflew... Read More
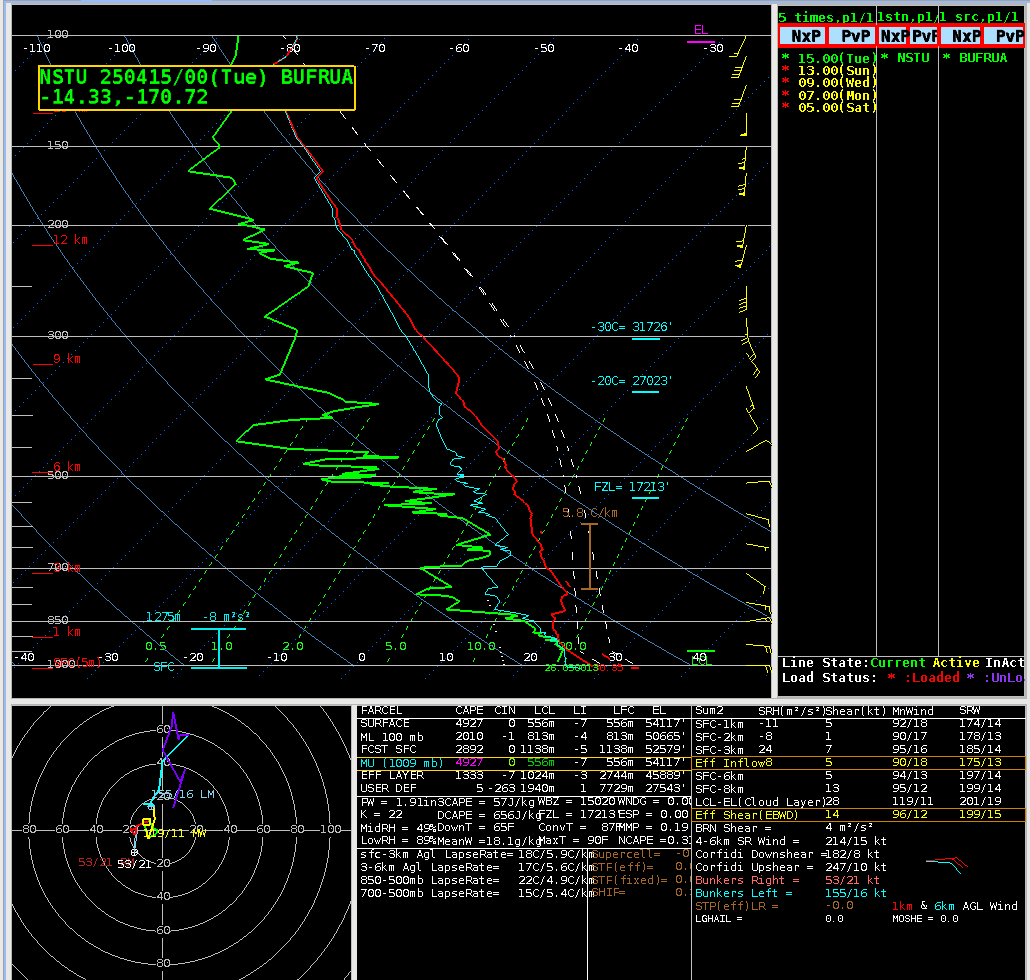
Instrument issues at the weather station in Pago Pago (related to Hydrogen generation) means that balloon launches occur only once every other day, at 0000 UTC on odd days. The sounding for 15 April/0000 UTC (1 PM Samoa Standard time on 14 April) is shown below.
Upper Air Sounding at NSTU/91765 (Pago Pago, AS), 0000 UTC on 15 April 2025 (Click to enlarge)
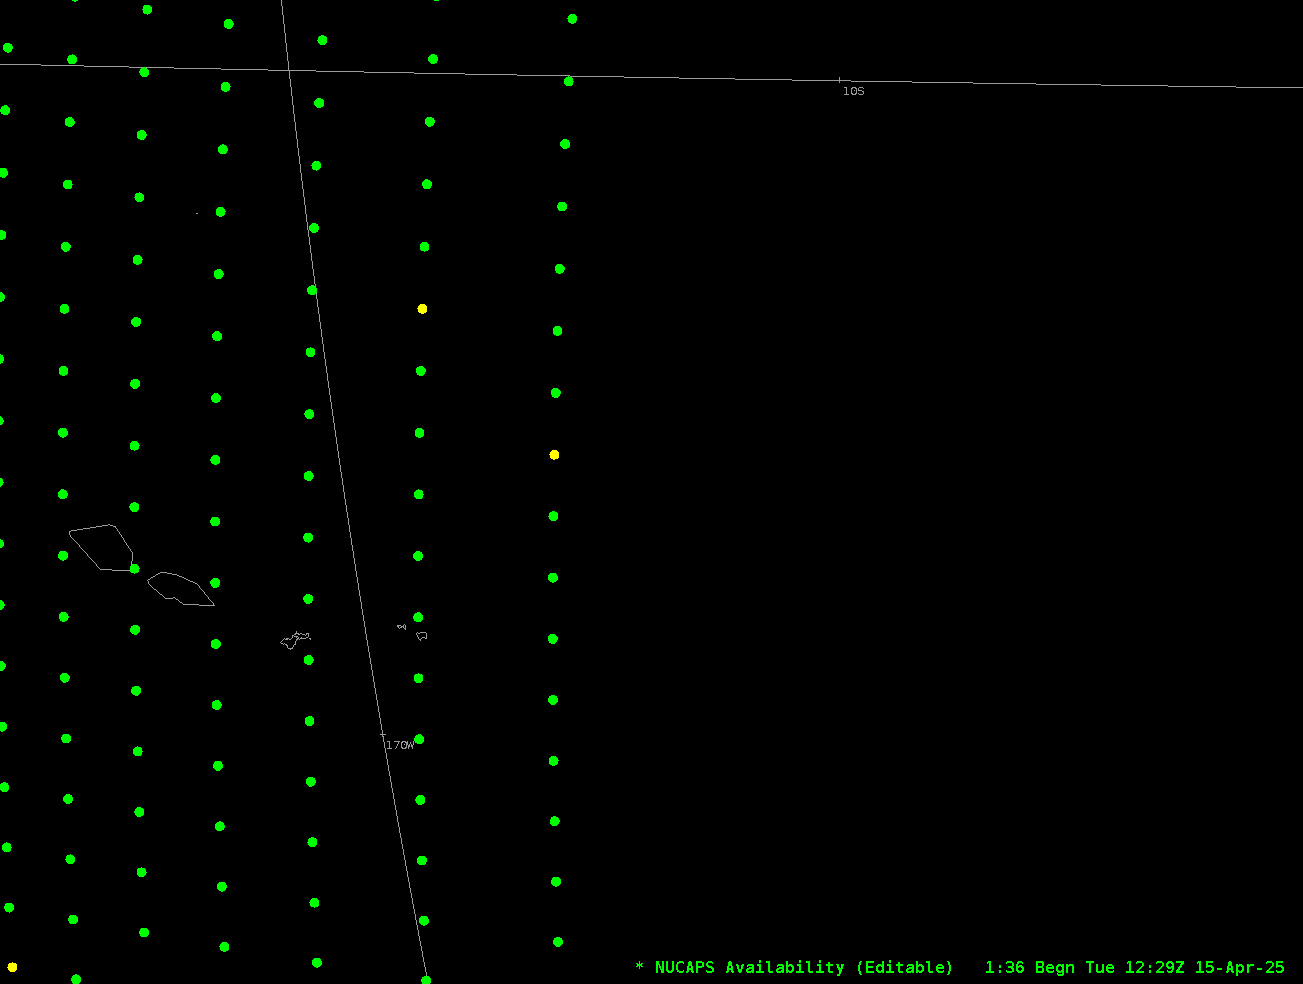
Two different JPSS satellites overflew the Samoan Islands just after 0000 UTC on 15 April 2025, and two profiles were created just west of Tutuila, as shown below.
NUCAPS Sounding Availability Plots and 2 Profiles near Tutuila, ca. 0000 UTC on 15 April 2025 (Click to enlarge)
The toggle below compares the two NUCAPS soundings shown in the image above to the 0000 UTC rawinsonde from Pago Pago. There is, overall, agreement, although (of course), the NUCAPS soundings are very much smoother.
Animation comparing the sounding at NSTU/91765 (Pago Pago AS) at 0000 UTC with two nearby NUCAPS profiles (Click to enlarge)
At 1200 UTC, no rawinsonde was launched. But NUCAPS profiles were available at around 1200 and 1300 UTC as shown in the animations below.
NUCAPS Profiles ca. 1218 UTC on 15 April 2025 (Click to enlarge)NUCAPS Profiles ca. 1306 UTC on 15 April 2025 (Click to enlarge)
If you compare the 0000 UTC NUCAPS profiles to those sensed around 1200-1300 UTC, what changes do you see, and how might those changes have been sensed by a rawinsonde if it had been launched. The later profiles all show dryer conditions at mid-latitudes (precipitable water values have dropped by about 0.4″). Temperatures above 700 mb are very similar in the two profiles, but the later profile is a bit cooler between the surface and 850 mb
NUCAPS profiles near Tutuila, 0000 and 1300 UTC on 15 April 2025 (Click to enlarge)
The information change in the 12h between NUCAPS profiles (note also that there was a NUCAPS profile at around 0900 UTC!) can help you decide what a full-resolution sounding (made by a radiosonde) might have looked like.
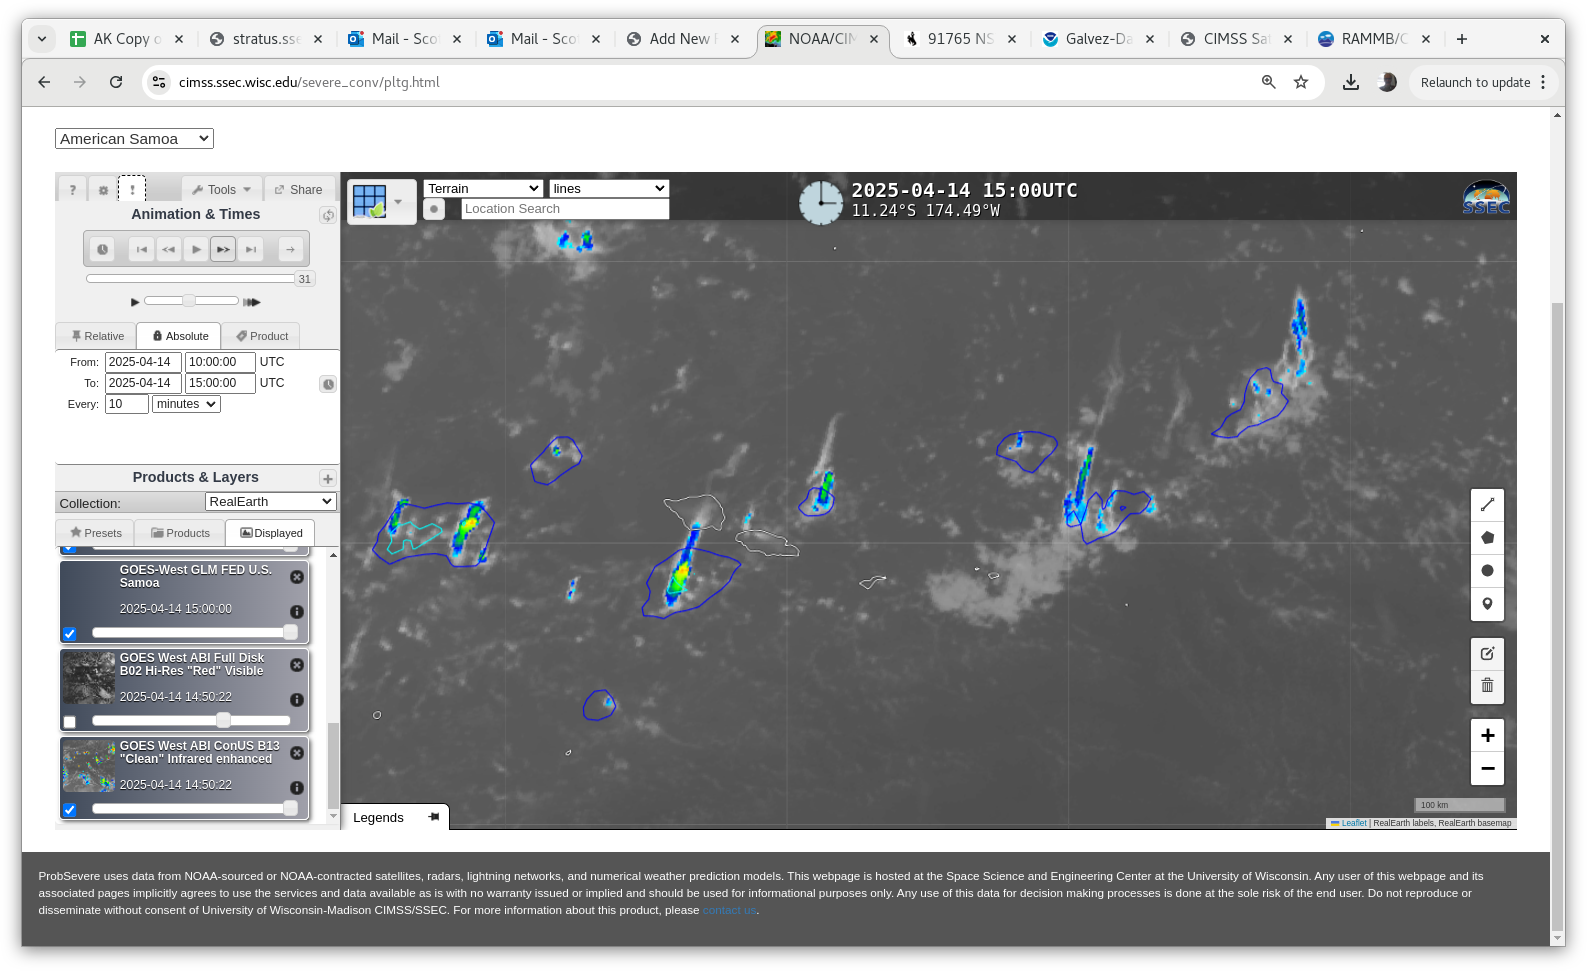
Thursday 17 April is the 125th anniversary of the beginning of American Sovereignty over American Samoa. Part of the celebration includes the Fautasi, a regatta that depends on weather. What tools are available to help forecast in the long-term and in the short-term? The animation above (from the CSPP Geosphere site) shows the Night... Read More
Thursday 17 April is the 125th anniversary of the beginning of American Sovereignty over American Samoa. Part of the celebration includes the Fautasi, a regatta that depends on weather. What tools are available to help forecast in the long-term and in the short-term? The animation above (from the CSPP Geosphere site) shows the Night Microphysics RGB during the early morning of 14 April, and periodic convection is occurring. The low clouds — white and pink against the blue background — are occasionally spawning deeper convection that is a deep red in the RGB. These convective towers are short-lived. This kind of information might be useful in the short-term for diagnosing where precipitation is occurring the night before the regatta.
GOES-18 Night Microphysics RGB, 1100-1500 UTC on 14 April 2025MIMIC Total Precipitable Water fields, 1800 UTC 13 April – 1700 UTC 14 April 2025 (Click to enlarge)
MIMIC Total Precipitable Water fields, above, show the Samoan Islands along the southern edge of deeper moisture that is the South Pacific Convergence Zone between the islands and the Equator. Animations such as these can help a forecaster anticipate the approach (or retreat) of deep moisture that could support heavy rains.
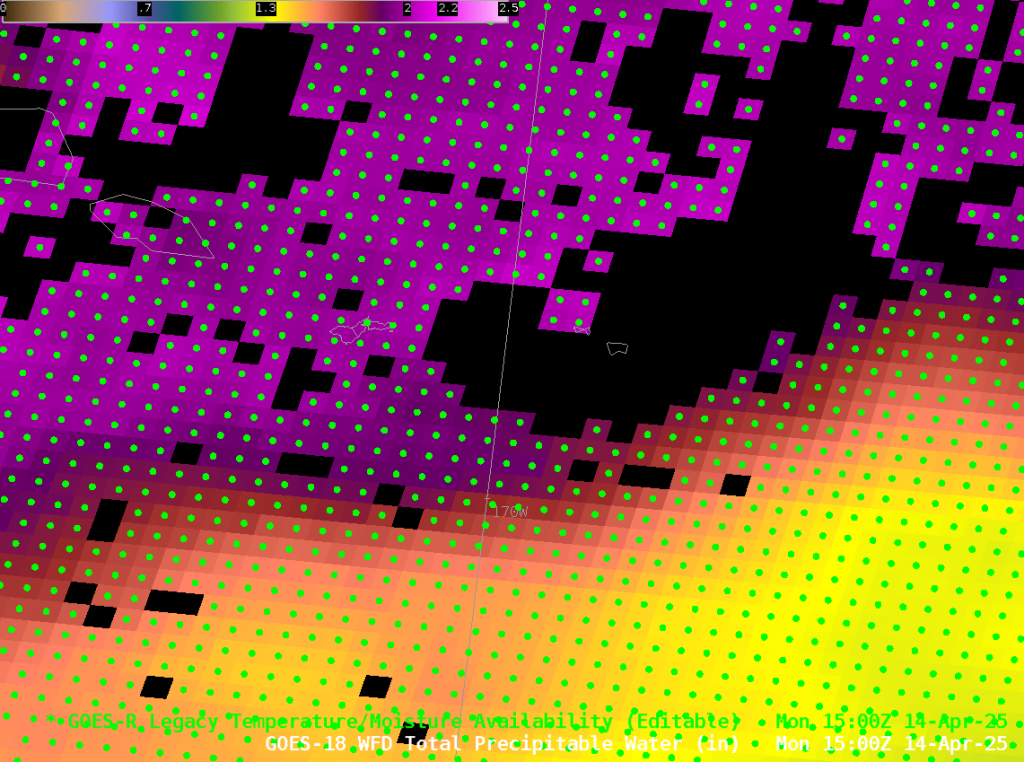
The GOES-18 Clear-Air estimates of Total Precipitable Water, below, similarly show a gradient just south of the Samoan Islands, with values dropping from over 2″ over American Samoa (the purple enhancement) to about 1.5″ to the south (the yellow enhancement).
GOES-18 Total Precipitable Water fields, 1500 UTC on 14 April 2025 (Click to enlarge)
The green points above show where Legacy Profiles exist, and the animation below highlights the profile very close to Pago Pago in the center of Tutuila. The low-level stability in the sounding and mid-level dry air are consistent with the occasional convective development (and quick dissipation) observed in the Night Microphysics imagery above.
Legacy Profiles over Tutuila, 1000, 1100, 1200 and 1500 UTC on 14 April 2025 (Click to enlarge)
LightningCast probabilities (available at this site) can be used in the short term for Decision Support for outdoor activities. The animation below shows probability fields for the overnight hours, 1200-1500 UTC on 14 April 2025, matching the animations above. Probabilities with these showers to not become large, and GLM lightning observations are not present.
LightningCast probabilities over the Samoan Island chain, 1200-1500 UTC on 14 April 2025 (Click to enlarge)
GREMLIN fields (1000-1500 UTC) that estimate radar returns are shown below (from here). Hit-or-miss showers are diagnosed.
GREMLIN radar estimates, 1000-1500 UTC on 15 April 2025 (Click to enlarge)
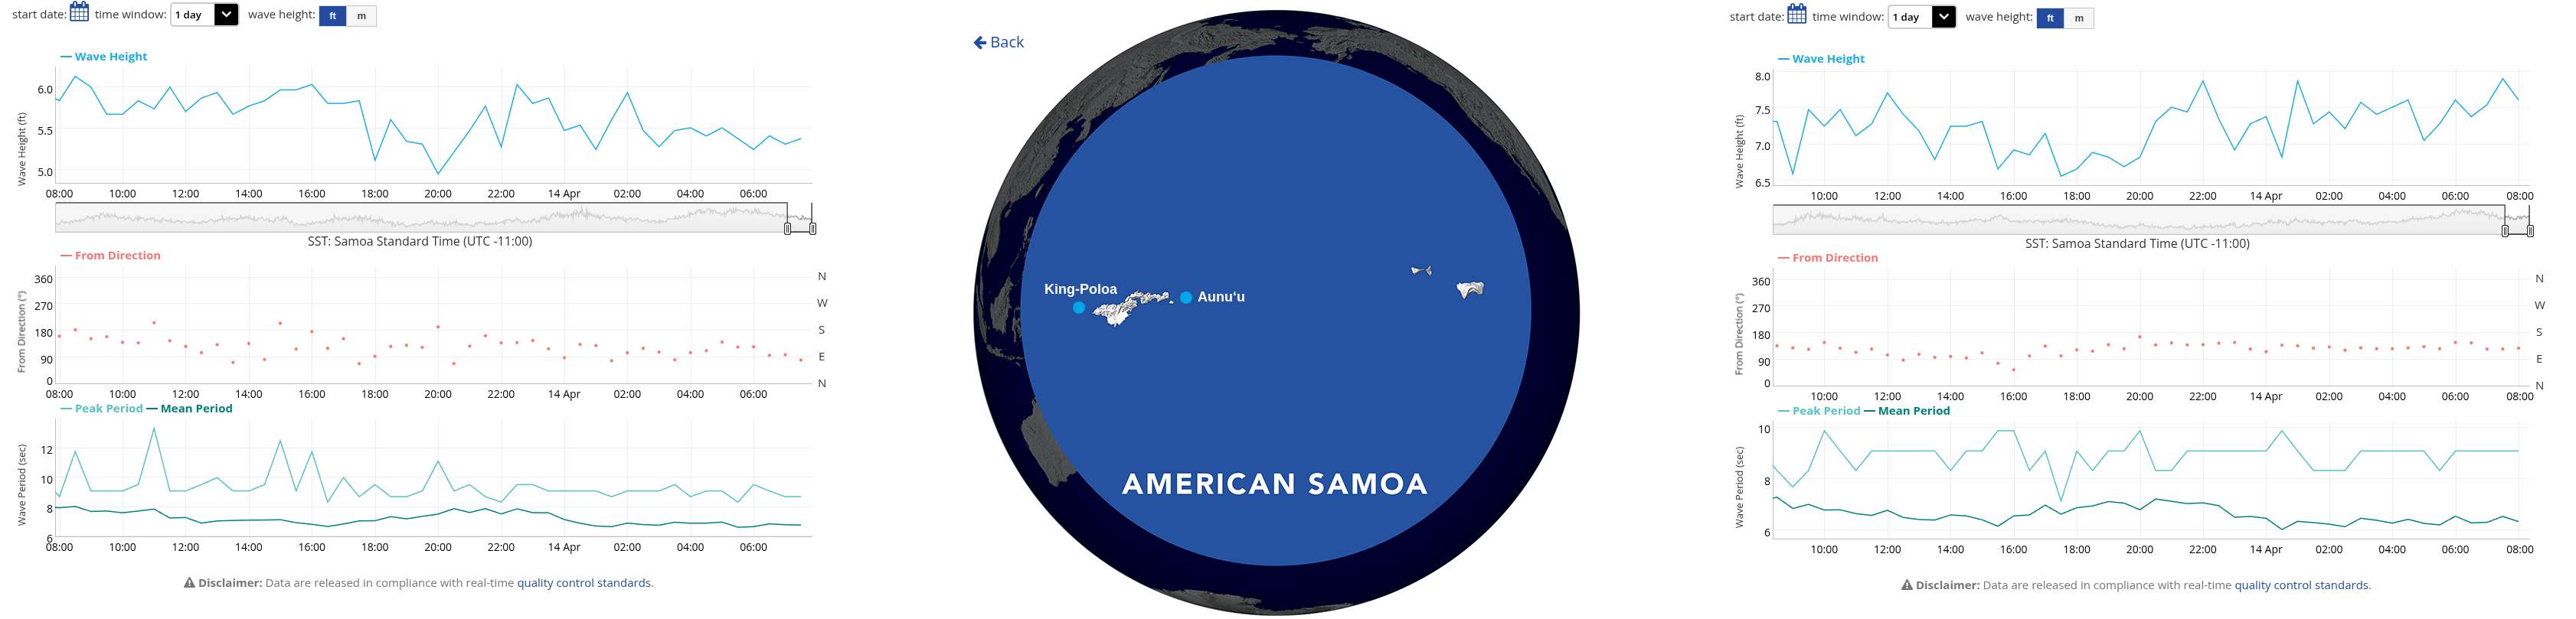
What can be used for winds and waves? Two PacIOOS buoys exist around American Samoa, and both are producing data. The plots below show that higher waves 7-7.5 feet, are at the Auunu buoy to the east. Waves are closer to 6 feet at King Poloa. At both locations, waves are approaching from the southeast, and the King Poloa site is somewhat in the lee of Tutuila. Altimetric wave heights are also available (link) — but at present the observations at that website are not up to date.
Wave observations at the King Poloa site (left) and Aunuu (right) on 14 April 2025 (Click to enlarge)
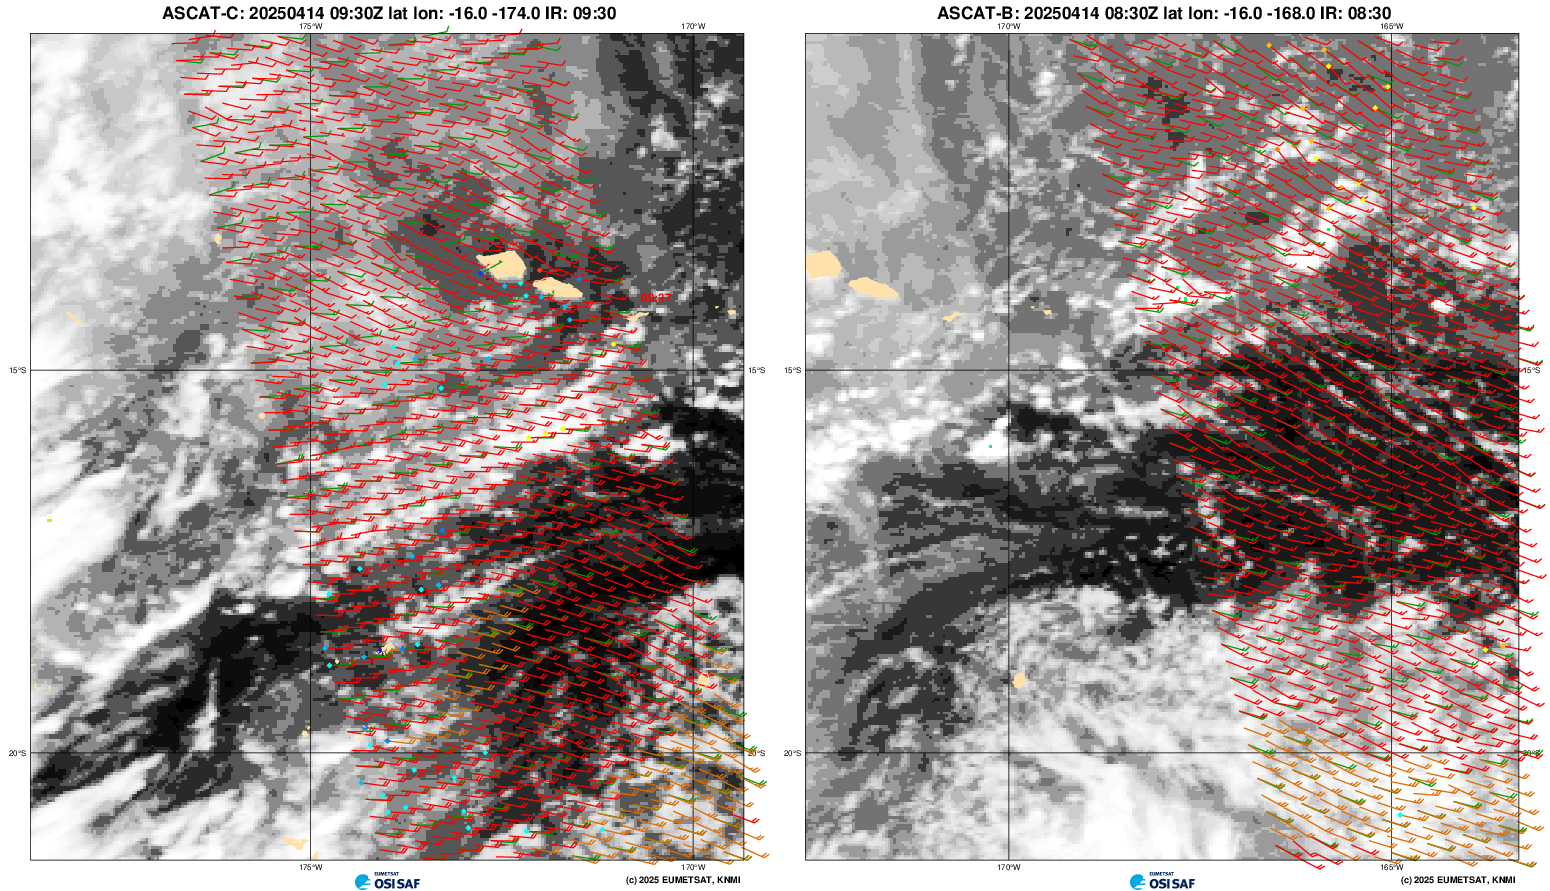
Scatterometry data gives sea-surface winds; strong winds near the Samoan Islands might build higher waves. Those data are available here, but as with the wave heights at that site, they are not up to date today. Scatterometry data are available at this osisaf website, however. ASCAT winds from MetopC (over the Samoan Islands) and from MetopB (to the east, i.e., upstream of the Samoan Islands) show values between 15 and 20 knots.
ASCAT winds from MetopC (left, 0930 UTC on 14 April 2025) and from MetopB (right, 0830 UTC on 14 April 2025) (Click to enlarge)
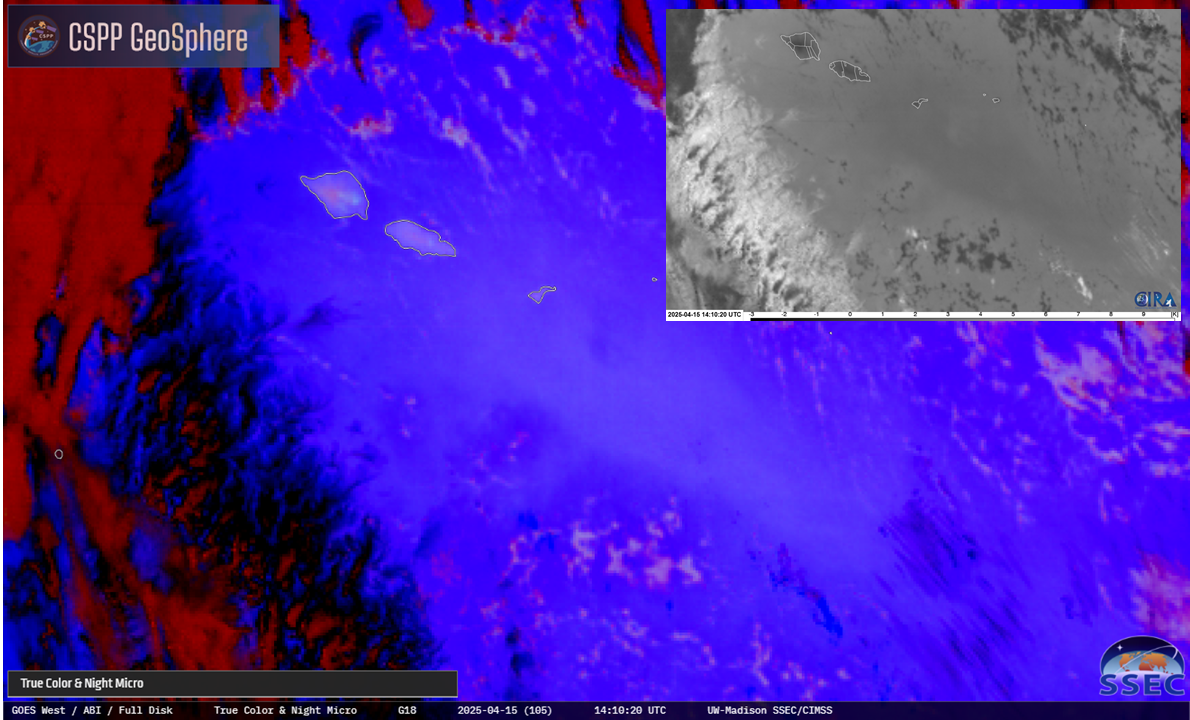
Update, 15 April 2025: Today I noticed a feature (at the CSPP Geosphere site) in the Night Microphysics RGB that was moving over American Samoa, i.e., that hazy lighter blue, highlighted here. What does this feature in the RGB represent?
Night Microphysics RGB, 1230-1420 UTC on 15 April 2925
To answer that, I first loaded up the Band 7 (shortwave IR, 3.9 µm) infrared imagery, and one noteworthy feature is the lack of cloud development in/around that feature. This suggests the RGB image is detecting a region of dry air; it might show up in the RGB because the Split Window Difference — that highlights moisture differences in the atmosphere — is part of the Night Microphysics RGB.
GOES-18 Shortwave Infrared (Band 7, 3.9 µm) imagery, 1410 UTC on 15 April 2025 (Click to enlarge)
The inset Split Window Difference field (source) has a darker smudge signifying dryer air in the same region as the lighter region in the RGB.
GOES-18 Night Microphysics RGB, 1410 UTC on 15 April 2025 with a Split Window Difference field inset in the upper right (Click to enlarge)
Of course, there are GOES-18 level 2 products that can help reveal the answer. The Total Precipitable Water field overlain on top of the Band 7 imagery, below, shows a distinct dry patch (TPW of less than 1.25″!) right where the feature in the RGB appears.
GOES-18 Shortwave Infrared (Band 7, 3.9 µm) imagery toggled with GOES-18 Total Precipitable Water, 1410 UTC on 15 April 2025 (Click to enlarge)
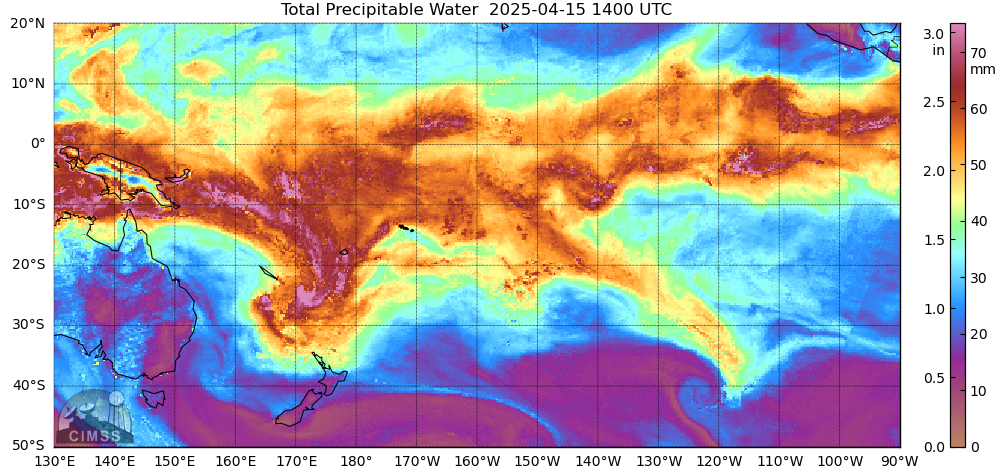
MIMIC Total Precipitable Water fields at about the same time (1400 UTC/15 April) show the dry patch as well.
MIMIC Total Precipitable Water, 1400 UTC on 15 April 2025 (click to enlarge)
Himawari-9 clean window (Band 13, 10.4 µm) infrared imagery, below, (created using geo2grid software and HSD files from the SSEC Data Center) shows strong convection developing in the Philippine Sea between the Philippines to the southwest, the Ryuku Islands to the west, Japan to the north, and Guam far to the east. The... Read More
Himawari-9 clean window (Band 13, 10.4 µm) infrared imagery, below, (created using geo2grid software and HSD files from the SSEC Data Center) shows strong convection developing in the Philippine Sea between the Philippines to the southwest, the Ryuku Islands to the west, Japan to the north, and Guam far to the east. The structure of the the convection in the infrared imagery at the start of the animation strongly suggests development along an outflow boundary that persists through much of the animation.
Himawari-9 Clean Window (Band 13, 10.4 µm) infrared imagery, 0600-2100 UTC on 10 April 2025 (Click to enlarge)
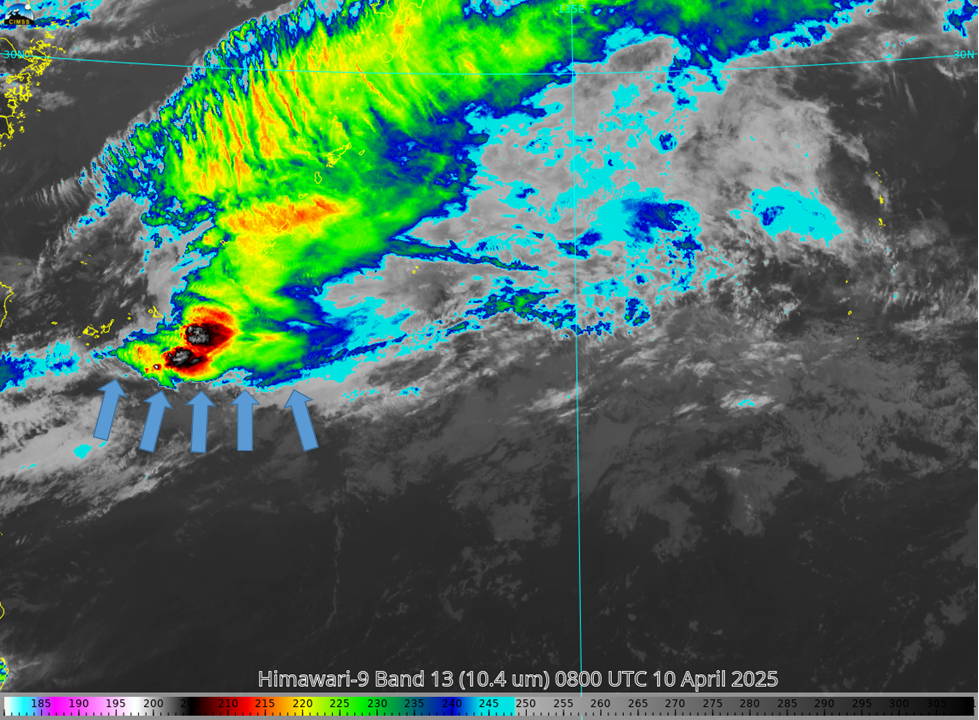
The toggle below shows where the outflow might exist at 0800 UTC.
Himawari-9 Clean Window (Band 13, 10.4 µm) infrared imagery, 0800 UTC on 10 April 2025; the blue arrows highlight the possible location of outflow (Click to enlarge)
This area of the western Pacific Ocean falls under the view of the Direct Broadcast antenna in the back yard of the National Weather Service on the island of Guam. What does the information downloaded from that antenna show? Three derived rain-rates from MetopC, NOAA-20 and NOAA-21 are shown below (imagery courtesy Douglas Schumacher, SSEC/CIMSS). The convection persisted for these five hours.
Rain Rates derived from Microwave sounders on MetopC (left, 1245 UTC), NOAA-20 (center, 1609 UTC) and NOAA-21 (right, 1703 UTC) on 10 April 2025 (Click to enlarge)
Day Night Band imagery from NOAA-21 shows that the strong convection was electrified. Lightning streaks are obvious in the Day Night band imagery.
NOAA-21 Day Night Band imagery (left) and Derived Rain Rate (right) at 1703 UTC on 10 April 2025 (Click to enlarge)
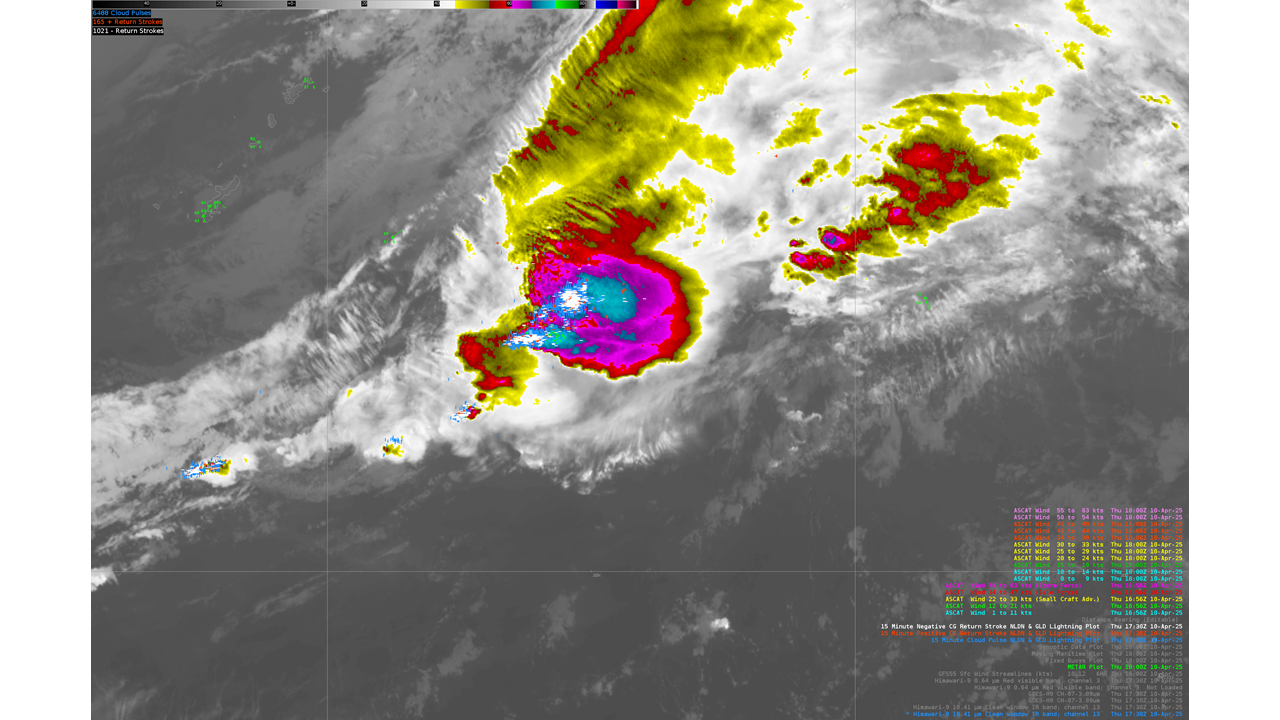
Ground-based lightning observations, below (Courtesy Brandon Aydlett, Science/Operations Officer in Guam), also show extensive lightning with this convective system.
Himawari-9 Clean window (Band 13, 10.4 µm) infrared imagery and ground-based lightning observations, 1730 UTC on 10 April 2025 (Click to enlarge)
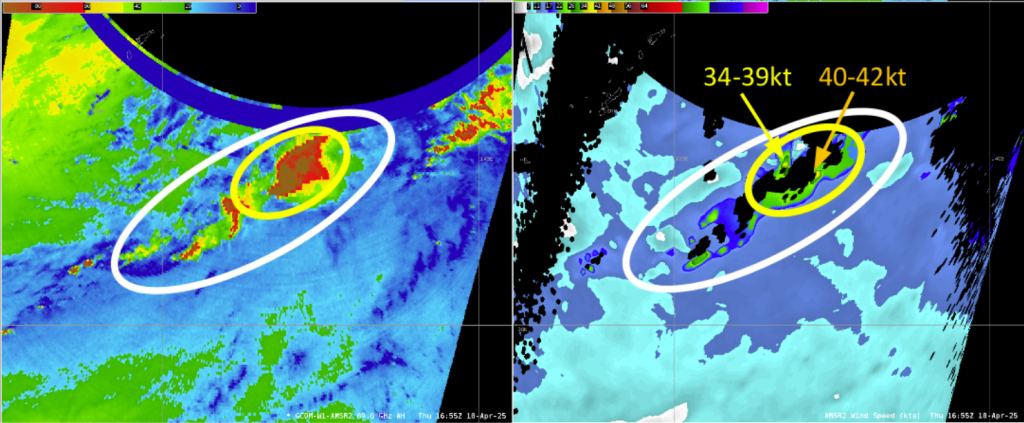
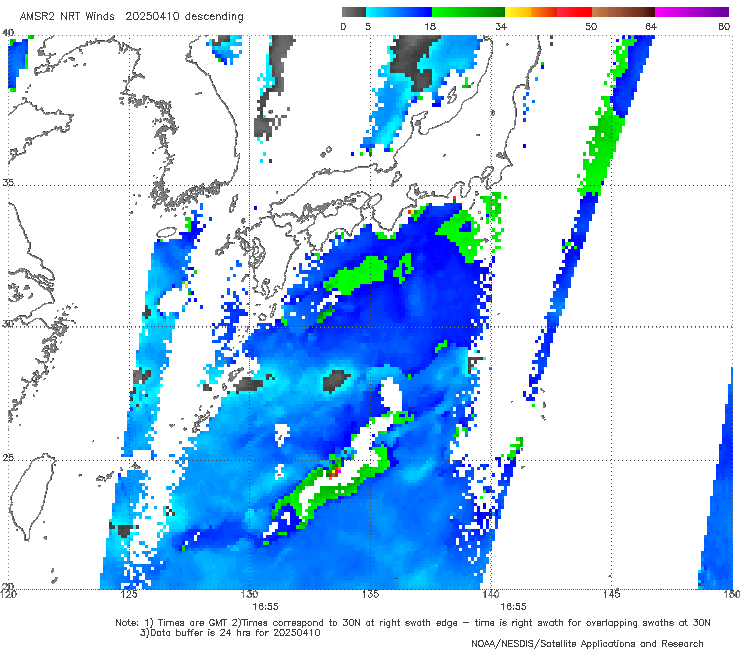
GCOM AMSR-2 imagery, below (also processed at the Direct Broadcast site on Guam, and ingested into the AWIPS machine, and also courtesy of Brandon Aydlett, WFO Guam), shows the strong microwave signal and the winds diagnosed to exceed 40 knots (and the region where wind diagnostics failed because of rain contamination). The wind speeds are also available at this NOAA/NESDIS site.
GCOM AMSR-2 89.5 GHz imagery (left) and derived Sea-Surface windspeeds (right), 1655 UTC on 10 April 2025 (Click to enlarge)
Himawari-9 Full Disk airmass RGB imagery (source) from late in the day on 10 April, below, shows that this convection was to the south of a developing cyclone moving into the northwest Pacific Ocean.
Himawari-9 Full-Disk Airmass RGB imagery, 1800-2300 UTC on 10 April 2025 (Click to enlarge)
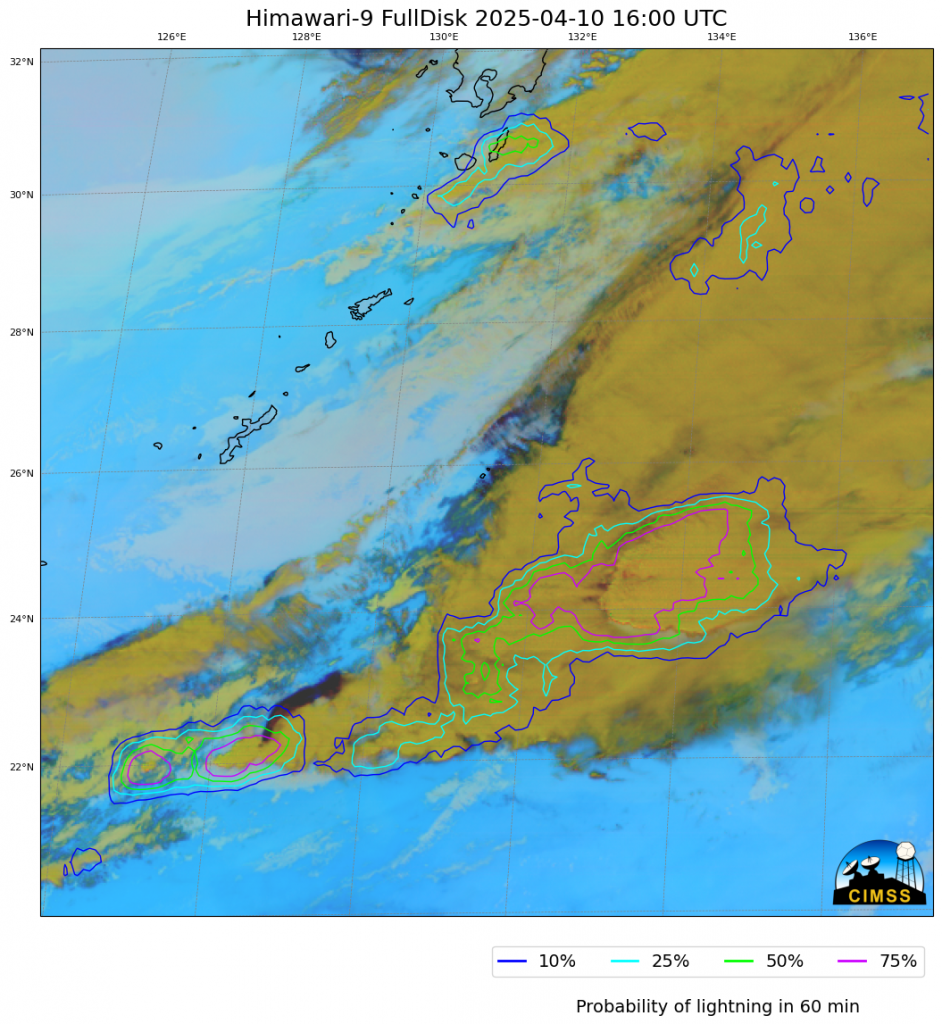
Given all the lightning observed at 1700-1730 UTC, a natural question might be: what did LightningCast probabilities (computed with Himawari-9 data and CSPP Geo LightningCast software) show an hour earlier? Very large probabilities centered near 25oN, 134oE! A LightningCast animation (here) from 0000 to 2000 UTC on 10 April shows large value moving eastward through the domain below.
Thanks to Brandon Aydlett, WFO Guam, for kick-starting this blog post!


