Forecasting for Flag Day Activities on American Samoa
Thursday 17 April is the 125th anniversary of the beginning of American Sovereignty over American Samoa. Part of the celebration includes the Fautasi, a regatta that depends on weather. What tools are available to help forecast in the long-term and in the short-term? The animation above (from the CSPP Geosphere site) shows the Night Microphysics RGB during the early morning of 14 April, and periodic convection is occurring. The low clouds — white and pink against the blue background — are occasionally spawning deeper convection that is a deep red in the RGB. These convective towers are short-lived. This kind of information might be useful in the short-term for diagnosing where precipitation is occurring the night before the regatta.
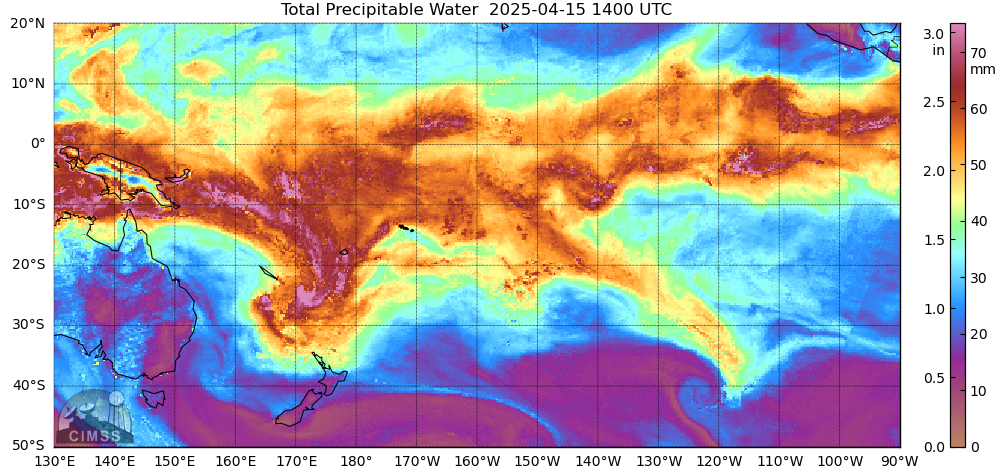
MIMIC Total Precipitable Water fields, above, show the Samoan Islands along the southern edge of deeper moisture that is the South Pacific Convergence Zone between the islands and the Equator. Animations such as these can help a forecaster anticipate the approach (or retreat) of deep moisture that could support heavy rains.
The GOES-18 Clear-Air estimates of Total Precipitable Water, below, similarly show a gradient just south of the Samoan Islands, with values dropping from over 2″ over American Samoa (the purple enhancement) to about 1.5″ to the south (the yellow enhancement).
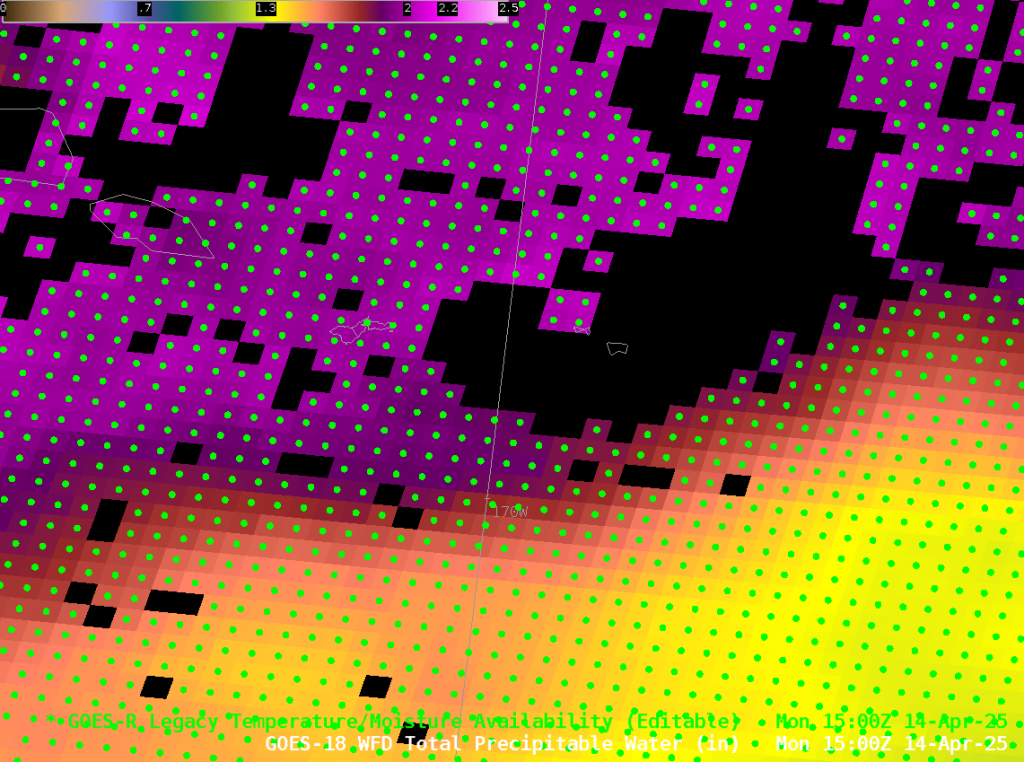
The green points above show where Legacy Profiles exist, and the animation below highlights the profile very close to Pago Pago in the center of Tutuila. The low-level stability in the sounding and mid-level dry air are consistent with the occasional convective development (and quick dissipation) observed in the Night Microphysics imagery above.
LightningCast probabilities (available at this site) can be used in the short term for Decision Support for outdoor activities. The animation below shows probability fields for the overnight hours, 1200-1500 UTC on 14 April 2025, matching the animations above. Probabilities with these showers to not become large, and GLM lightning observations are not present.
GREMLIN fields (1000-1500 UTC) that estimate radar returns are shown below (from here). Hit-or-miss showers are diagnosed.

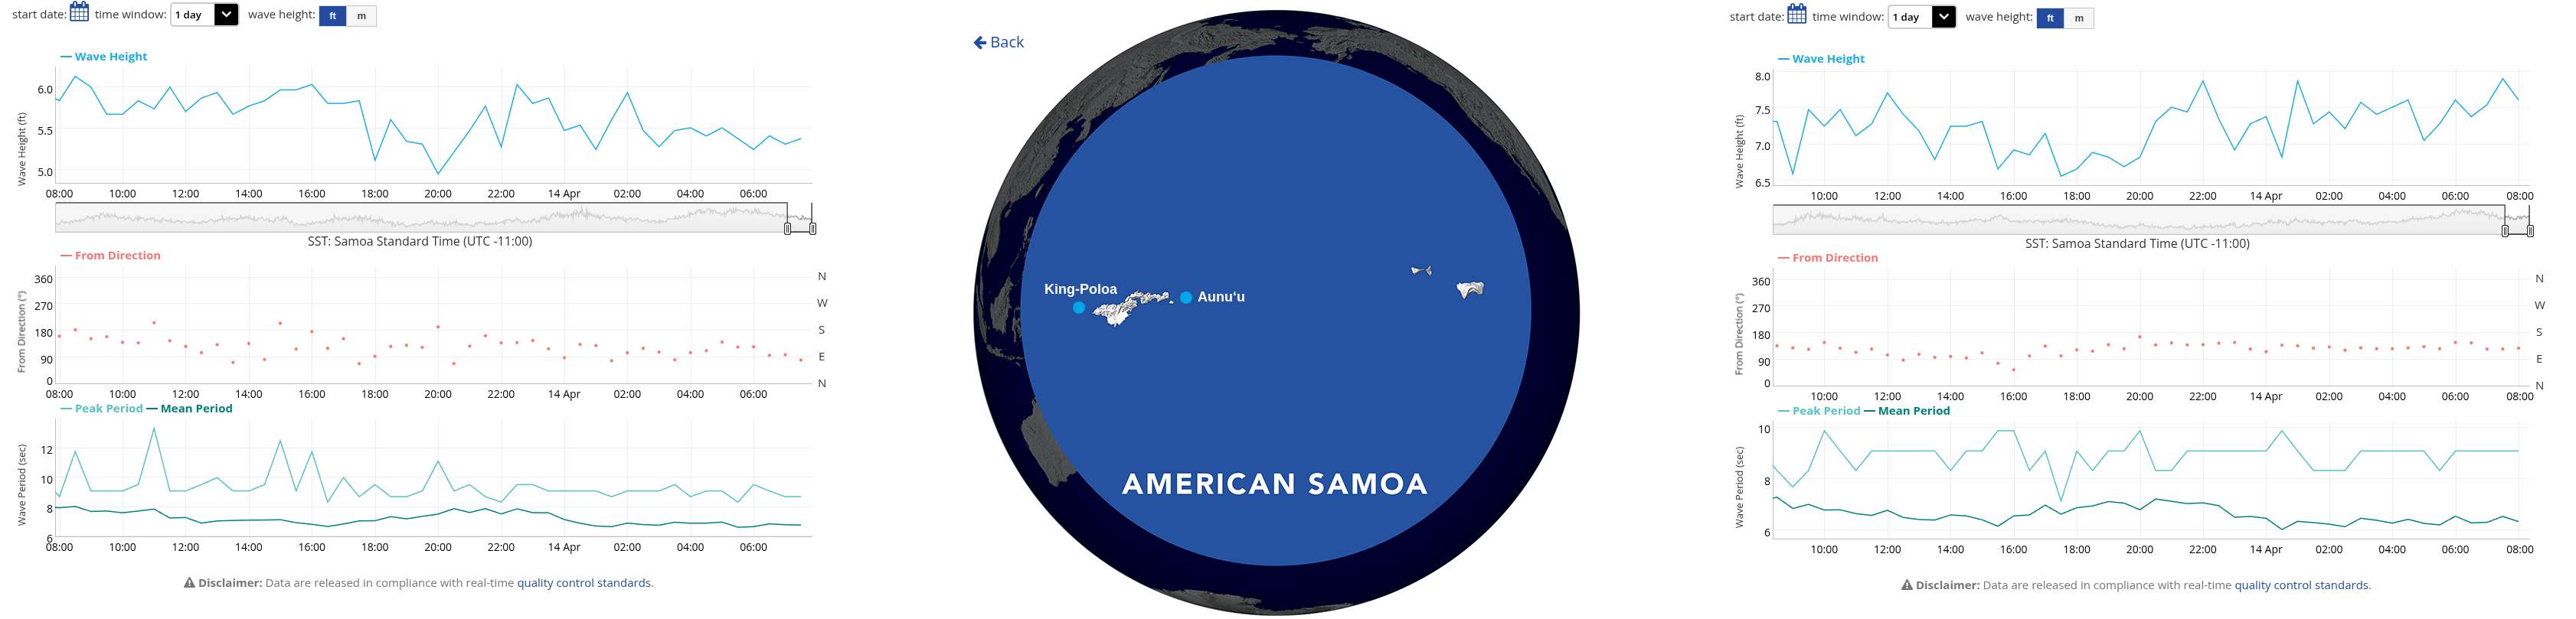
What can be used for winds and waves? Two PacIOOS buoys exist around American Samoa, and both are producing data. The plots below show that higher waves 7-7.5 feet, are at the Auunu buoy to the east. Waves are closer to 6 feet at King Poloa. At both locations, waves are approaching from the southeast, and the King Poloa site is somewhat in the lee of Tutuila. Altimetric wave heights are also available (link) — but at present the observations at that website are not up to date.
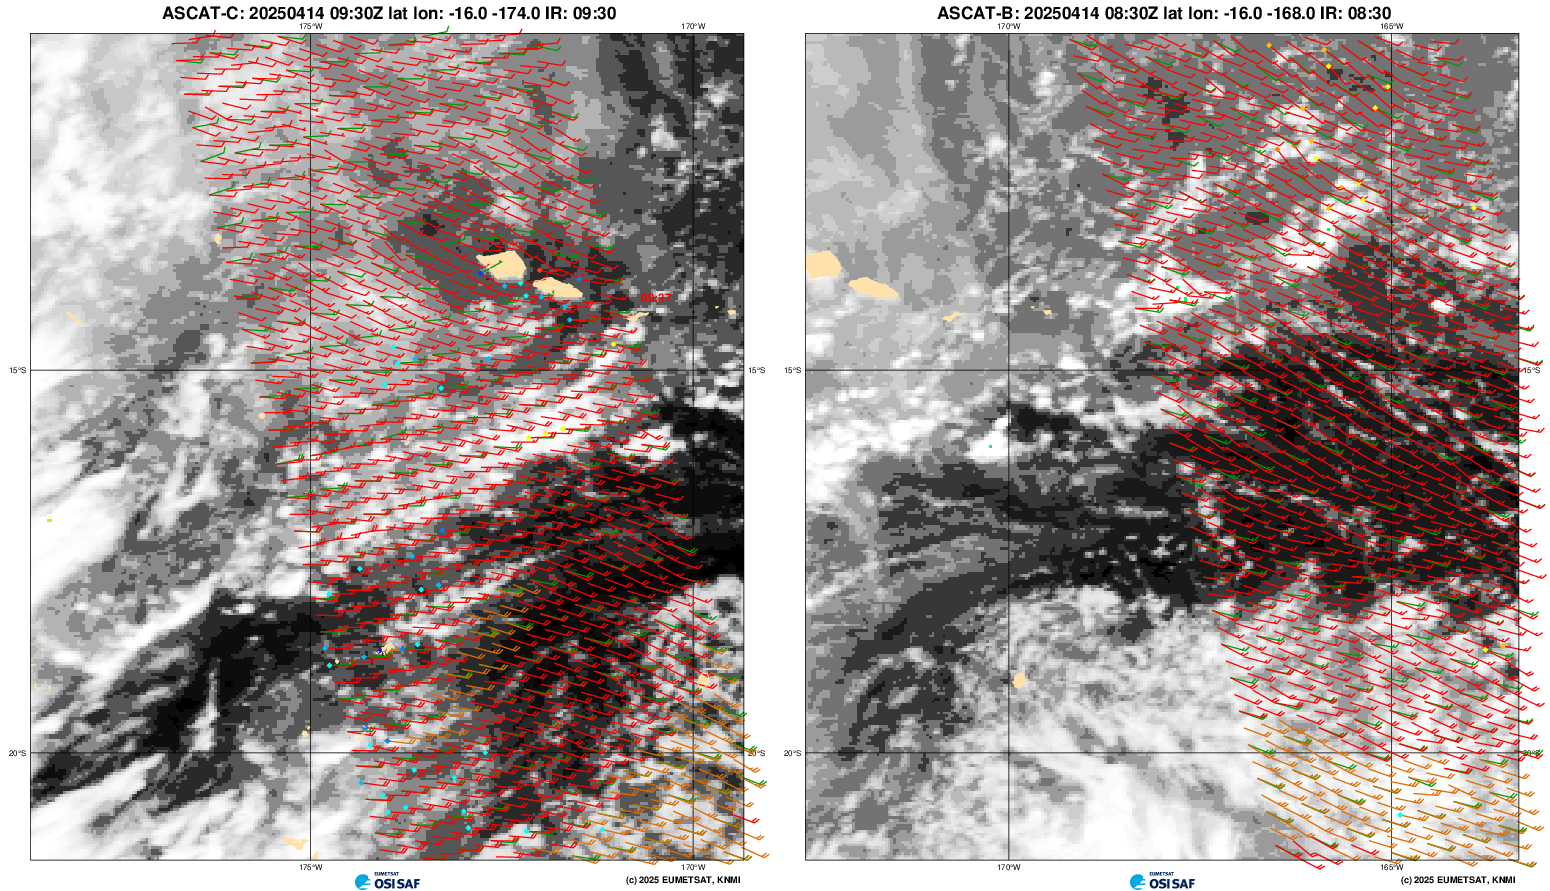
Scatterometry data gives sea-surface winds; strong winds near the Samoan Islands might build higher waves. Those data are available here, but as with the wave heights at that site, they are not up to date today. Scatterometry data are available at this osisaf website, however. ASCAT winds from MetopC (over the Samoan Islands) and from MetopB (to the east, i.e., upstream of the Samoan Islands) show values between 15 and 20 knots.
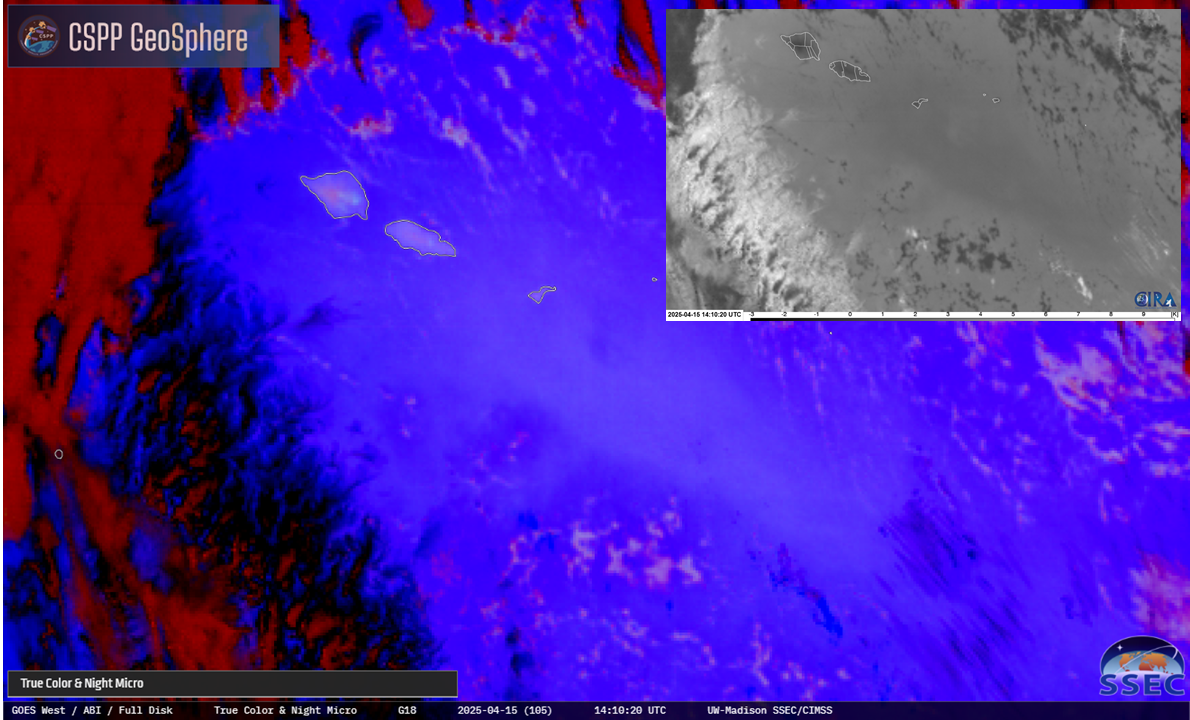
Update, 15 April 2025: Today I noticed a feature (at the CSPP Geosphere site) in the Night Microphysics RGB that was moving over American Samoa, i.e., that hazy lighter blue, highlighted here. What does this feature in the RGB represent?
To answer that, I first loaded up the Band 7 (shortwave IR, 3.9 µm) infrared imagery, and one noteworthy feature is the lack of cloud development in/around that feature. This suggests the RGB image is detecting a region of dry air; it might show up in the RGB because the Split Window Difference — that highlights moisture differences in the atmosphere — is part of the Night Microphysics RGB.

The inset Split Window Difference field (source) has a darker smudge signifying dryer air in the same region as the lighter region in the RGB.
Of course, there are GOES-18 level 2 products that can help reveal the answer. The Total Precipitable Water field overlain on top of the Band 7 imagery, below, shows a distinct dry patch (TPW of less than 1.25″!) right where the feature in the RGB appears.
MIMIC Total Precipitable Water fields at about the same time (1400 UTC/15 April) show the dry patch as well.
For more information on the weather around Pago Pago, refer to the National Weather Service website and/or the Facebook page of the Pago Pago office.