")
Hourly GOES-13 Visible Imagery (click image to play animation)
Carlotta is the third named system, and second Hurricane, of the young eastern Pacific Tropical Season. Hourly imagery from GOES-East shows the increase in organization in the storm as it approaches the coast of Mexico on the morning of June 15 2012. AMSU imagery from Channel 7 at 11UTC on 15 June shows the characteristic warm core usually found in tropical cyclones.
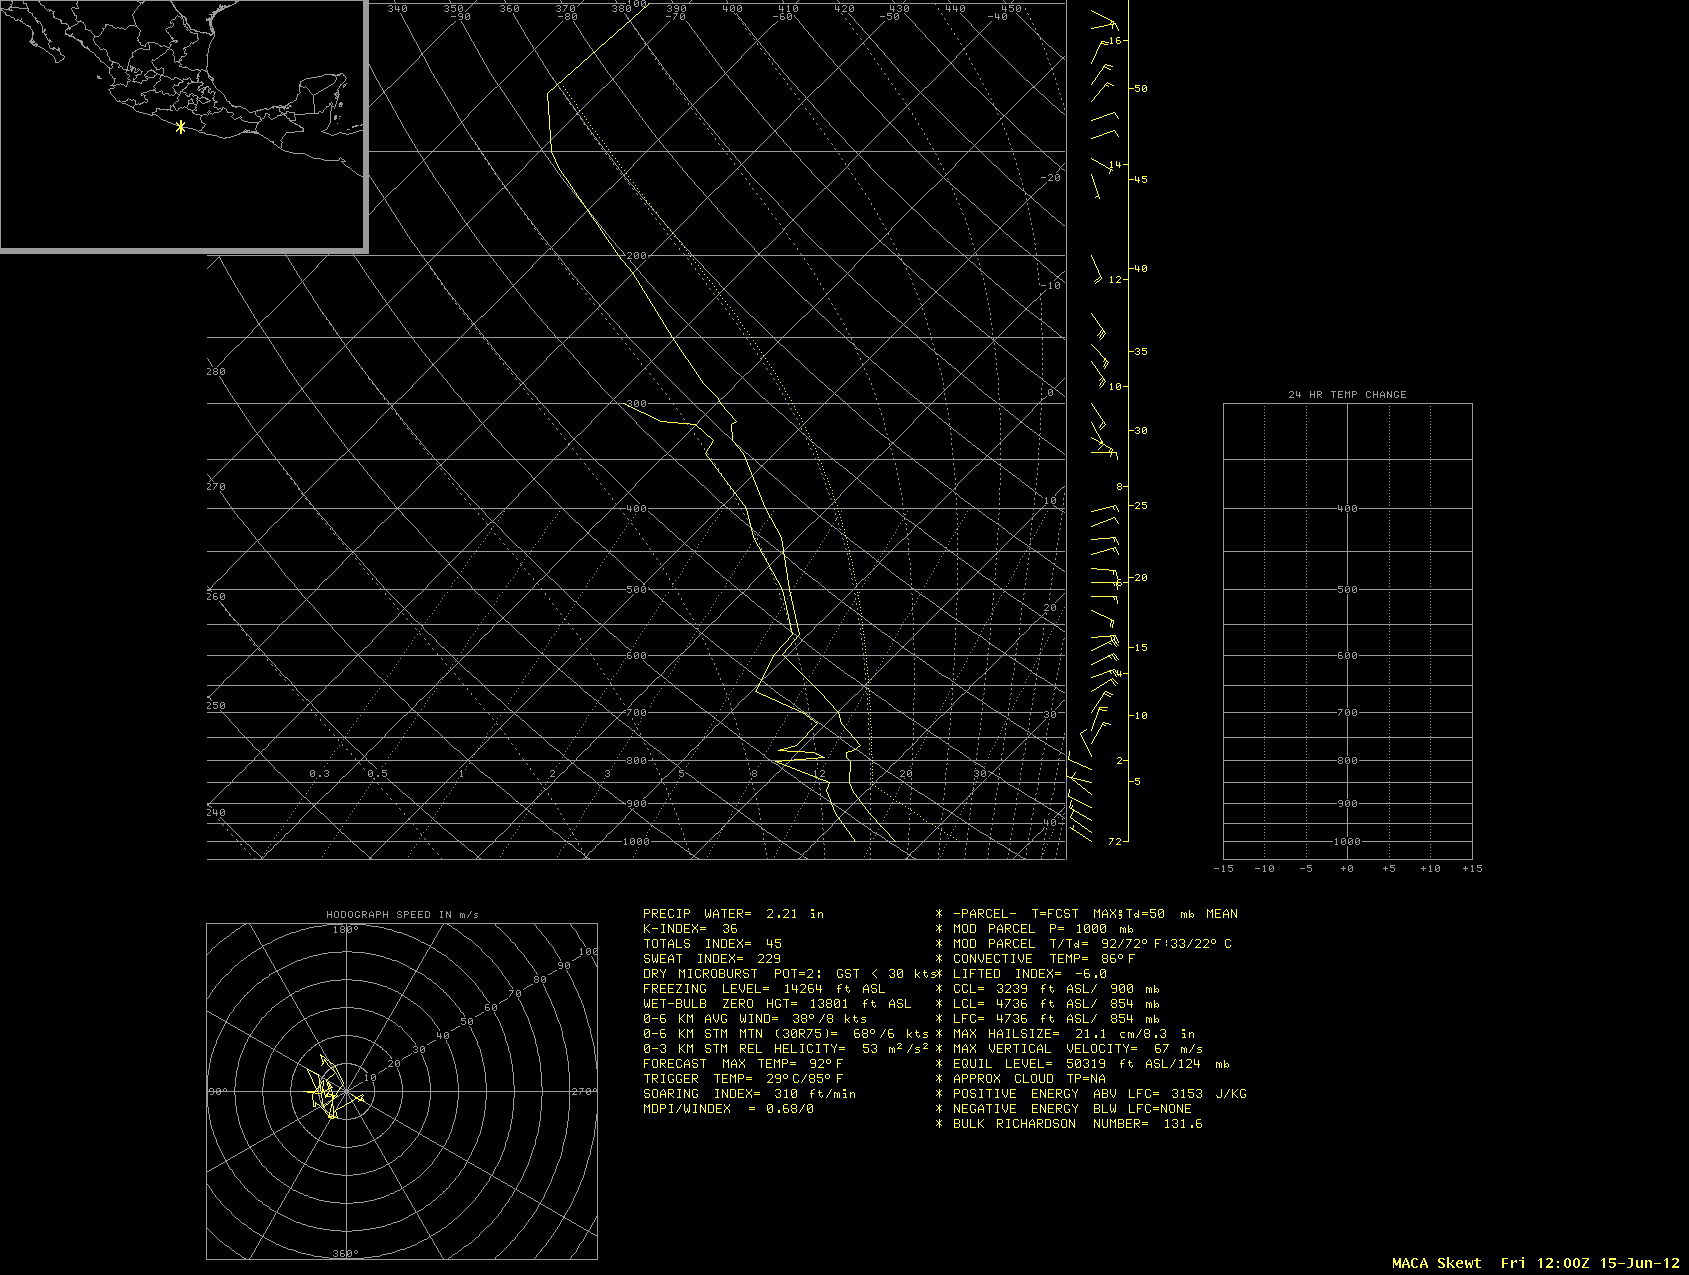
During a period of rapid intensification in the morning, GOES-13 10.7 µm IR channel images (below; click image to play animation) exhibited unusually cold cloud top IR brightness temperature values (as cold as -85 C at 15:45 UTC). This IR temperature was quite a bit colder than the tropical tropopause as indicated on the Acapulco, Mexico rawinsonde data, suggesting a significant degree of overshooting.
")
GOES-13 10.7 µm IR channel images (click image to play animation)
Data from the Cooperative Institute for Meteorological Satellite Studies’ (CIMSS) Tropical Cyclones site show that Carlotta is in a region that favors intensification. Sea-Surface Temperatures are very warm and shear is (although not weak) modest. Warm surface SSTs do not extend to great depth this early in the season (as shown in this map of Oceanic Heat Content); Carlotta’s forward motion should inhibit any weakening that might arise due to mixing of cooler sub-surface waters, however.

GOES-15/GOES-13 composite of Water Vapor images
Carlotta is embedded within a very moist airmass. GOES water vapor imagery from 1500 UTC on 15 June (above), shows very little dryness near the storm. A MIMIC animation of Total Precipitable Water (TPW), below, shows the rich values of TPW surrounding the storm. As this airmass interacts with the high terrain of central coastal Mexico, life-threatening heavy rains are likely. Note how moisture-rich air associated with the hurricane is approaching the coast of Mexico from the east-southeast as moisture-rich air farther offshore is approaching from the west-southwest.
")
MIMIC Total Precipitable Water Imagery (click image to play animation)

Morphed Observations of Microwave Imagery
Morphed microwave imagery shows the quick organization of Carlotta for the 24 hours ending mid-day on June 15th. A nearly complete eyewall has developed during this time.
View only this post Read Less

")


")
