Tornadoes touched down on Long Island within the confines of New York City on September 8th, 2012. This image shows the terminal radar velocities from Newark associated with the two touch downs. This google map link shows both Canarsie and Breezy Point on a map of eastern Long Island.The GOES-15 image above, from... Read More

GOES-15 0.62 µm Visible Imagery at time of Tornado
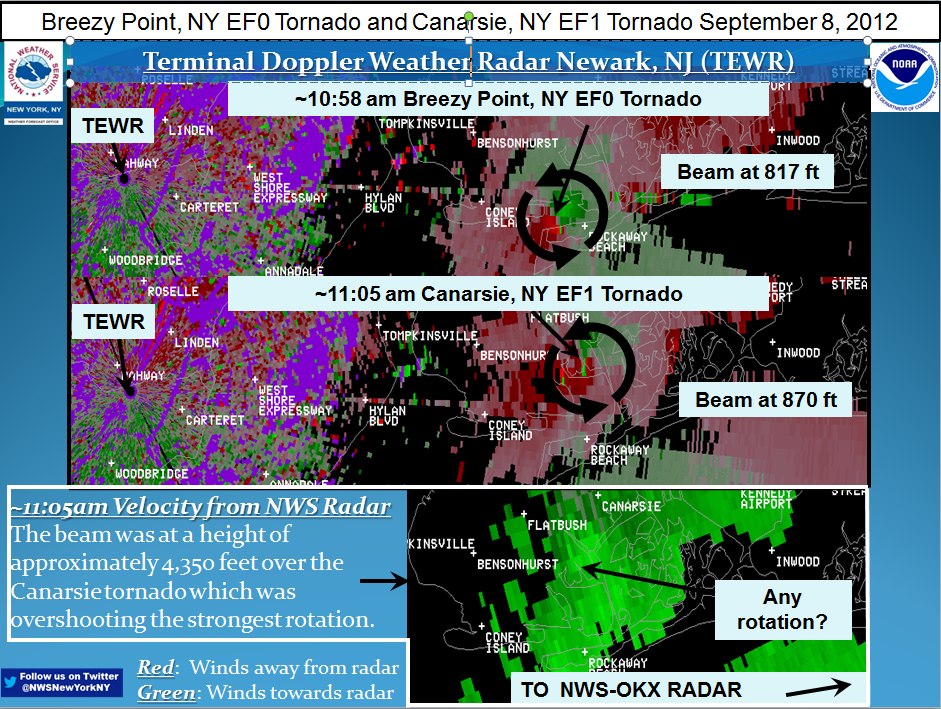
Tornadoes touched down on Long Island within the confines of New York City on September 8th, 2012. This image shows the terminal radar velocities from Newark associated with the two touch downs. This google map link shows both Canarsie and Breezy Point on a map of eastern Long Island.
The GOES-15 image above, from 1500 UTC, (Here is the same image without a map drawn on it) is for the approximate time of the tornadic touch down in Canarsie — GOES-15 was scanning across Long Island at 1504 UTC. The oblique view allows the satellite to see under the anvil of a glaciated storm over central Long Island, and to view a storm of modest appearances over eastern Long Island that produced the tornado. This tornadic cell is part of a convergence line that stretches southward down the coast of New Jersey. Stretching of local convergence by a strong updraft can cause brief tornadic events.
")
GOES-13 0.63 µm visible and 10.7 µm IR images (click image to play animation)
GOES-13 (GOES-East) also viewed this cell. Unfortunately, the touch-down occurred when GOES-13 was performing a routinely scheduled full-disk image, so imagery at 1445 UTC and 1515 UTC is available, and at 1545 UTC (housekeeping on GOES-13 is performed for 10 minutes starting at 1534 UTC). The routine schedule for GOES-13 is here. Nevertheless, the animation of the Visible and IR imagery shows the development of the tornadic cell along the convergence line. The 30-minute timestep between images, however, makes computation of convective predictors such as Cloud-top Cooling ineffective. The tornadoes were on the ground in between the 1445 UTC and 1515 UTC GOES-East images. Note that Canarsie is indicated by the red square in the infrared imagery.
")
GOES-14 0.63 µm visible and 10.7 µm IR images (click image to play animation)
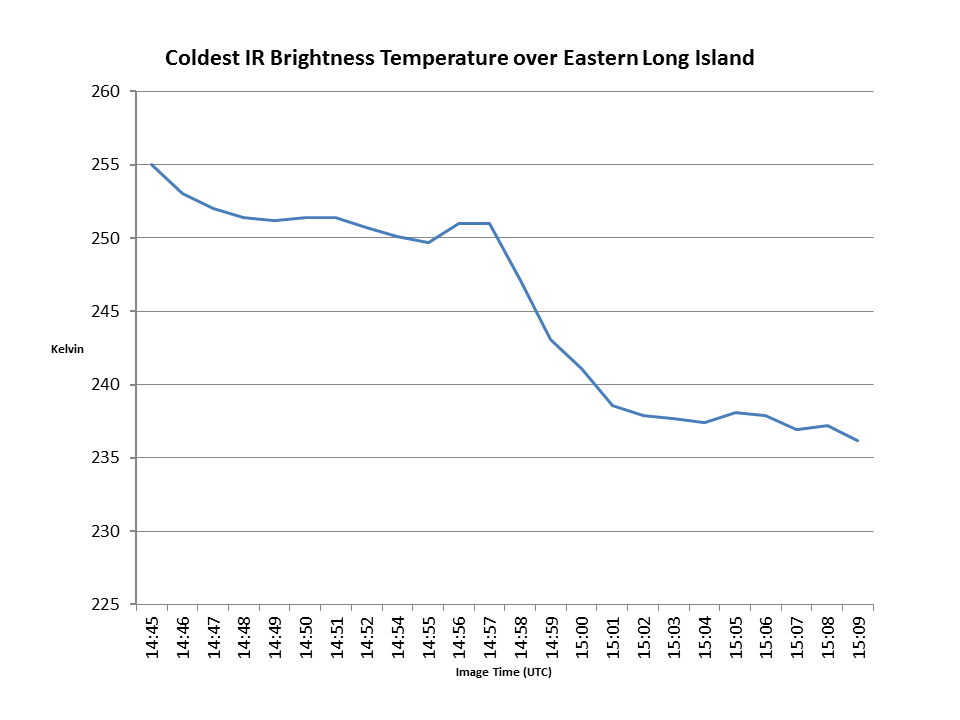
GOES-14 was in SRSOR on September 8th, and its every-minute imagery captured the evolution of the tornadic cell very well. The animation above plays steps more slowly for the times when the tornado is on the ground. The animation reinforces the notion that the tornadic cell in the visible imagery is prosaic. The 1-minute imagery allows careful scrutiny of the cloud-top temperature as the cells evolve. The loop below, from 1445 UTC to 1509 UTC, spans the time of tornadic activity, and the initial cloud-top cooling and subsequent anvil spreading is readily apparent. This graph shows the coldest IR Brightness temperature over the developing/evolving tornadic cell as a function of time. It’s uncertain from the imagery alone whether the cloud-top cooling is occurring because the top of the cloud is reaching higher into the atmosphere, or because thickening clouds at lower levels are limiting the amount of radiation upwelling through the cloud. There is certainly a cooling trend, however, at the time of the tornadoes.
")
Magnified GOES-14 10.7µm IR images (click image to play animation)
(Added: Click here for a QuickTime movie of the visible imagery on September 8th from 1415 UTC to 1859 UTC. Click here to see an animated gif loop that compares the temporal coverage of GOES-13 — present GOES — to that of GOES-14 — simulating GOES-R)
View only this post
Read Less


 product")


")
")
")


