This website works best with a newer web browser such as Chrome, Firefox, Safari or Microsoft Edge. Internet Explorer is not supported by this website.

Mount Pavlof erupts in the Aleutians

Pavlof Volcano (located at about 55.5 N, 162 W) in the Aleutian Islands had been experiencing a series of small eruptions that were captured by the constellation of polar-orbiting satellites that pass over the region. For example, a MODIS 11.0 µm IR Window channel... Read More

MODIS 11.0 µm IR Window channel brightness temperature

MODIS 11.0 µm IR Window channel brightness temperature

Pavlof Volcano (located at about 55.5 N, 162 W) in the Aleutian Islands had been experiencing a series of small eruptions that were captured by the constellation of polar-orbiting satellites that pass over the region. For example, a MODIS 11.0 µm IR Window channel image from 08:07 UTC on 16 May (above) showed a dark (warm) pixel over the volcano. That 0º C pixel was surrounded by values closer to -15º C.

Suomi NPP VIIRS 0.7 µm Day/Night Band and 3.74 µm shortwave IR images

Suomi NPP VIIRS 0.7 µm Day/Night Band and 3.74 µm shortwave IR images

A comparison of Suomi NPP VIIRS 0.7 µm Day/Night Band (DNB) and 3.74 µm shortwave IR images at 12:12 UTC on 16 May 2013 (above) showed the bright glow of the volcano on the DNB, centered over a warm thermal anomaly of 47.5º C (orange color enhancement) on the shortwave IR. These were both signatures of hot lava flows from the summit and down along the northwest flank of Pavlof.

Volcanic plume characteristics derived from Aqua MODIS at 13:50 UTC

Volcanic plume characteristics derived from Aqua MODIS at 13:50 UTC

The high spectral resolution of MODIS — 36 different channels in the visible and infrared — on board the Terra and Aqua satellites allows for creation of products that quantitatively describe the volcanic ash cloud, beyond just locating the hot spot of the volcano itself. False color imagery, shown above (top left panel, derived from the brightness temperature differences indicated in the figure) from Aqua MODIS at 13:50 UTC, nicely outlines the volcanic ash plume in shades of red. The other three figure panels show the Ash Cloud Height (very important information for aviation concerns), the Ash Cloud Particle Size (which is related to how long it will take to settle out — small particles stay in the atmosphere for a longer time) and Ash Cloud Loading (what is the mass of volcanic ash in the column?).

A later 4-panel suite of products derived from MODIS data on Terra, at 21:31 UTC, is shown below. In addition to the high spectral resolution on MODIS, the polar orbiter satellites have good horizontal resolution over Alaska as well.

Volcanic plume characteristics derived from Terra MODIS at 21:31 UTC

Volcanic plume characteristics derived from Terra MODIS at 21:31 UTC

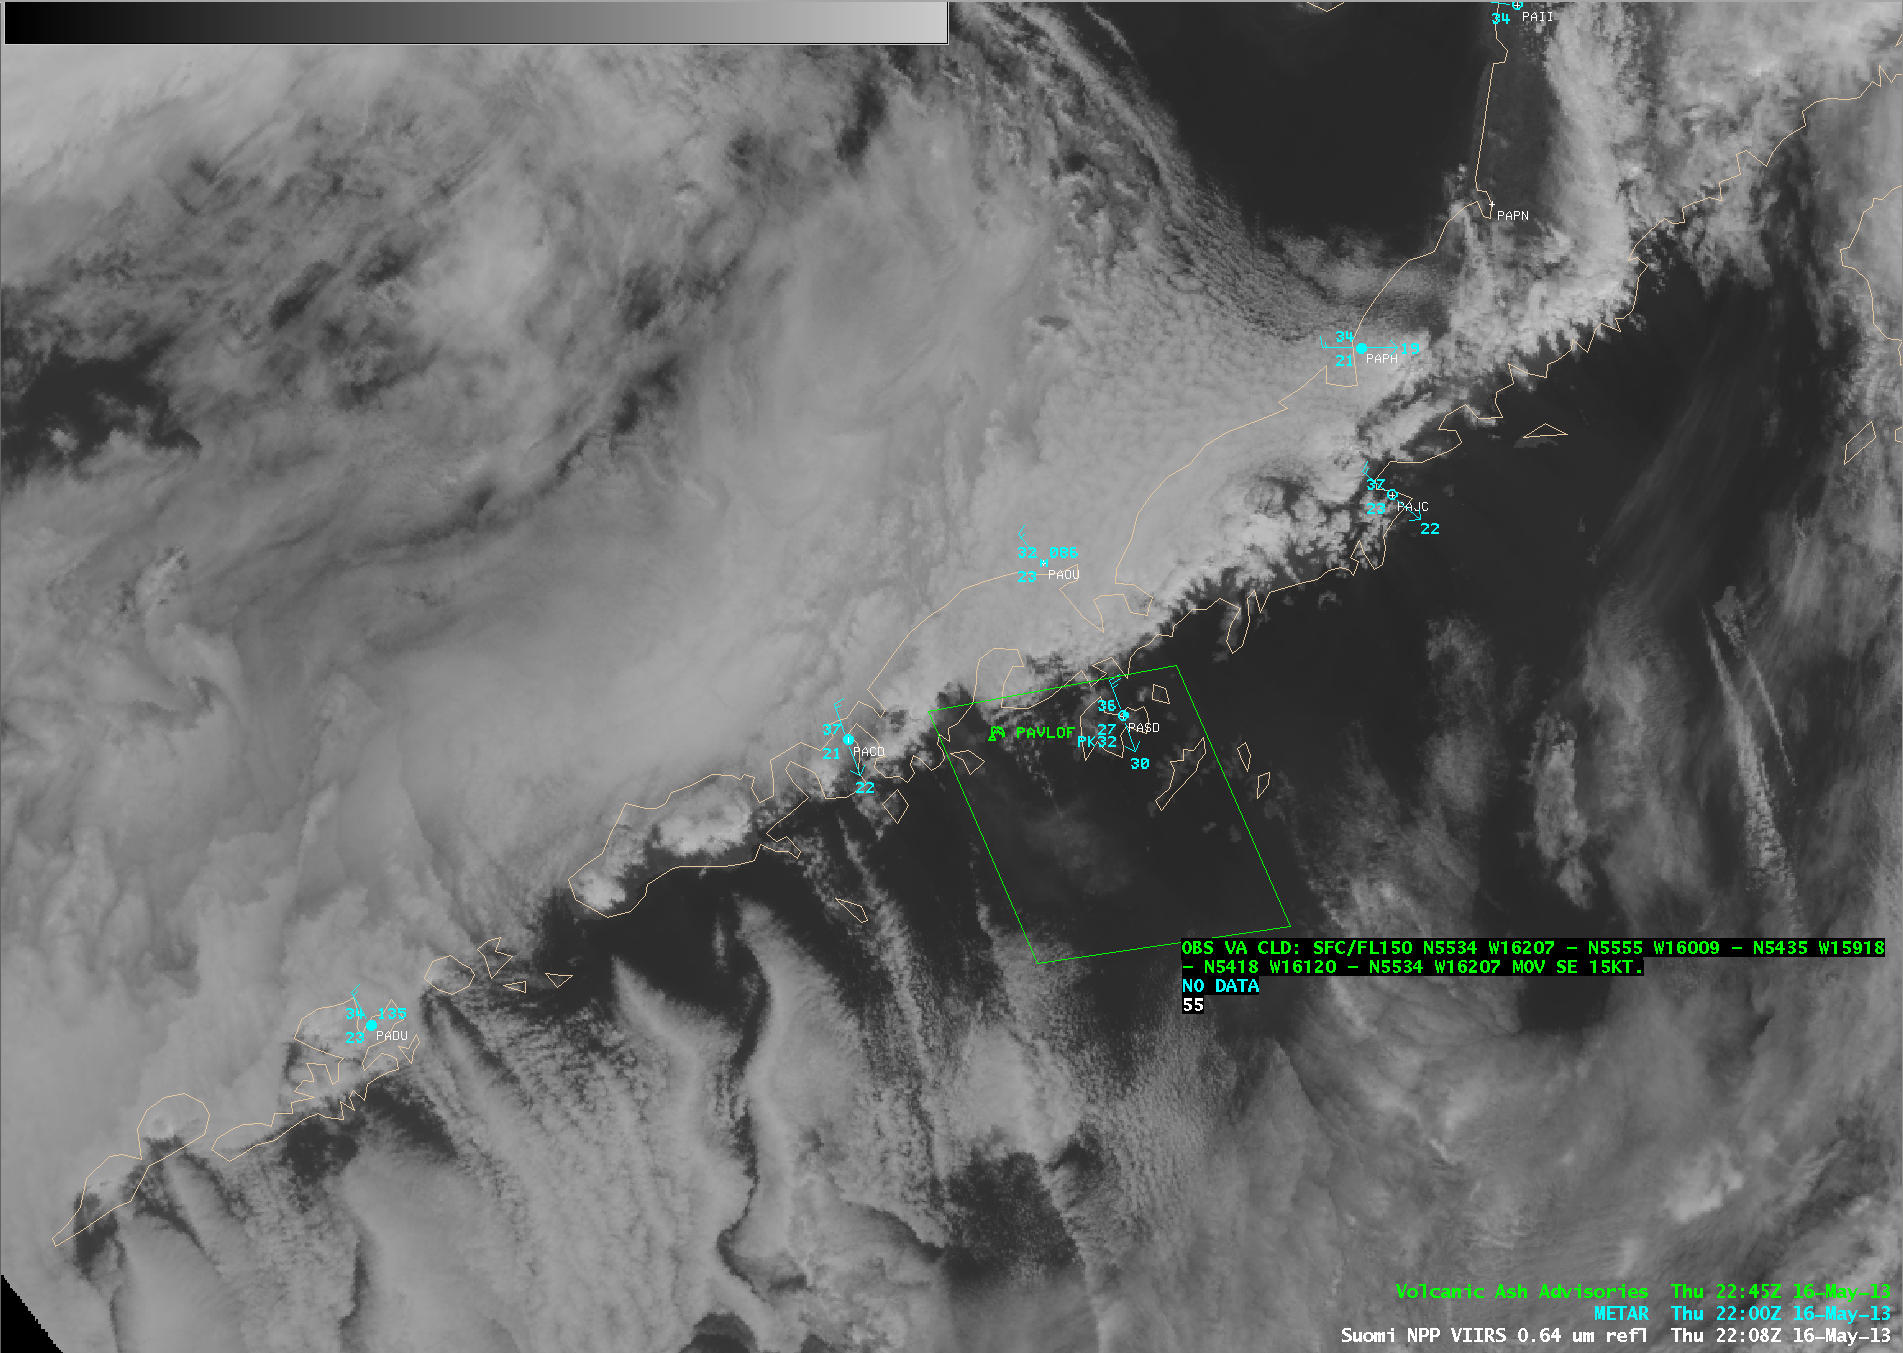
A comparison of Suomi NPP VIIRS 0.64 µm visible channel and 3.74 µm shortwave IR channel images at 22:08 UTC (below) showed the hazy signature of the volcanic plume on the visible image, as well as a warm thermal anomaly exhibiting a brightness temperature of 40º C (yellow color enhancement) on the shortwave IR image. A Volcanic Ash Advisory had been issued for altitudes between the surface and 15,000 feet, as the volcanic plume drifted southeastward at 15 knots.

Suomi NPP VIIRS 0.64 µm visible channel and 3.74 µm shortwave IR channel images

Suomi NPP VIIRS 0.64 µm visible channel and 3.74 µm shortwave IR channel images

GOES imaging of this eruption suffers because of limited channels (5) on the GOES Imager, and because of degraded spatial resolution at the high latitudes (as result of the very large satellite viewing angle). However, the hazy signature of the volcanic plume could still be seen drifting southeastward from Pavlof on GOES-15 0.63 µm visible channel images (below; click image to play animation). The location of the Pavlof volcano is denoted by the “P” on the images. Also of interest in the animation is the motion of sea ice in the Bering Sea north of the Aleutians, which could be seen once a break in the clouds moved over that area.

GOES-15 0.63 µm visible channel images (click image to play animation)

GOES-15 0.63 µm visible channel images (click image to play animation)

View only this post Read Less

Tornado outbreak in the Dallas/Ft. Worth area in north Texas

An outbreak of tornadoes across the Dallas/Ft. Worth area in north Texas on 15 May 2013 produced up to 16 tornadoes (NWS summary) which were responsible for 6 fatalities. Hail as large as 4.0 inches in diameter and... Read More

GOES-15 (left) and GOES-13 (right) 0.63 µm visible channel images (click image to play animation)

GOES-15 (left) and GOES-13 (right) 0.63 µm visible channel images (click image to play animation)

An outbreak of tornadoes across the Dallas/Ft. Worth area in north Texas on 15 May 2013 produced up to 16 tornadoes (NWS summary) which were responsible for 6 fatalities. Hail as large as 4.0 inches in diameter and a wind gust as high as 80 mph also accompanied these severe thunderstorms (SPC storm reports). A McIDAS image comparison of GOES-15 (GOES-West) and GOES-13 (GOES-East) 0.63 µm visible channel data (above; click image to play animation)  showed the rapid development of convection across the north Texas region, with the storms exhibiting a number of overshooting tops. The locations of Granbury (G) and Cleburne (C) were noted on the images, where EF-4 and EF-3 tornado damage occurred.

A similar comparison of GOES-15 (GOES-West) and GOES-13 (GOES-East) 10.7 µm IR channel images (below; click image to play animation) showed the cold cloud top IR brightness temperatures associated with these storms, which were as cold as -63 C (darker red color enhancement) in the vicinity of Granbury and Cleburne around the time of the tornadoes.

GOES-15 (left) and GOES-13 (right) 10.7 µm IR channel images (click image to play animation)

GOES-15 (left) and GOES-13 (right) 10.7 µm IR channel images (click image to play animation)


GOES-13 sounder Lifted Index derived product images (click image to play animation)

GOES-13 sounder Lifted Index derived product images (click image to play animation)

These storms developed along an axis of instability and moisture that was located to the east of a dryline that was bulging eastward across north Texas — the GOES-13 sounder Lifted Index (LI) derived product images (above; click image to play animation) revealed LI values as low as -12.4 C (dark purple color enhancement) at 23:00 UTC, and the GOES-13 sounder Total Precipitable Water (TPW) derived product images (below; click image to play animation) showed that TPW values were as high as 46.7 mm or 1.84 inches (darker red color enhancement) at 22:00 UTC. METAR surface reports are plotted on the sounder images (Granbury is station identifier KGDJ, and Cleburne is station identifier KCPT).

GOES-13 sounder Total Precipitable Water derived product images (click image to play animation)

GOES-13 sounder Total Precipitable Water derived product images (click image to play animation)


View only this post Read Less

Convective Downbursts and Heatbursts in Wisconsin

Strong convection in the late afternoon/early evening produced wind damage and heat bursts over southern Wisconsin late in the day on May 14, 2013 in a region where severe convection was not considered likely. GOES Sounder data did an excellent job of depicting the instability that developed in the late afternoon. The animation above shows... Read More

GOES-13 Sounder Derived Lifted Index (click image to play animation)

GOES-13 Sounder Derived Lifted Index (click image to play animation)

Strong convection in the late afternoon/early evening produced wind damage and heat bursts over southern Wisconsin late in the day on May 14, 2013 in a region where severe convection was not considered likely. GOES Sounder data did an excellent job of depicting the instability that developed in the late afternoon. The animation above shows strong destabilization starting shortly after 1800 UTC, and persisting as the convection moved through southern Wisconsin.

GOES-13 Sounder Derived Lifted Index

GOES-13 Sounder Derived Lifted Index

The instability associated with this convective event was very localized, and easily slipped in between the radiosonde stations. This is therefore another example of the benefit of the GOES Sounder DPI products: Not only do they provide hour-by-hour coverage, so that an evolving situation can be monitored, but they can show mesoscale features that are poorly sampled by conventional radiosonde data. The above image shows the 2346 UTC 14 May GOES Sounder DPI LI over the upper midwest; superimposed upon the image are the Lifted Indices computed from radiosondes and the LI computed from the GFS model. The strongest instability is not well sampled by the radiosonde network.

GOES-13 Sounder Derived CAPE

GOES-13 Sounder Derived CAPE

Convective Available Potential Energy (CAPE) can also be used to diagnose the potential for convection. In regions where CAPE values are large, convection can grow explosively. The AWIPS screen capture of CAPE computed from the sounder, above, shows values exceeding 4000 J/kg even after the convection has passed!

GOES-13 Visible (0.63 µm) Imagery (click image to play animation)

GOES-13 Visible (0.63 µm) Imagery (click image to play animation)

Visible imagery from GOES-13, above, shows the development of the convection as it moves into the area of diagnosed instability. The Microburst Windspeed Potential Index (MWPI) predicts maximum wind gusts that might occur given the thermal profiles associated with developing convection. Attributes that promote downbursts are steep mid-level lapse rates (to enhance convective instability) and abundant dry air (to enhance evaporative cooling). The two animations below (created using McIDAS-V and this bundle) show a maximum in MWPI (with values near 50 — the relationship between MWPI and convective gusts is here) developing over southwest WI as the convection develops. (Data are from the Rapid Refresh model run at 2200 UTC on Tuesday 14 May). The animation of model soundings over Madison (bottom) indicates strong destabilization and mid-level drying, two components that enhance the potential for microbursts. (McIDAS-V animations courtesy of Ken Pryor, NOAA/NESDIS)

Microbust Windspeed Potential Index (MWPI) from 2200 UTC 14 May-0100 UTC 15 May over Wisconsin.  Data from Rapid Refresh Model

Microbust Windspeed Potential Index (MWPI) from 2200 UTC 14 May-0100 UTC 15 May over Wisconsin. Data from Rapid Refresh Model

Rapid Refresh Model Soundings over Madison, WI from 2200 UTC 14 May-0100 UTC 15 May over Wisconsin

Rapid Refresh Model Soundings over Madison, WI from 2200 UTC 14 May-0100 UTC 15 May over Wisconsin

GOES Sounder DPI products are available here. YouTube videos of the convection, obtained from the cameras on the roof of SSEC, are available here (looking east) and here (looking north).

View only this post Read Less

Stray Light in GOES Imager data

Each year, about every 6 months, the Earth-Sun-Satellite geometry is such that the GOES Imager can look right at the Sun. In the past, there were ‘keep-out zones’ in which the satellites did not image because it was known to be looking at the Sun during those times. The imagery... Read More

GOES-13 0.63 µm visible channel images (click image to play animation)

GOES-13 0.63 µm visible channel images (click image to play animation)

Each year, about every 6 months, the Earth-Sun-Satellite geometry is such that the GOES Imager can look right at the Sun. In the past, there were ‘keep-out zones’ in which the satellites did not image because it was known to be looking at the Sun during those times. The imagery above, from GOES-13, shows visible light in the night-time imagery. (Click here for a similar GOES-15 animation). Stray light values typically peak around 0500 UTC for GOES-East and around 0900 UTC for GOES-West.

In addition, imagery was not possible during the so-called ‘eclipse season’ because the satellites lacked sufficient batteries to power the instruments as they passed through Earth’s shadow. Now, an improved battery system on the current generation GOES-13/14/15 satellites allows for imaging to proceed while the satellite is in the Earth’s shadow.

This new scheduling, however, introduces issues. The GOES Imager is calibrated by periodic looks into deep space, regions from which only very small amounts of radiation (at 3.9, 6.5, 10.7 and 13.3 µm) are being emitted. These ‘space looks’ are on either side of the full-disk GOES Image. During the ‘eclipse season’, that space look can include part of the solar energy, meaning the very small amount of radiation that the satellite is designed to detect is actually potentially significant. Thus, the calibration of the image can be affected. NOAA NESDIS does operationally correct images with ‘stray light’, but this correction does not consider the impact of a corrupted space view. The GOES-13 stray light corrections were implemented in 2012, as discussed here on this blog.

In addition to the calibration images, solar radiation can also be scattered off clouds towards the imager. So, instead of detecting only emitted radiation at night, the GOES Imager is detecting emitted terrestrial radiation in addition to scattered/reflected solar radiation. This solar radiation contaminates the signal, and results in ‘too much’ radiance being detected, resulting in warmer-than-actual inferred blackbody/brightness temperatures.

GOES-13 imagery from infrared channels (click image to enlarge)

GOES-13 imagery from infrared channels (click image to enlarge)

When Stray Light issues occur, the most noticeable effects are in the 3.9 µm channel (Above loop, bottom left) and in products that use the 3.9 µm channel, such as the brightness temperature difference (Above loop, top left). In other words, this calibration issue can affect derived products that use 3.9 µm data at night. The image below shows how the 3.9 µm imagery can change when Stray Light is an issue. Compare the 0415 UTC image, on the left, when Stray Light did not contaminate the space look, with the 0502 UTC image on the right, when Stray Light was an issue.

GOES-13 3.9 µm imagery

GOES-13 3.9 µm imagery

NESDIS is considering methods of mitigating the stray light issues that occasionally occur in the GOES Imager.

View only this post Read Less