")
GOES-14 0.63 µm visible channel images (click image to play animation)
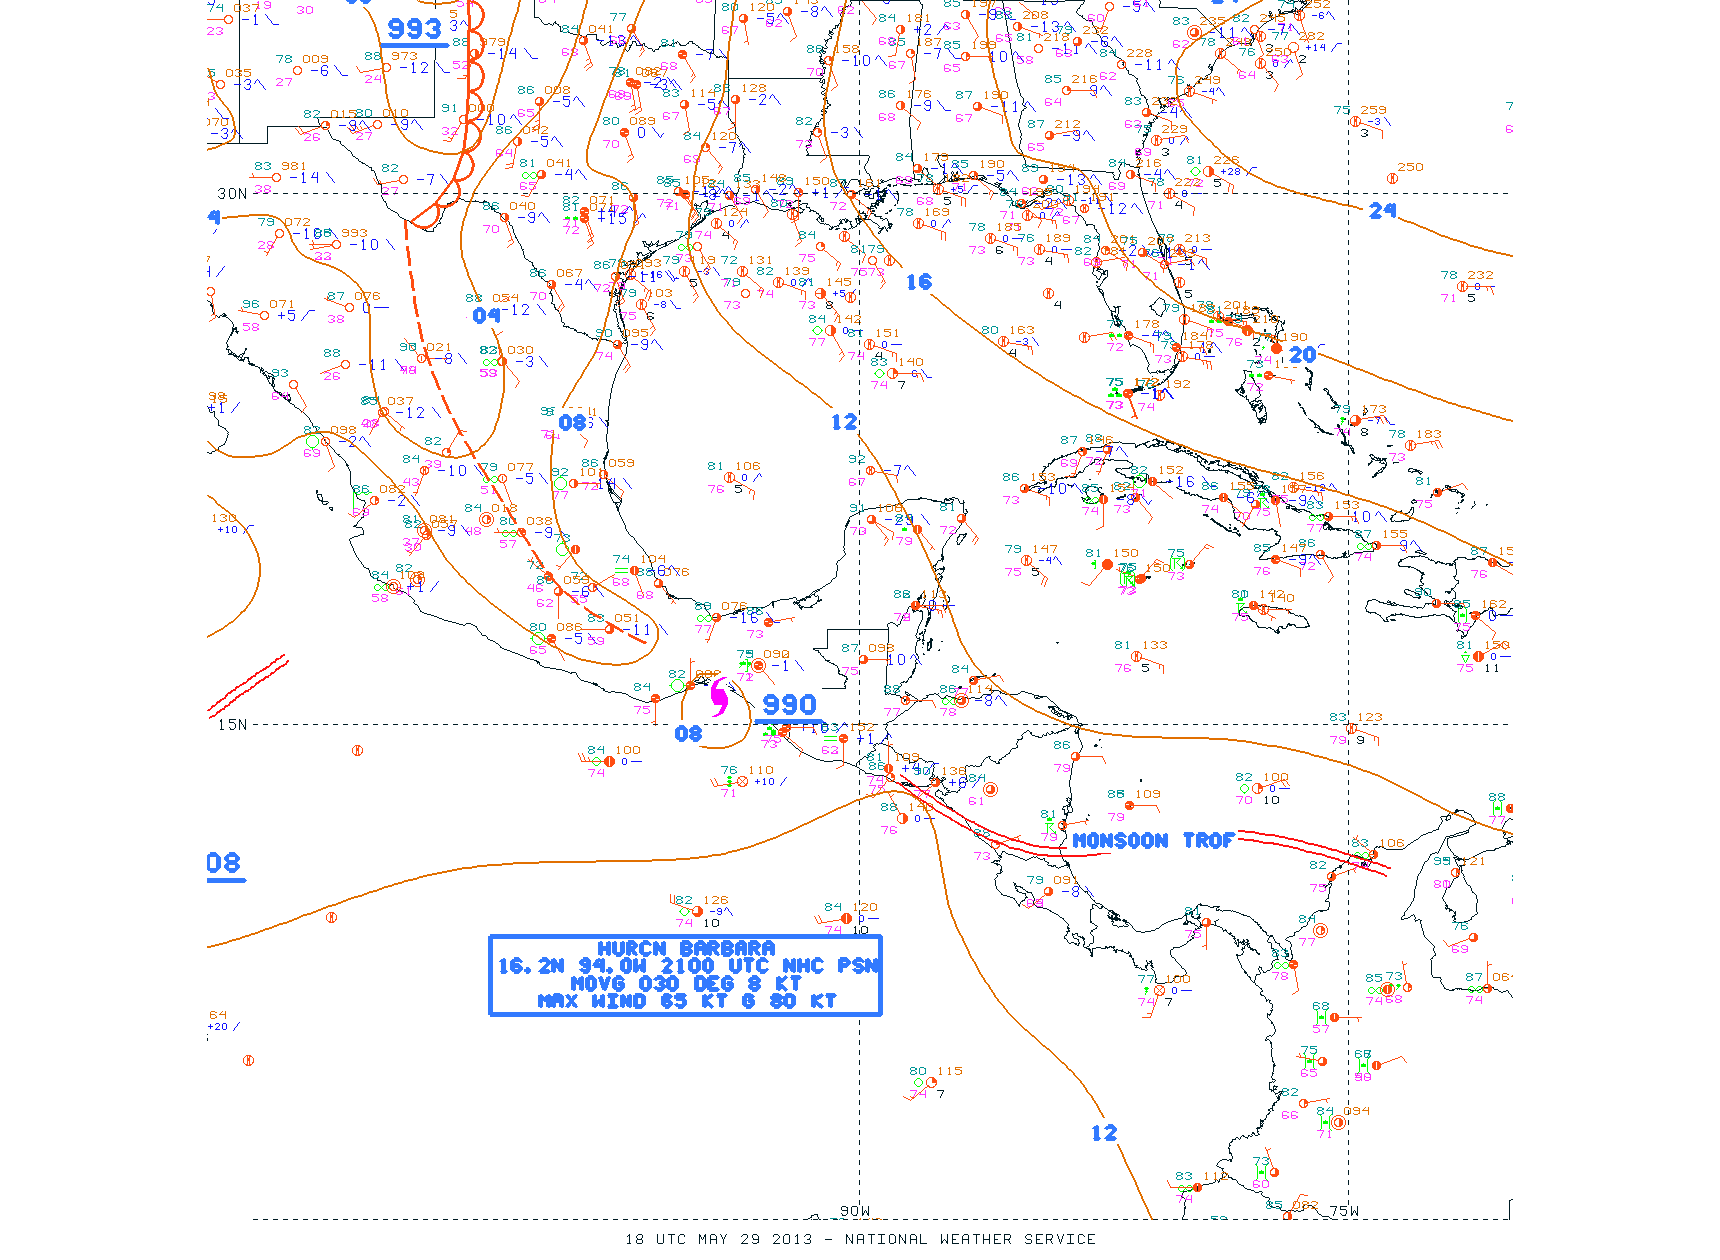
McIDAS images of GOES-14 0.63 µm visible channel data (above; click image to play animation) showed Tropical Storm Barbara as it intensified to Category 1 hurricane shortly before making landfall along the coast of the Gulf of Tehuantepec in southeastern Mexico on 29 May 2013. Since reliable records began for the Eastern Pacific Basin in 1966, Hurricane Barbara was the second-earliest hurricane landfall, as well as the easternmost landfall location.
An AWIPS image of ASCAT surface scatterometer winds overlaid on a GOES IR image (below) depicted a maximum wind speed of 53 knots at 16:01 UTC (while Barbara was still at tropical storm intensity).

ASCAT surface scatterometer winds
A 375-meter resolution Suomi NPP VIIRS 11.45 µm IR image at 19:35 UTC (below) showed the very cold cloud-top IR brightness temperatures (primarily in the -80 to -90 C range, enhanced with varying shades of violet) associated with convective clusters around the center of Hurricane Barbara as the storm was making landfall along the Mexican coast.
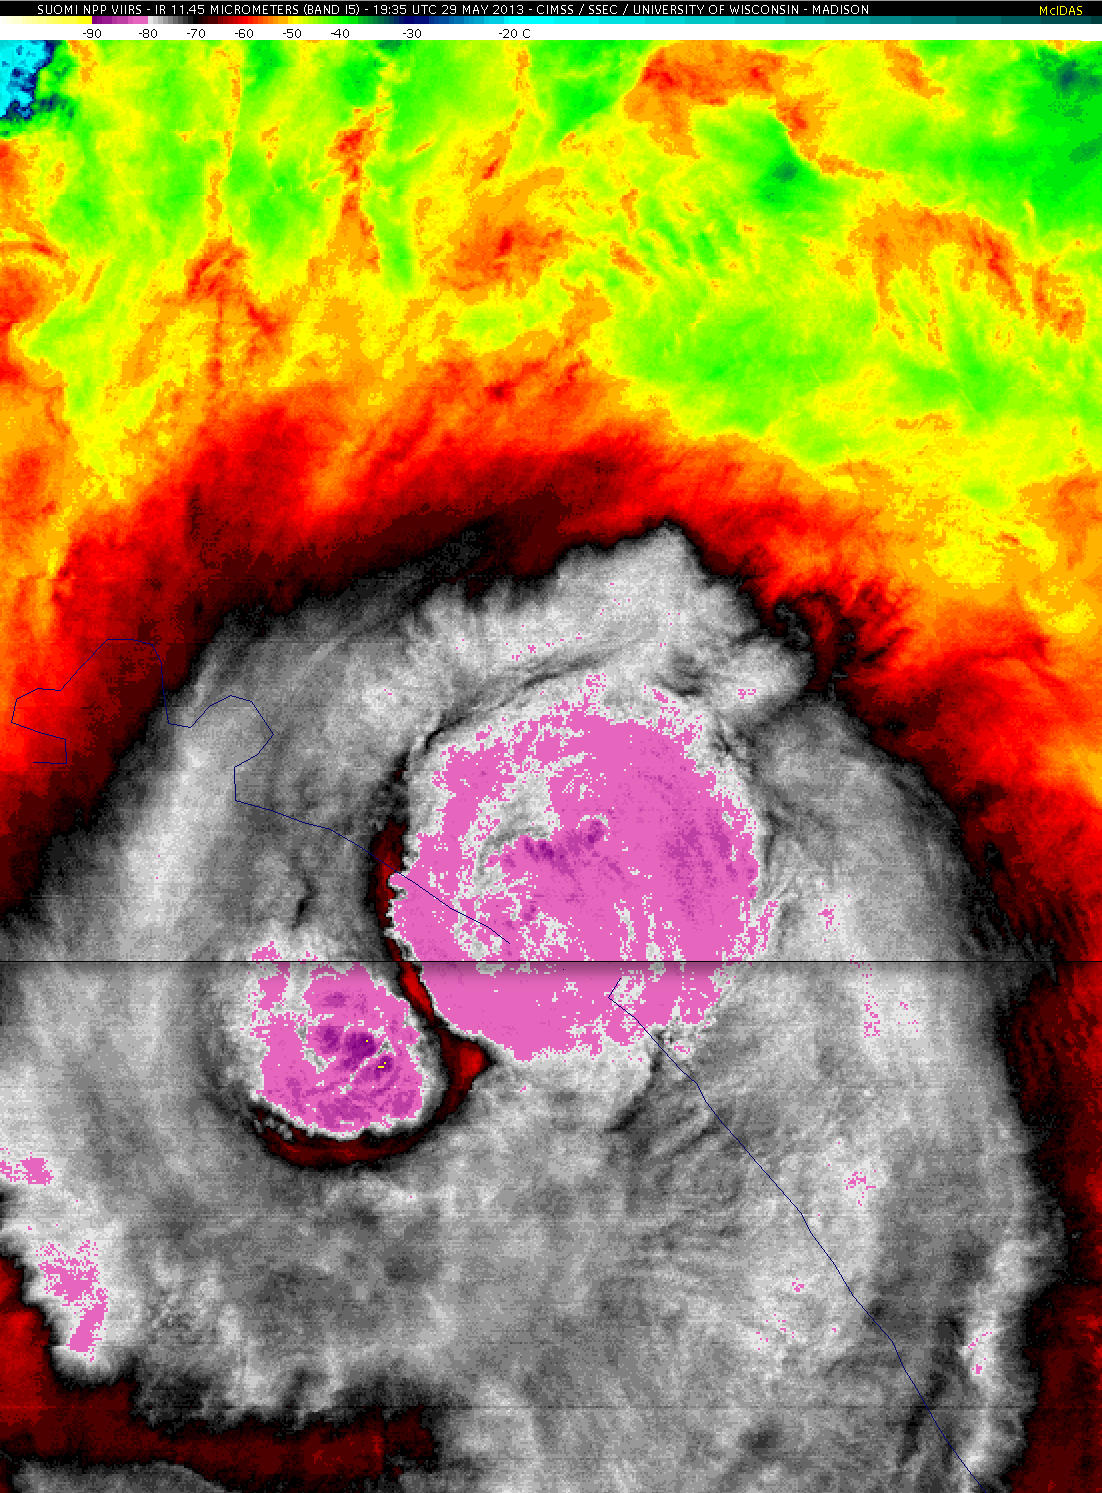
Suomi NPP VIIRS 11.45 µm IR image
 ===== 30 May Update =====
GOES-14 0.63 µm visible channel images (below; click image to play animation) seem to suggest that the low-level circulation of Barbara remained intact after crossing the rugged terrain of southern Mexico, and emerged into the Gulf of Mexico on 30 May. The GOES-14 satellite had been placed into Rapid Scan Operations (RSO), providing images as frequently as every 5-10 minutes.
")
GOES-14 0.63 µm visible channel images (click image to play animation)
View only this post Read Less
")
")
 imagery")
 imagery from GOES-13 and GOES-14")
")
