The Yarnell Hill Fire was a relatively small wildfire that was started by lightning from a dry thunderstorm southwest of Prescott, Arizona on 28 June 2013. However, fire conditions became more favorable for growth on 30... Read More
")
GOES-15 0.63 µm visible channel images (click image to play animation)
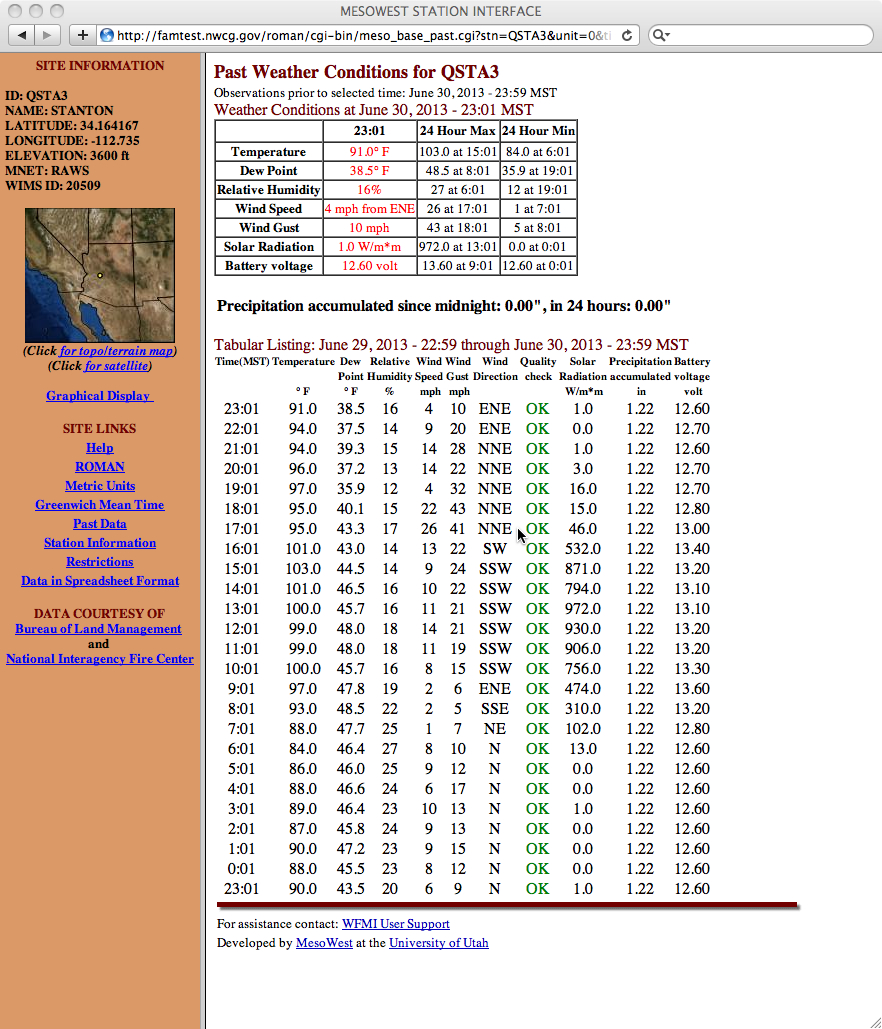
The Yarnell Hill Fire was a relatively small wildfire that was started by lightning from a dry thunderstorm southwest of Prescott, Arizona on 28 June 2013. However, fire conditions became more favorable for growth on 30 June, as surface air temperatures rose above 100 F across the area with low relative humidity values. During the afternoon hours, GOES-15 0.63 µm visible channel images (above) showed that a line of thunderstorms developed over northwestern Arizona, and moved toward the southwest (the red circle highlights the general area of the Yarnell fire). It is likely that strong surface winds associated with a thunderstorm outflow boundary (nearby surface mesonet data) caused rapid growth and an abrupt change in direction of the fire, which tragically killed 19 firefighters who attempted to shelter in place (for additional details, see the Wildfire Today site).
On the GOES-15 visible imagery, a smoke plume became more obvious after 16:45 UTC, with the first formation of pyrocumulus clouds evident at 21:00 and 21:30 UTC. As the cloud shield of the thunderstorm line moved over the fire, the images revealed the development of a pyrocumulonimbus (pyroCb) cloud which exhibited a pronounced overshooting top at 23:45 UTC.
")
GOES-15 0.63 µm visible channel images (click image to play animation)
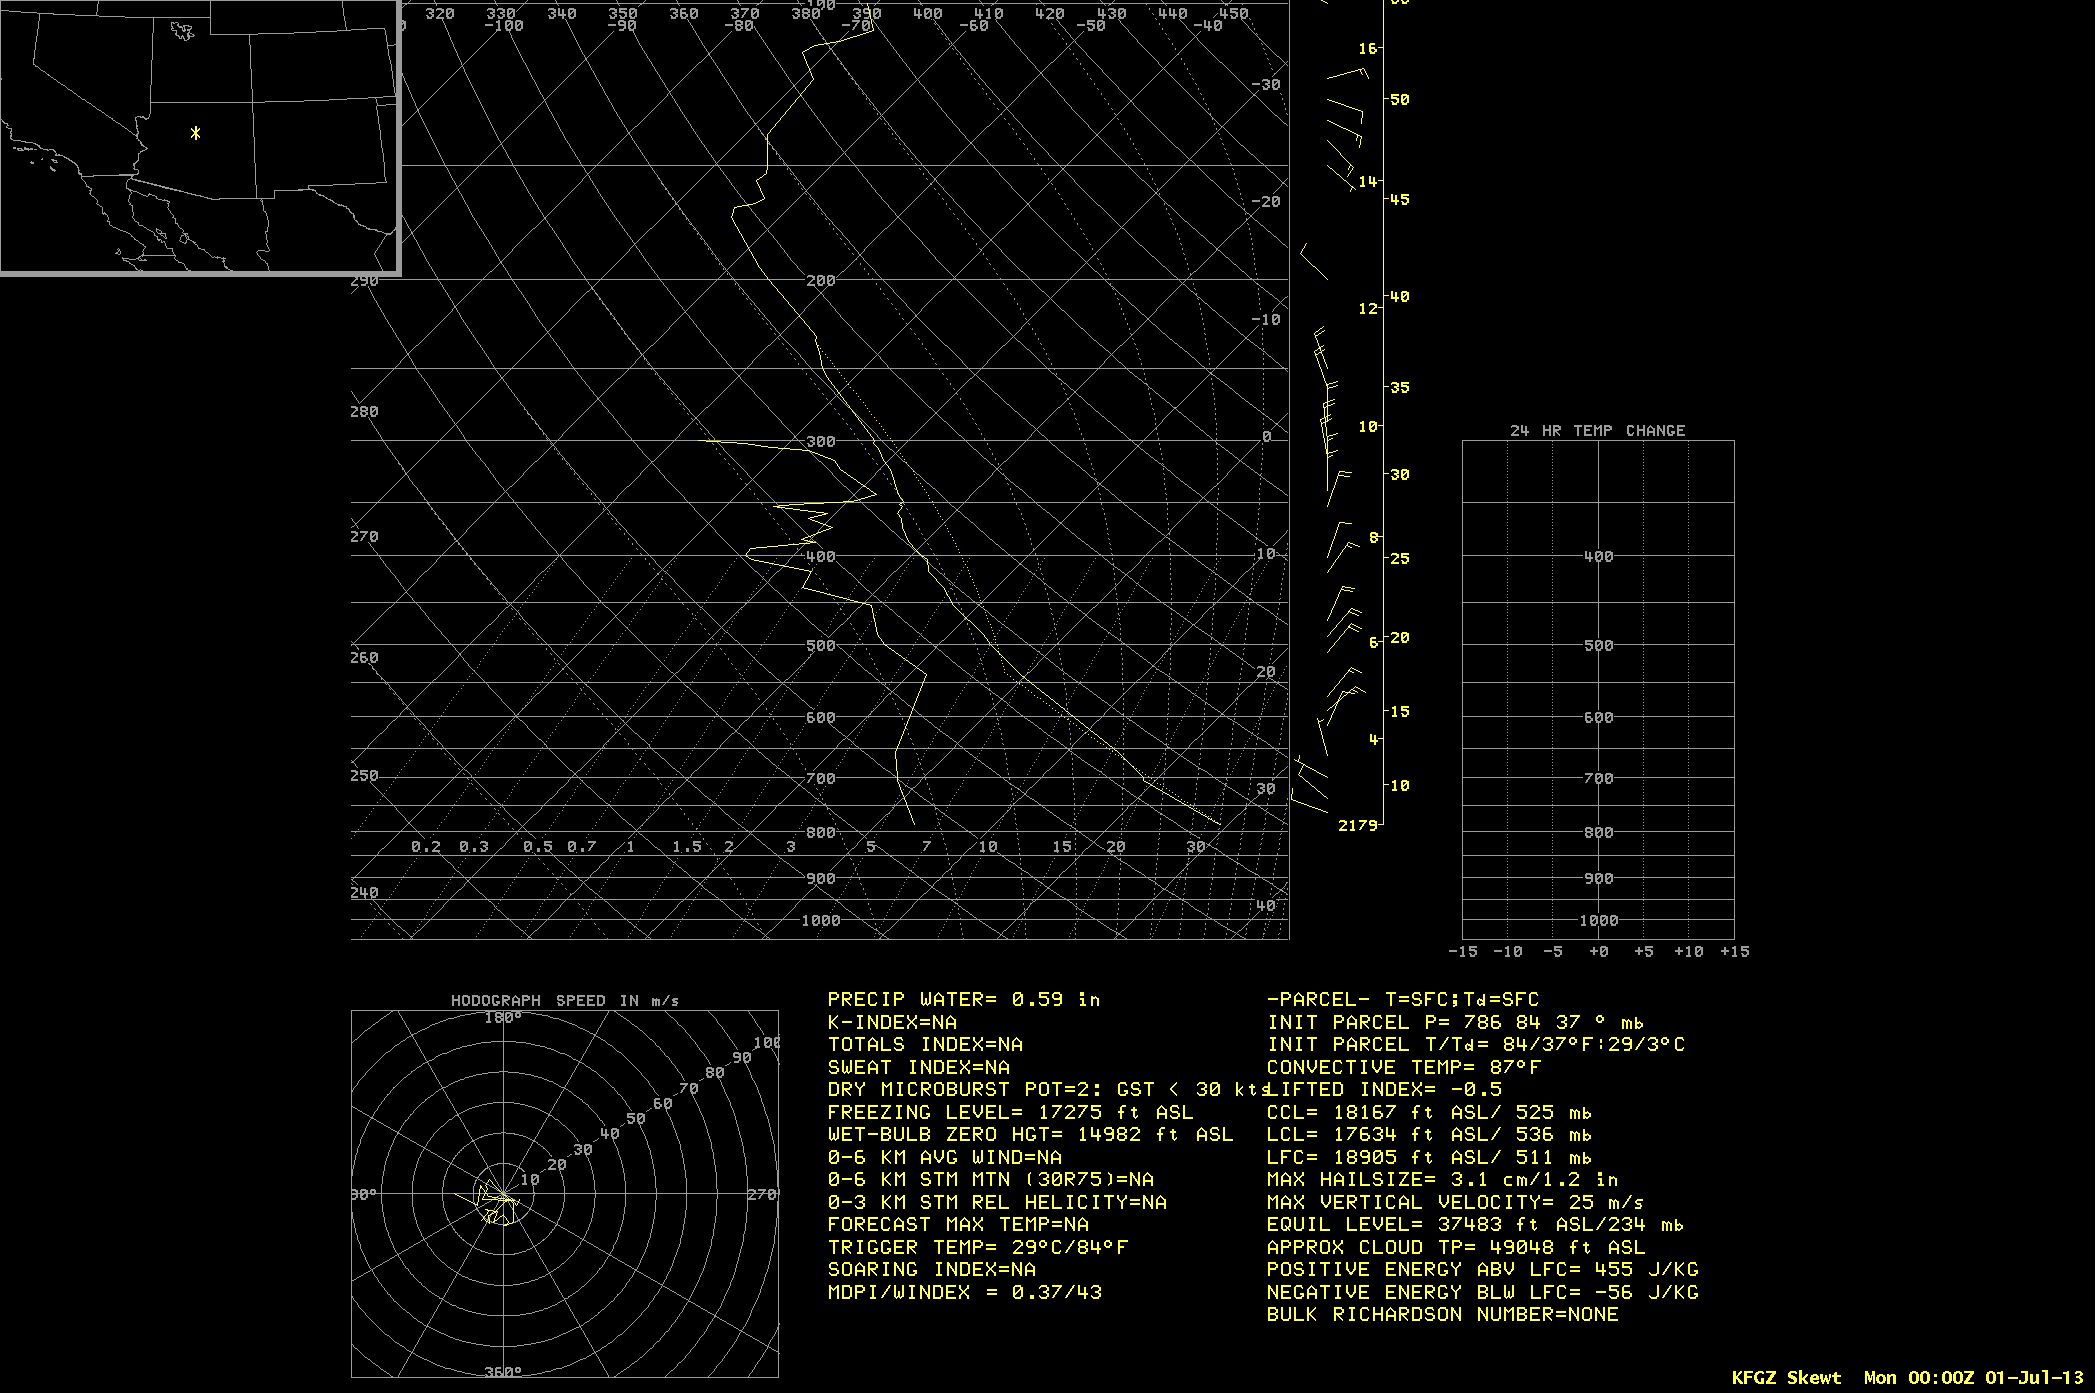
Taking a look at the period of pyroCb formation, the overshooting plume and pronounced overshooting top could be seen spreading southward (due to northerly winds aloft, as shown on Flagstaff AZ rawinsonde data) on the GOES-15 0.63 µm visible images (above) — and this pyroCb plume and overshooting top appeared warmer/darker on GOES-15 3.9 µm shortwave IR images (below), which indicated that the plume was comprised of smaller particles (that were more efficient reflectors of solar radiation).
")
GOES-15 3.9 µm shortwave IR images (click image to play animation)
On GOES-15 10.7 µm longwave IR images (below), the coldest cloud top IR brightness temperature of -65 C (darker red color enhancement) was associated with the pyroCb overshooting top at 23:45 UTC.
")
GOES-15 10.7 µm longwave IR images (click image to play animation)
Shown below is a comparison of the 23:45 UTC images of GOES-15 visible, shortwave IR, and longwave IR images.

Comparison of 23:45 UTC GOES-15 visible, shortwave IR, and longwave IR images
A comparison of Suomi-NPP 0.64 µm visible channel and 11.45 µm IR channel images at 21:22 UTC (below) showed the Yarnell fire “hot spot” (dark black pixels), with some pyrocumulus clouds beginning to form to the east/northeast of the fire source (due to strong southwesterly winds in the boundary layer).

Suomi-NPP VIIRS 0.64 µm visible and 11.45 µm longwave IR images
The corresponding Suomi-NPP VIIRS true color RGB image is shown below, visualized using the SSEC Web Map Server. Again, the smoke plume from the fire can be seen, along with the development of pyrocumulus clouds to the east/northeast.

Suomi-NPP VIIRS true color RGB image
")
Flagstaff, Arizona WSR-88D radar base reflectivity and volume of 13.5 dBZ reflectivity isosurface (click image to play animation)
Volumetric displays of Flagstaff, Arizona WSR-88D radar base reflectivity and spectrum width are shown above and below, respectively (radar data visualized using GR2Analyst software, courtesy of Jordan Gerth, CIMSS). The viewing perspective is looking from the northwest, so Prescott is located in the left corner of the data cube, and the Yarnell fire with its growing pyrocumulus (pyroCu) and pyrocumulonimbus (pyroCb) cloud is located in the right corner of the data cube.
The blue-shaded isosurface of the 13.5 dBZ base reflectivity (from 22:42 to 23:48 UTC) showed the upward pulsing of the pyroCu and finally the pyroCb, which grew upward past an altitude of 40,000 feet on the final image (23:48 UTC, about the time that the prominent overshooting top was seen on the 23:45 UTC GOES-15 visible image).
The Doppler radar spectrum width is shown from 23:34 to 23:48 UTC. This parameter represents the amount of variance in the velocity field. Note the higher spectrum width values (darker orange shading) associated with the growth of the pyroCb cloud over the Yarnell fire — this was likely a result of the variety of particles (biomass burning particles, supercooled water droplets, ice crystals) moving upward at different velocities because of their differing size and shape characteristics.
")
Flagstaff, Arizona WSR-88D radar spectrum width (click image to play animation)
View only this post
Read Less
")
")


")
")
")
")
")
")
")


