Tropical Storm Chantal, the third named storm of the northern Atlantic Tropical Season, has rapidly moved through the Lesser Antilles and into the eastern Caribbean Sea. The stereoscopic view of Chantal, above, uses visible (0.65 µm) imagery from GOES-12 (over the Equator at 60 W) and visible (0.63 µm) imagery... Read More

Stereoscopic View of Tropical Storm Chantal
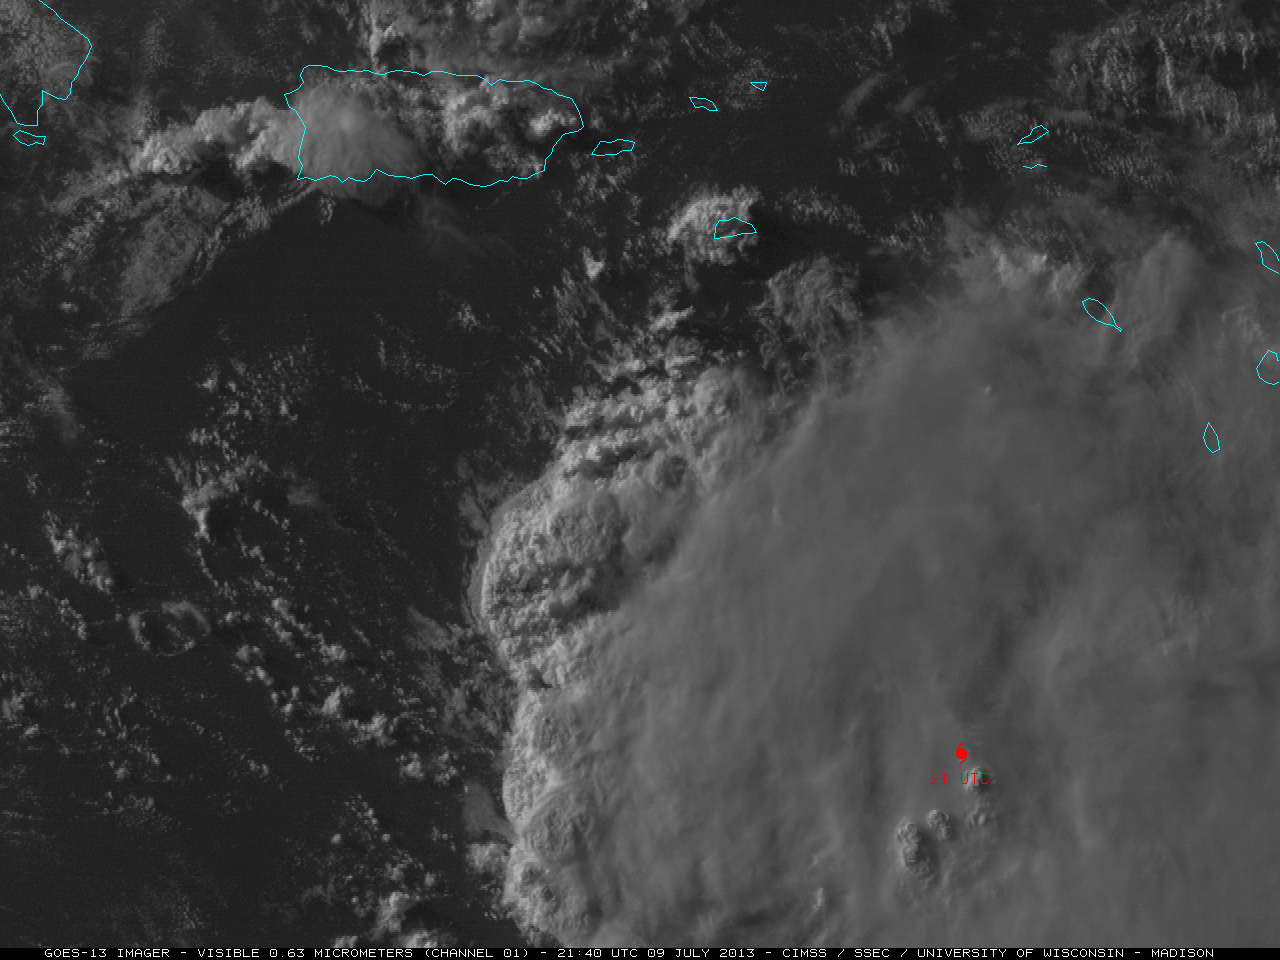
Tropical Storm Chantal, the third named storm of the northern Atlantic Tropical Season, has rapidly moved through the Lesser Antilles and into the eastern Caribbean Sea. The stereoscopic view of Chantal, above, uses visible (0.65 µm) imagery from GOES-12 (over the Equator at 60 W) and visible (0.63 µm) imagery from GOES-13 (over the Equator at 75 W) and shows Chantal as it moved between Martinique and St. Lucia. A similar image, but at 10.7 µm, is here. Coldest brightness temperatures northeast of the storm center were -78 C.
")
GOES-13 0.63 µm visible channel images (click image to play animation)
The GOES-13 satellite had been placed into Rapid Scan Operations (RSO) mode, providing images as frequently as every 5-10 minutes. Visible imagery (above; click image to play animation) revealed the presence of low-level convective outflow boundary cloud arcs along the western periphery of Tropical Storm Chantal. The appearance of these cloud arcs can be an indication that a tropical cyclone has encountered an area of dry air aloft (generally either from the Saharan Air Layer, or a mid-latitude dry air intrusion), which can sometimes have a negative effect on the rate of intensification of the storm. However, in this case, Chantal slowly intensified during the day as it moved over the warm waters and high ocean heat content that were in place over the western Caribbean Sea.

Morphed Microwave Estimates of Total Precipitable Water
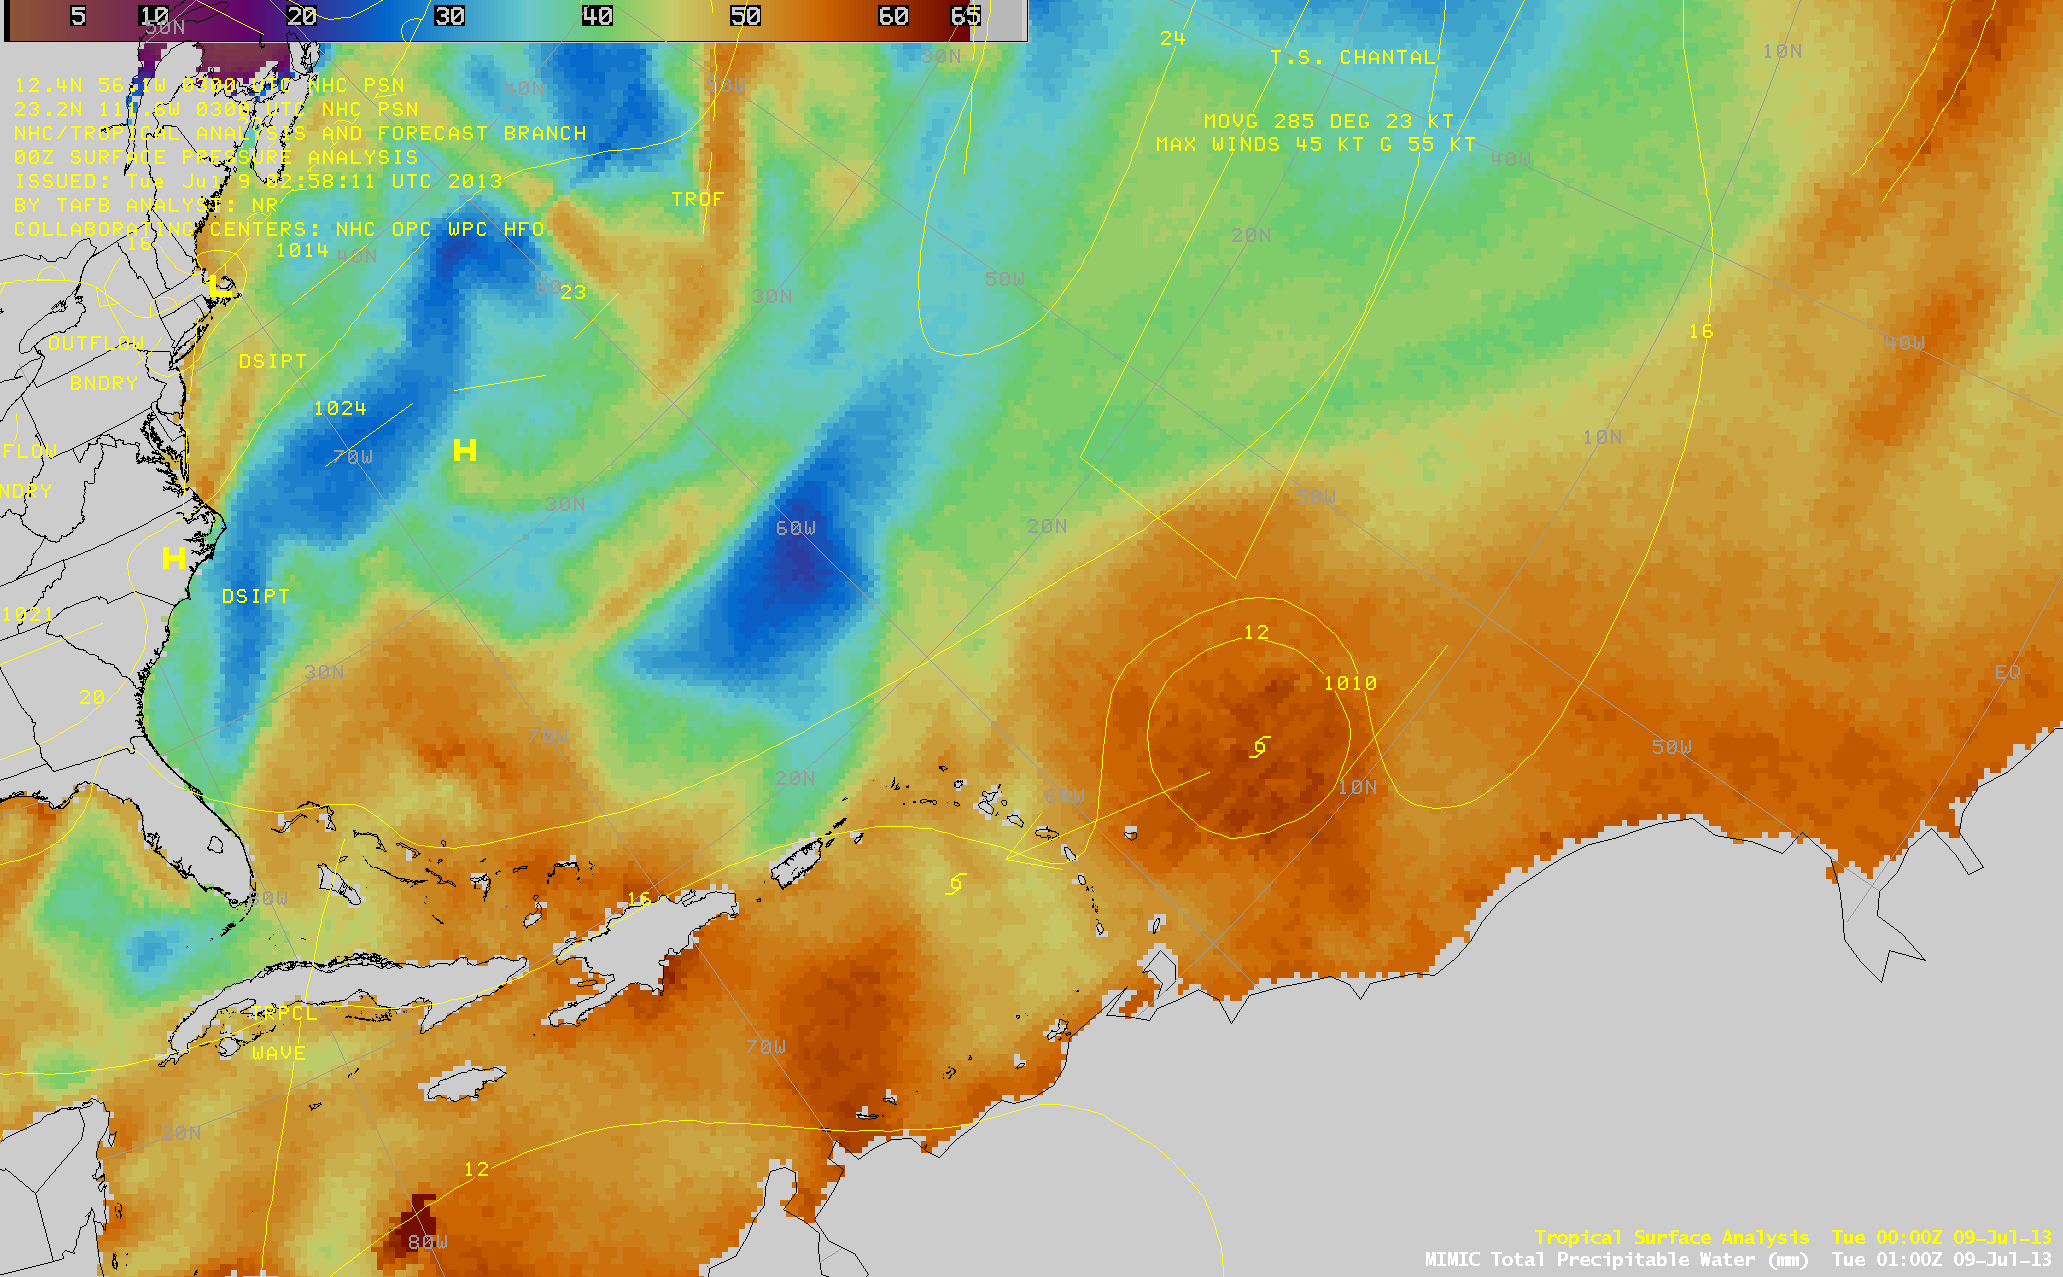
The morphed animation of Total Precipitable Water (TPW) from the CIMSS MIMIC site, above, shows the maximum in TPW associated with Chantal moving west-northwestward across the tropical Atlantic on a path towards the Greater Antilles — likely Hispaniola. (Note to NWS WFOs: MIMIC TPW is available via LDM subscription and can be displayed in AWIPS). Several products available at the CIMSS Tropical Cyclones website (in addition to the MIMIC TPW above) can be used to diagnose the environment around the system and the strength of the system.

Objectively-determined Overshooting Tops over the Tropical Atlantic, 1915 UTC 9 July 2013
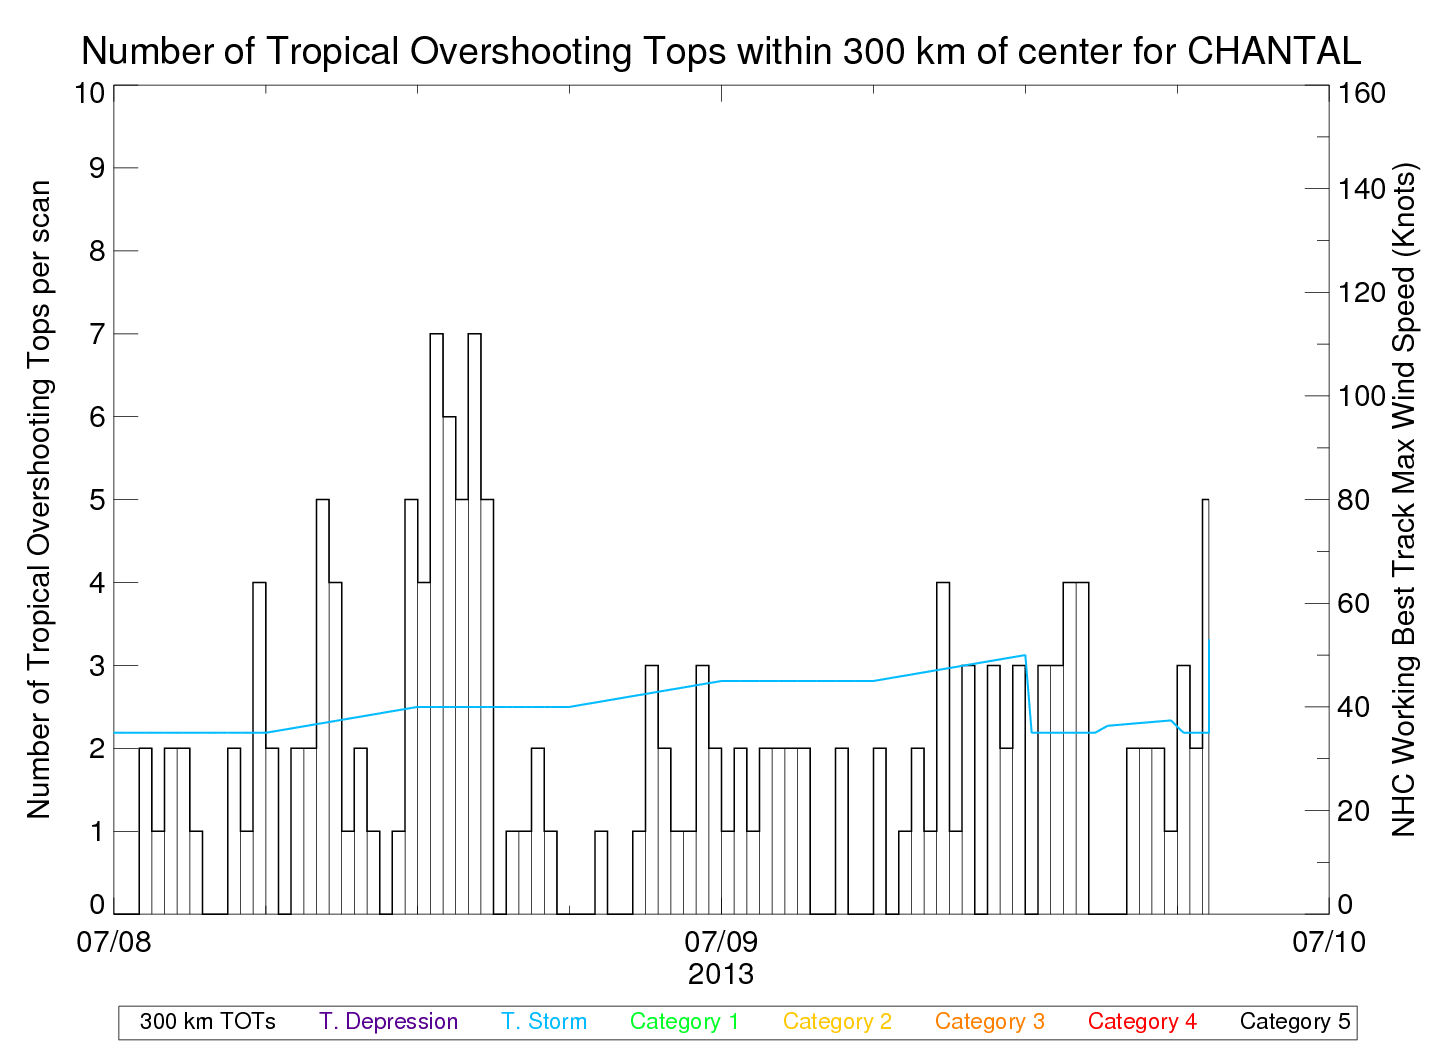
For example, Tropical Overshooting Tops (TOTs) (at this site), are related to the vigor of the convection that is sustaining the Tropical Storm. The objectively-determined TOTs, above, show a cluster within the convective envelope of the system. This suggests ongoing strong convection and a storm that is at minimum maintaining its strength at present. (Given that the upper-level environment can change rapidly, the presence of TOTs may not be well-correlated with strengthening, however). This line plot shows the maximum sustained winds of the system plotted with the number of TOTs near the system.

Saharan-Air Layer Analysis, Tropical Atlantic, 1800 UTC 9 July 2013
Dust from the Sahara Desert that is lofted by winds and transported into the atmosphere above the tropical Atlantic has a well-known suppressing effect on convection and therefore tropical cyclone development and strengthening. It is often visible from satellite. The SAL analysis, above, (from this site) shows little to impede Chantal as it moves into the Caribbean. Most of the SAL at present is behind the storm.

Wind Shear and Tendency, derived from Satellite data, 1800 UTC 9 July 2013
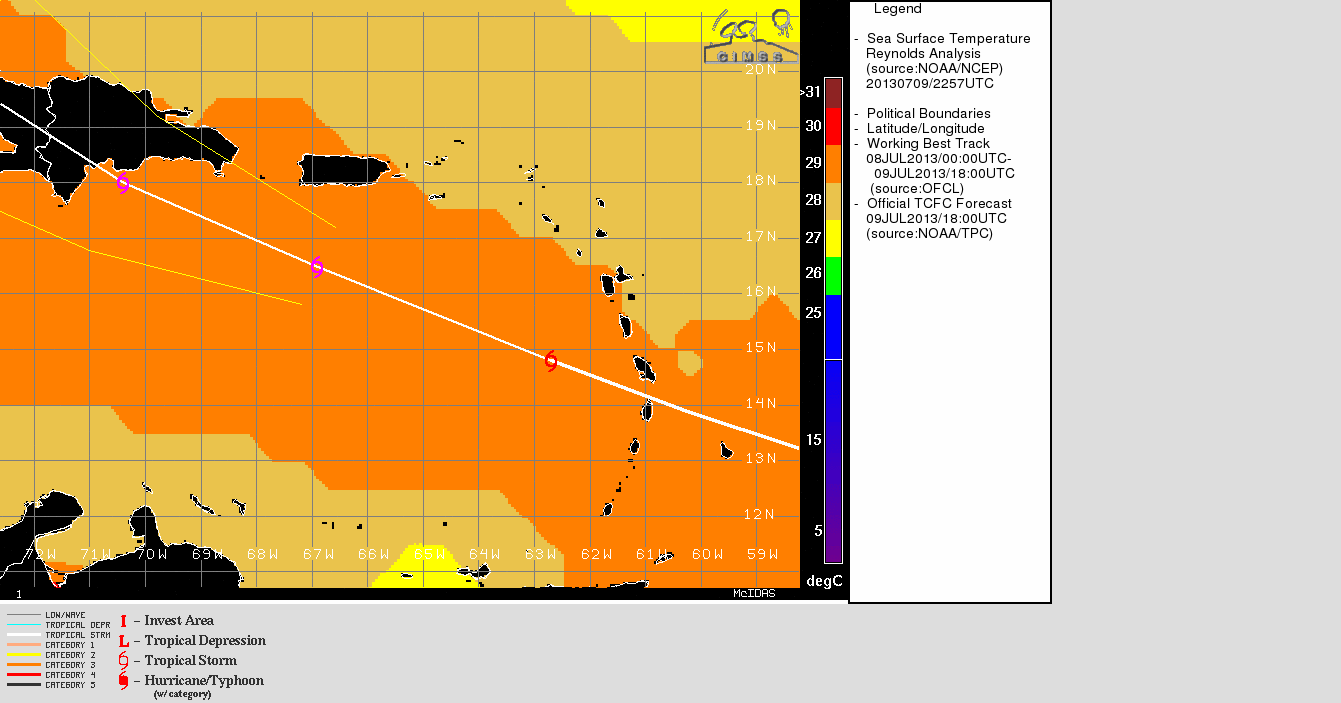
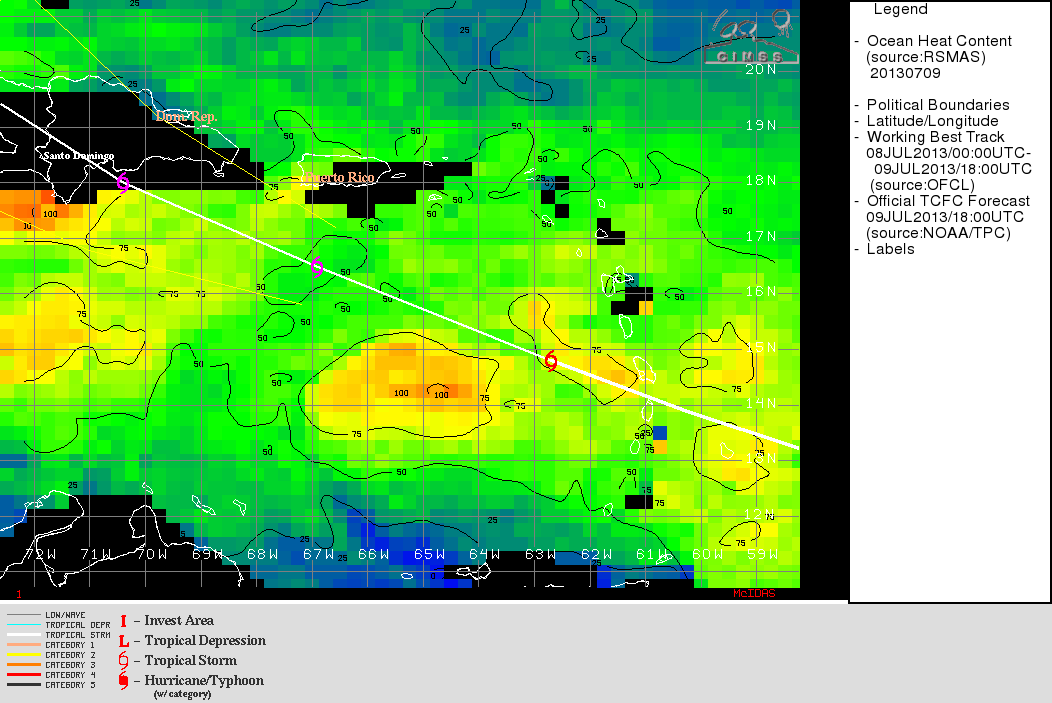
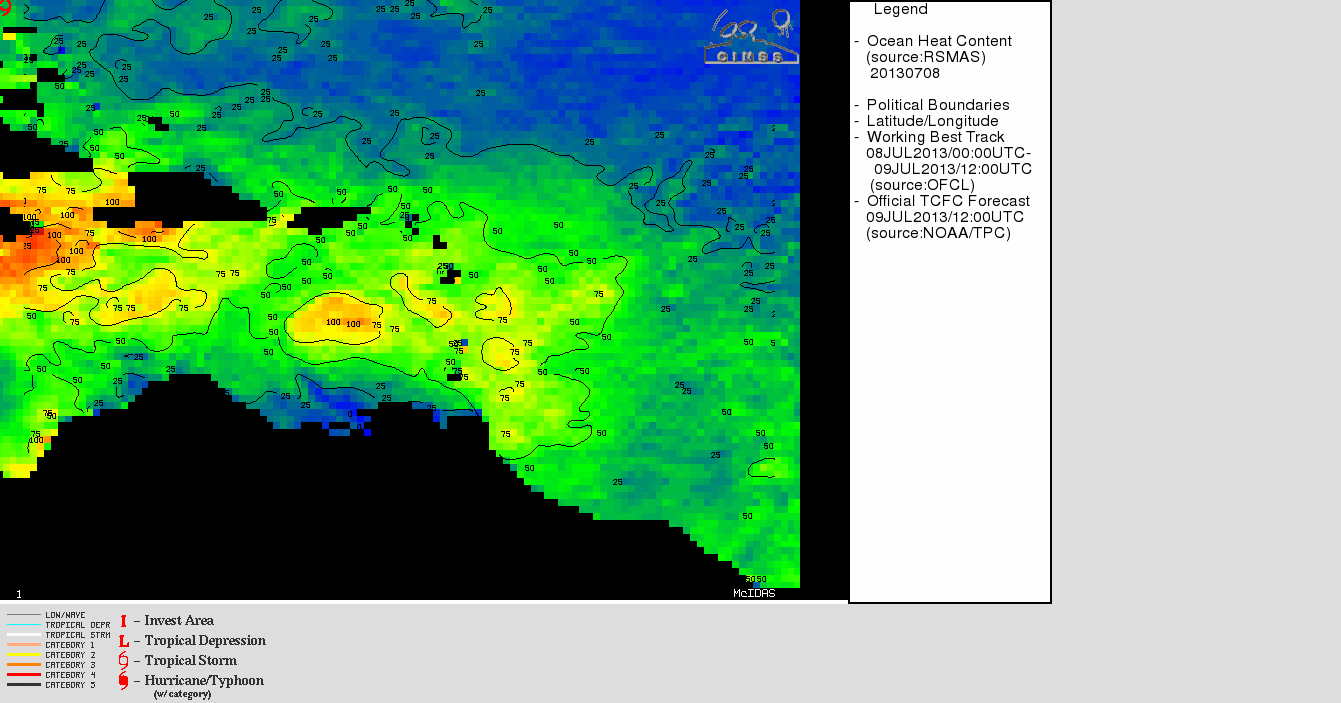
Other data at the CIMSS Tropical Cyclones site can be used to judge the environment that the storm is in. Around Chantal, for example, wind shear values (above, from here) are modest (and decreasing), but they increase in the direction that the storm is moving. Oceanic Heat Content in the Caribbean Sea surrounding Chantal is sufficient to support strengthening, and the current National Hurricane Center forecast does modestly strengthen the storm before landfall on or near Hispaniola.
View only this post
Read Less

")
 and GOES-13 (right) 0.63 µm visible channel images (click image to play animation)")
")


 and after (10 July) MODIS true-color RGB images showing the hail damage swath")
")


