Advanced Dvorak Technique (ADT) intensity estimation plot
As seen on a plot of the Advanced Dvorak Technique (ADT) intensity estimation (above), Typhoon Hagupit underwent a period of rapid intensification in the West Pacific Ocean late in the day on 03 December 2014, reaching Super Typhoon (Category 5) intensity on 04 December. During this period of rapid intensification, COMS-1 10.8 µm IR channel images (below; click to play animation; also available as an MP4 movie file) showed the development of a well-defined eye, with very cold cloud-top IR brightness temperatures (in the -80 to -90º C range, shades of violet) in the surrounding eyewall region.
COMS-1 10.8 µm IR channel images (click to play animation)
A nighttime comparison of Suomi NPP VIIRS 0.7 µm Day/Night Band and 11.45 µm IR channel images at 15:50 UTC on 03 December (below; images courtesy of William Straka, SSEC) showed great detail in the cloud top IR brightness temperature patterns, as well as demonstrated the “visible image at night” capability of the Day/Night Band (which benefited from an abundance of reflected moonlight from a nearly-full Moon).
Suomi NPP VIIRS 0.64 µm and 11.45 µm IR image comparison
A longer-term sequence (beginning on 30 November) of storm-centered COMS-1 IR images is shown below (click image to play animation).
COMS-1 10.8 µm storm-centered IR images (click to play animation)
COMS-1 0.675 µm visible channel images from the CIMSS Tropical Cyclones site (below; click image to play animation) revealed the presence of mesovortices within the eye of Hagupit, with intricatecloud-top banding structures seen surrounding the eye.
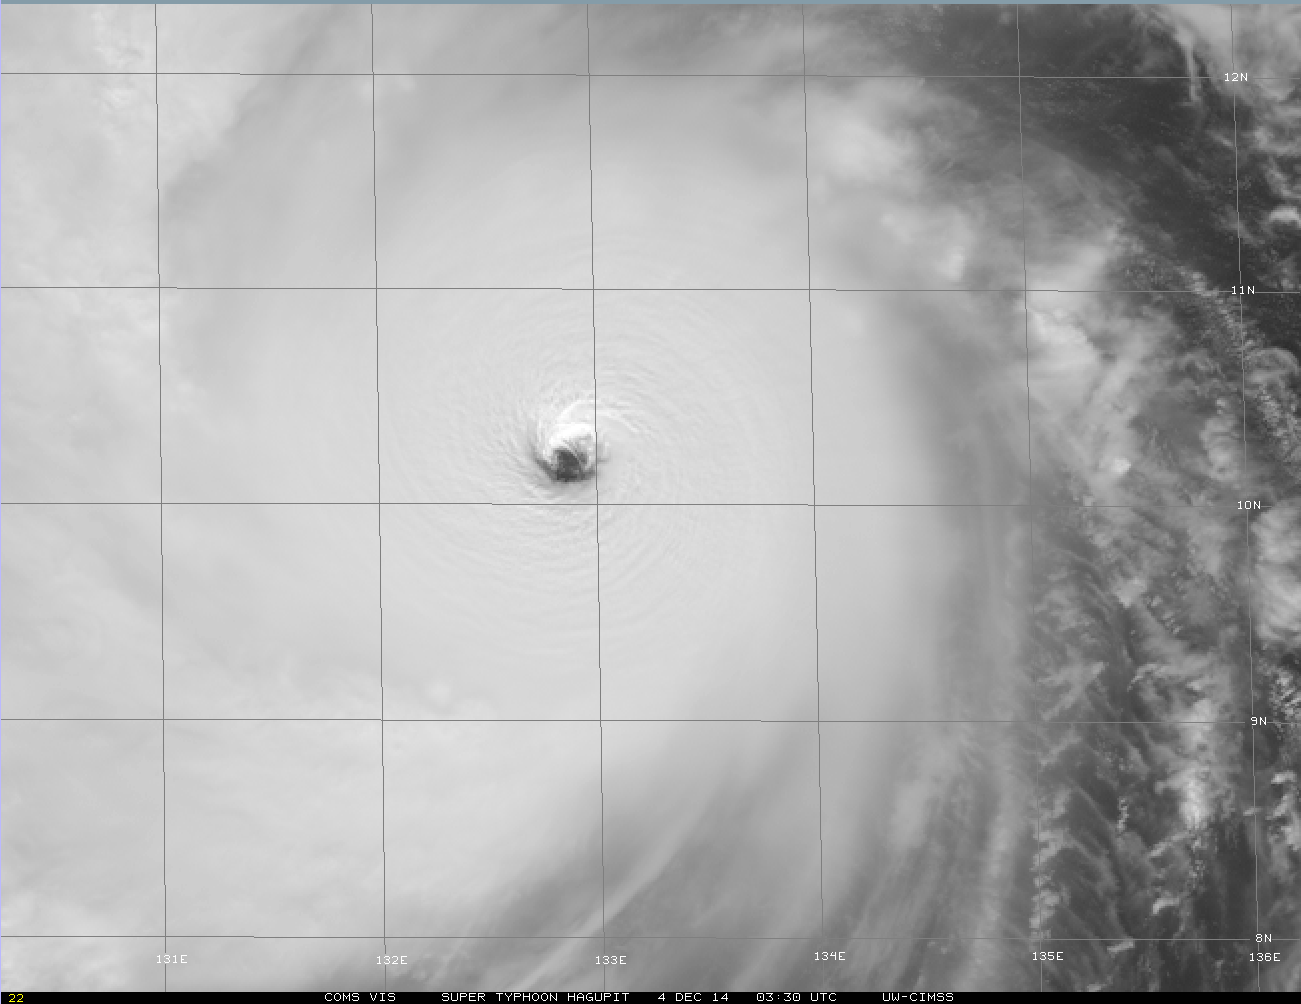
COMS-1 0.675 µm visible channel images (click to play animation)
A DMSP SSMIS 85 GHz microwave image at 22:43 UTC on 04 December (below) also showed the well-defined eyewall structure of the storm.
DMSP SSMIS 85 GHz microwave image
For additional images and information on Super Typhoon Hagupit, see the VISIT Meteorological Interpretation blog.
===== 06 December Update =====
A comparison of MTSAT 10.8 µm IR and TRMM TMI 85 GHz microwave images just after 16:30 UTC on 06 December (below) showed the center of Hagupit making landfall on the island of Samar in the Philippines as a Category 3 typhoon. The slow-moving tropical cyclone dropped as much as 300-400 mm (12-16 inches) of rainfall.
MTSAT 10.8 µm IR and TRMM TMI 85 GHz microwave images
View only this post Read Less


