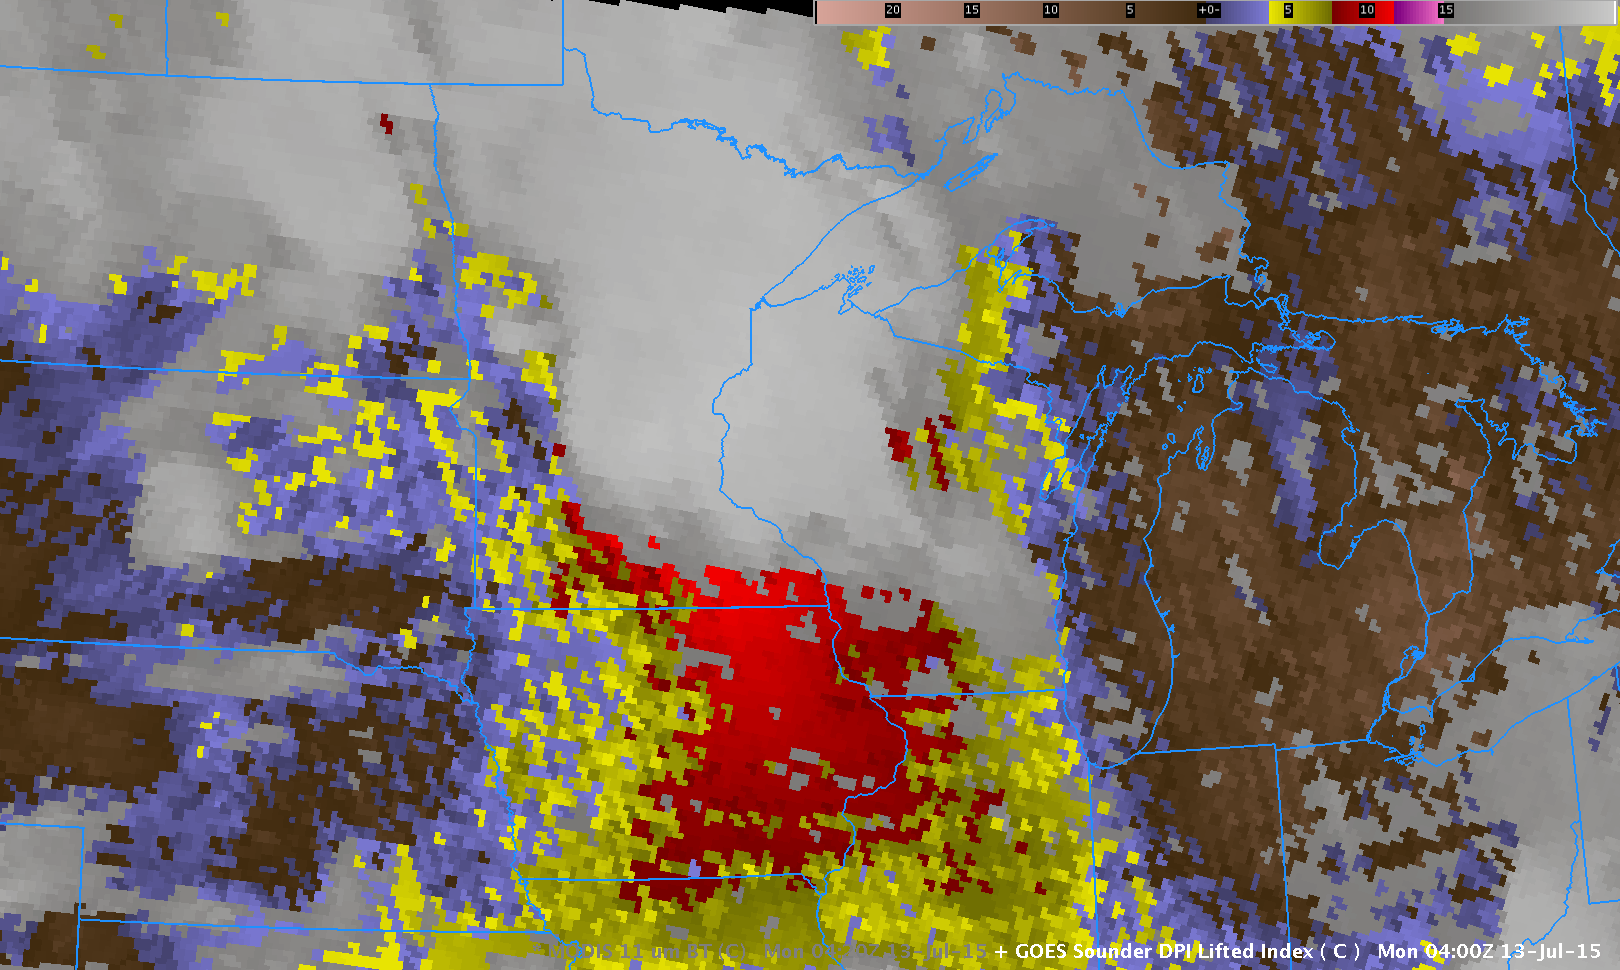
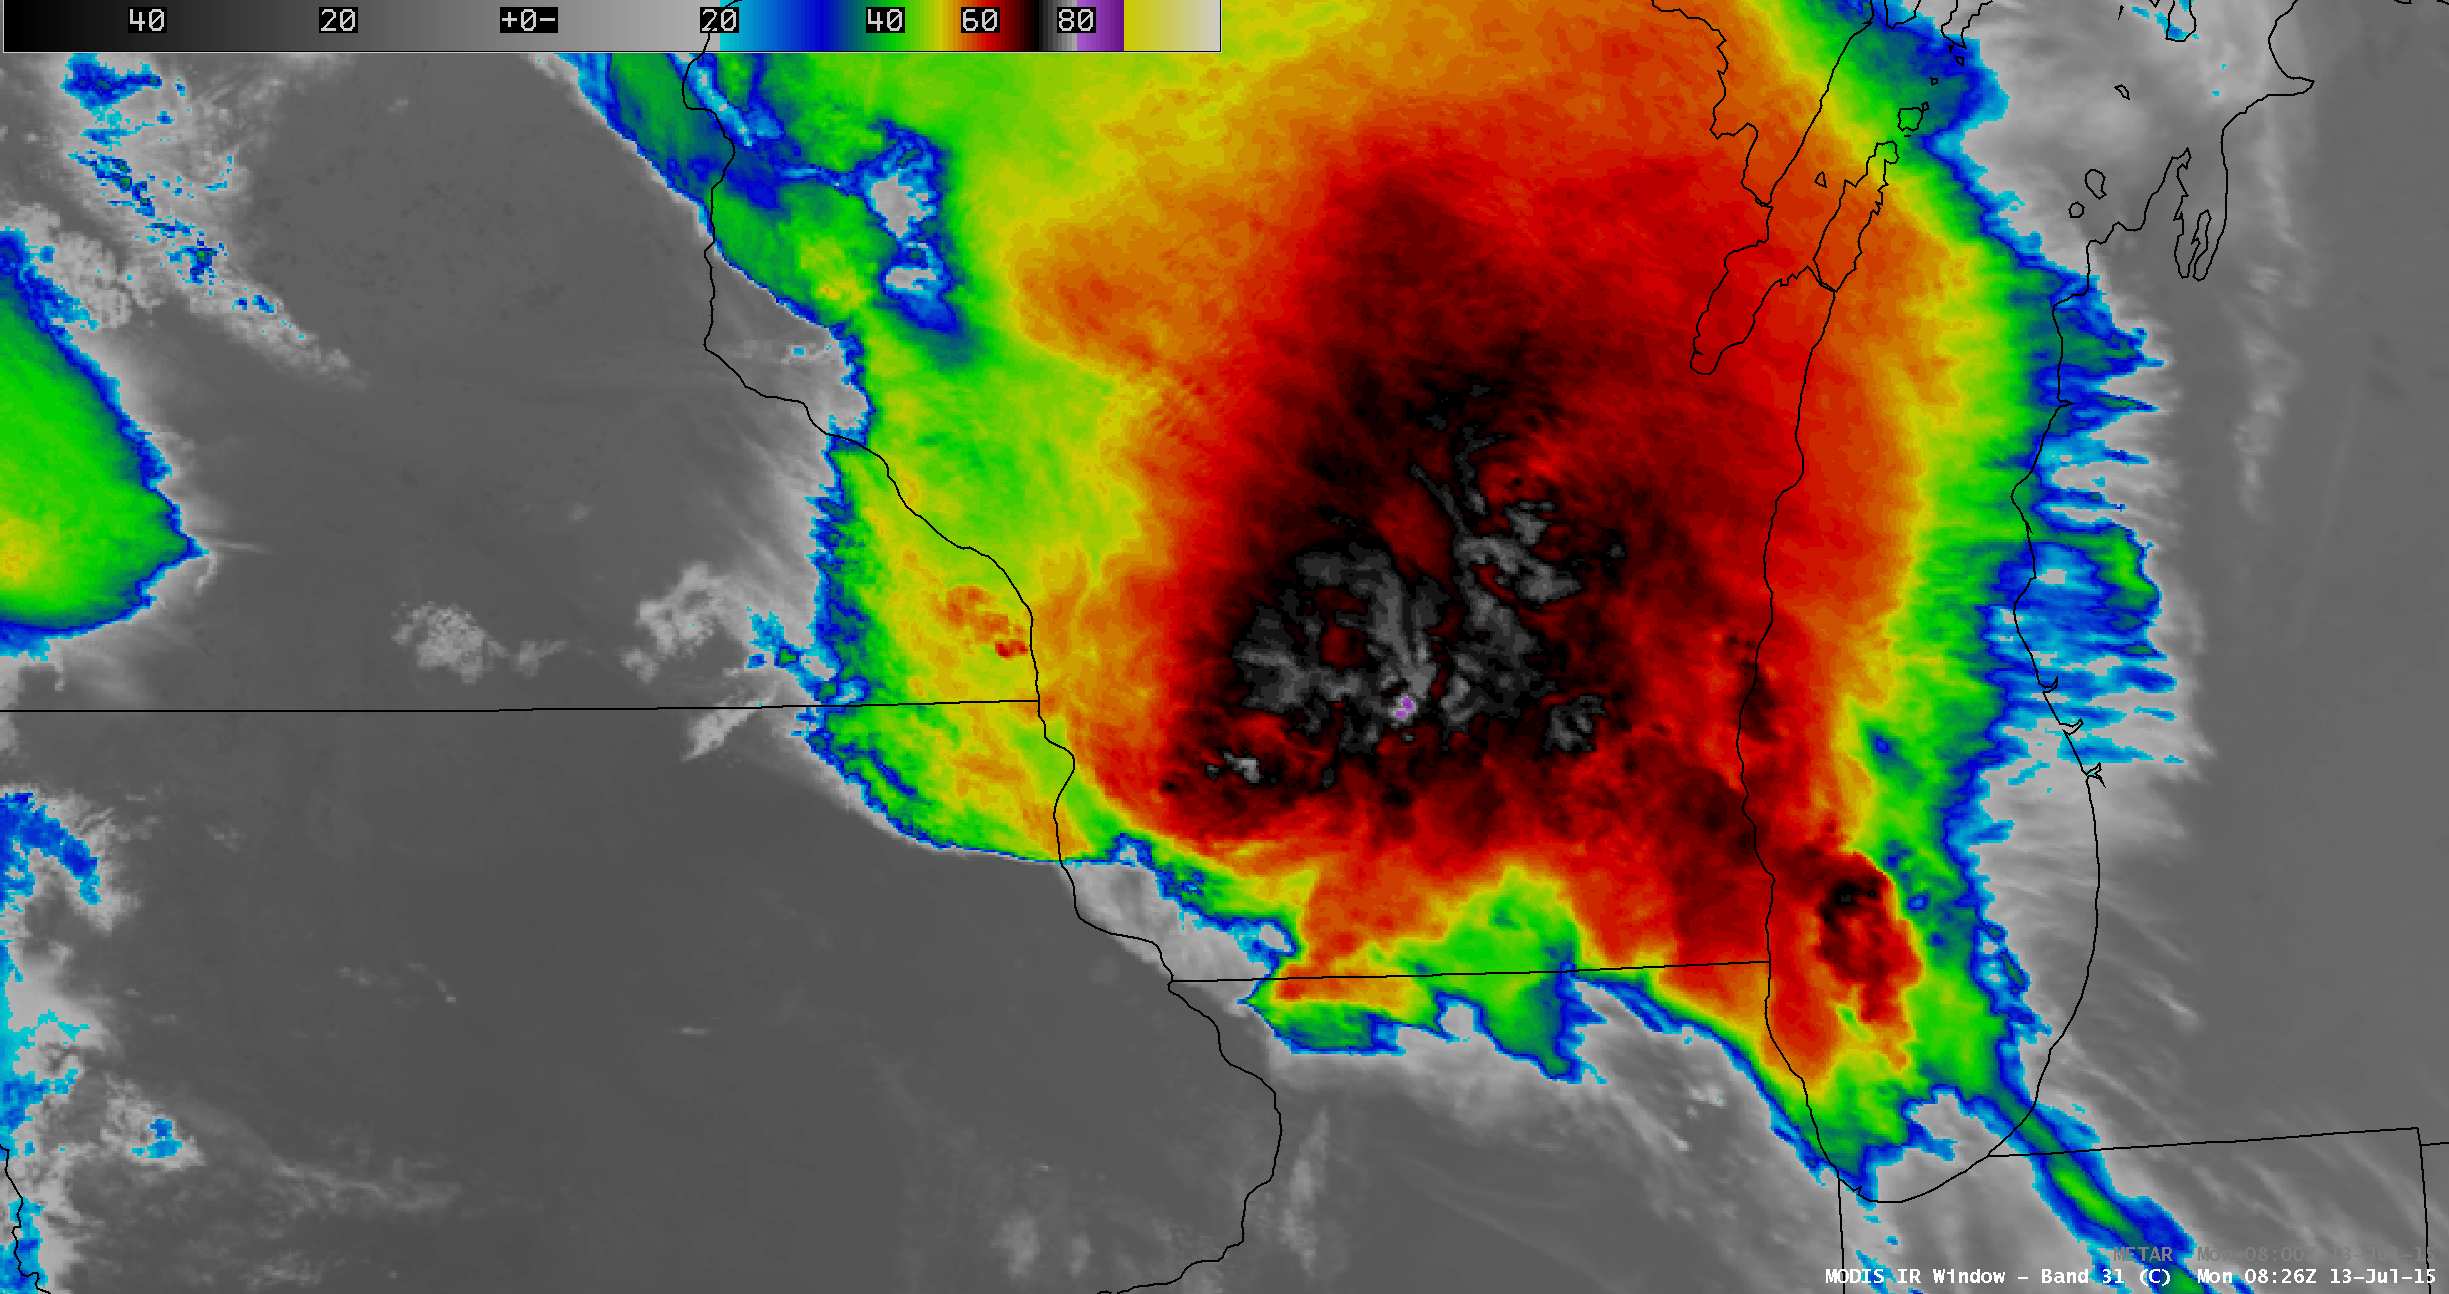
MODIS 11 µm infrared imagery and GOES Sounder DPI Lifted Index, 0400 UTC 13 July 2015 (click to enlarge)
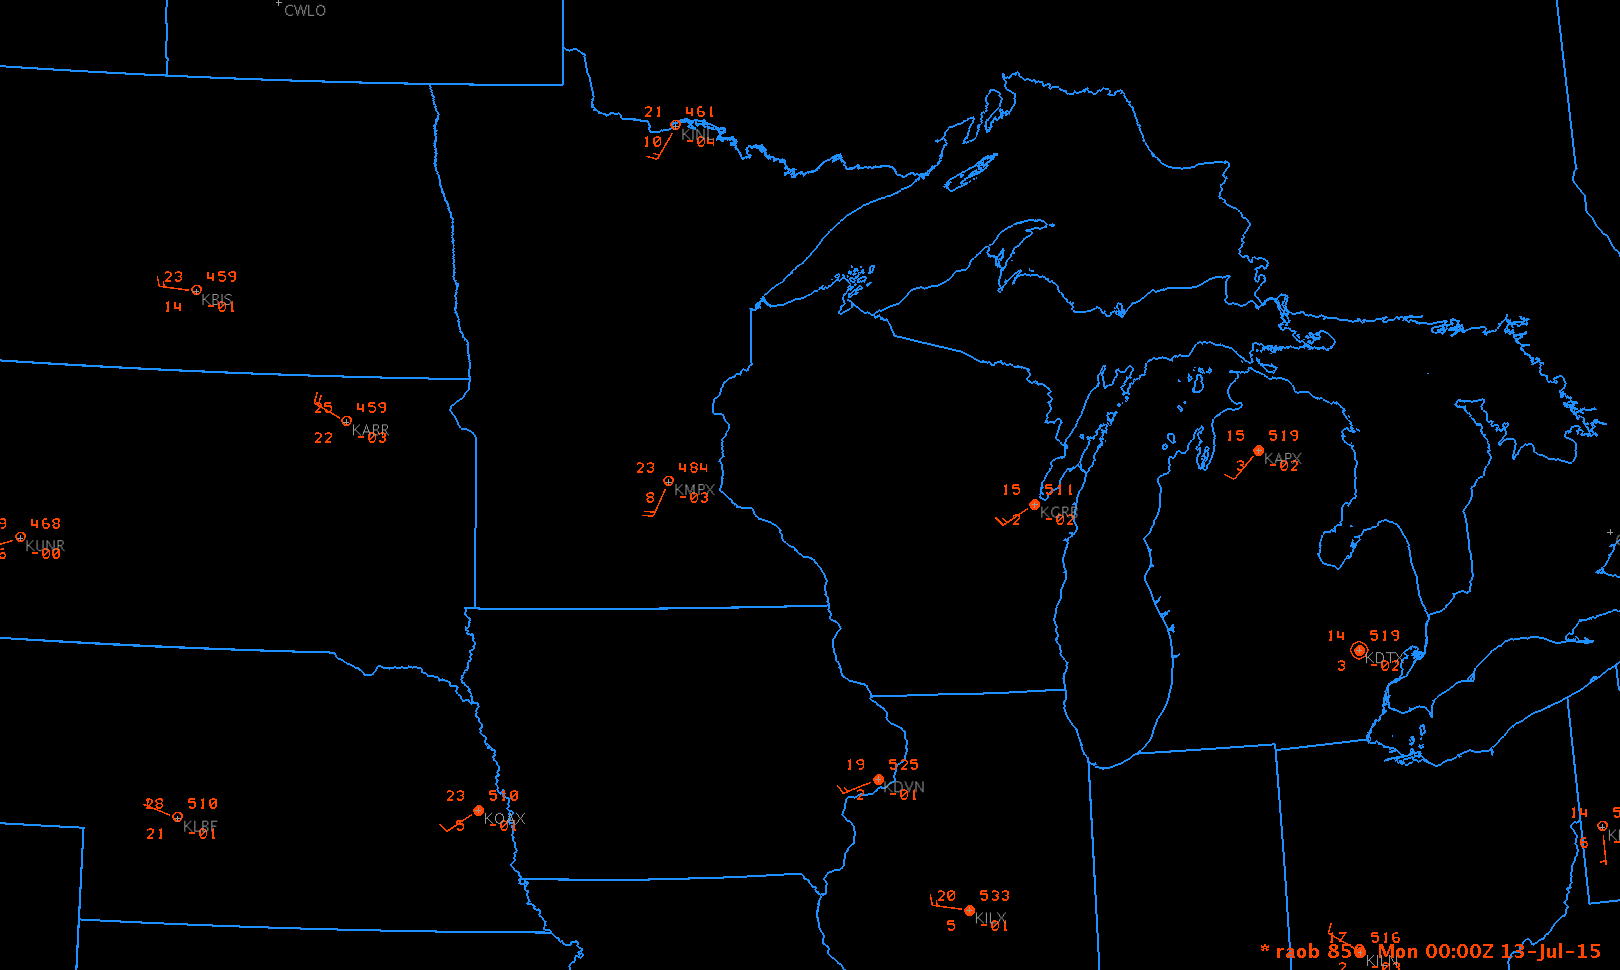
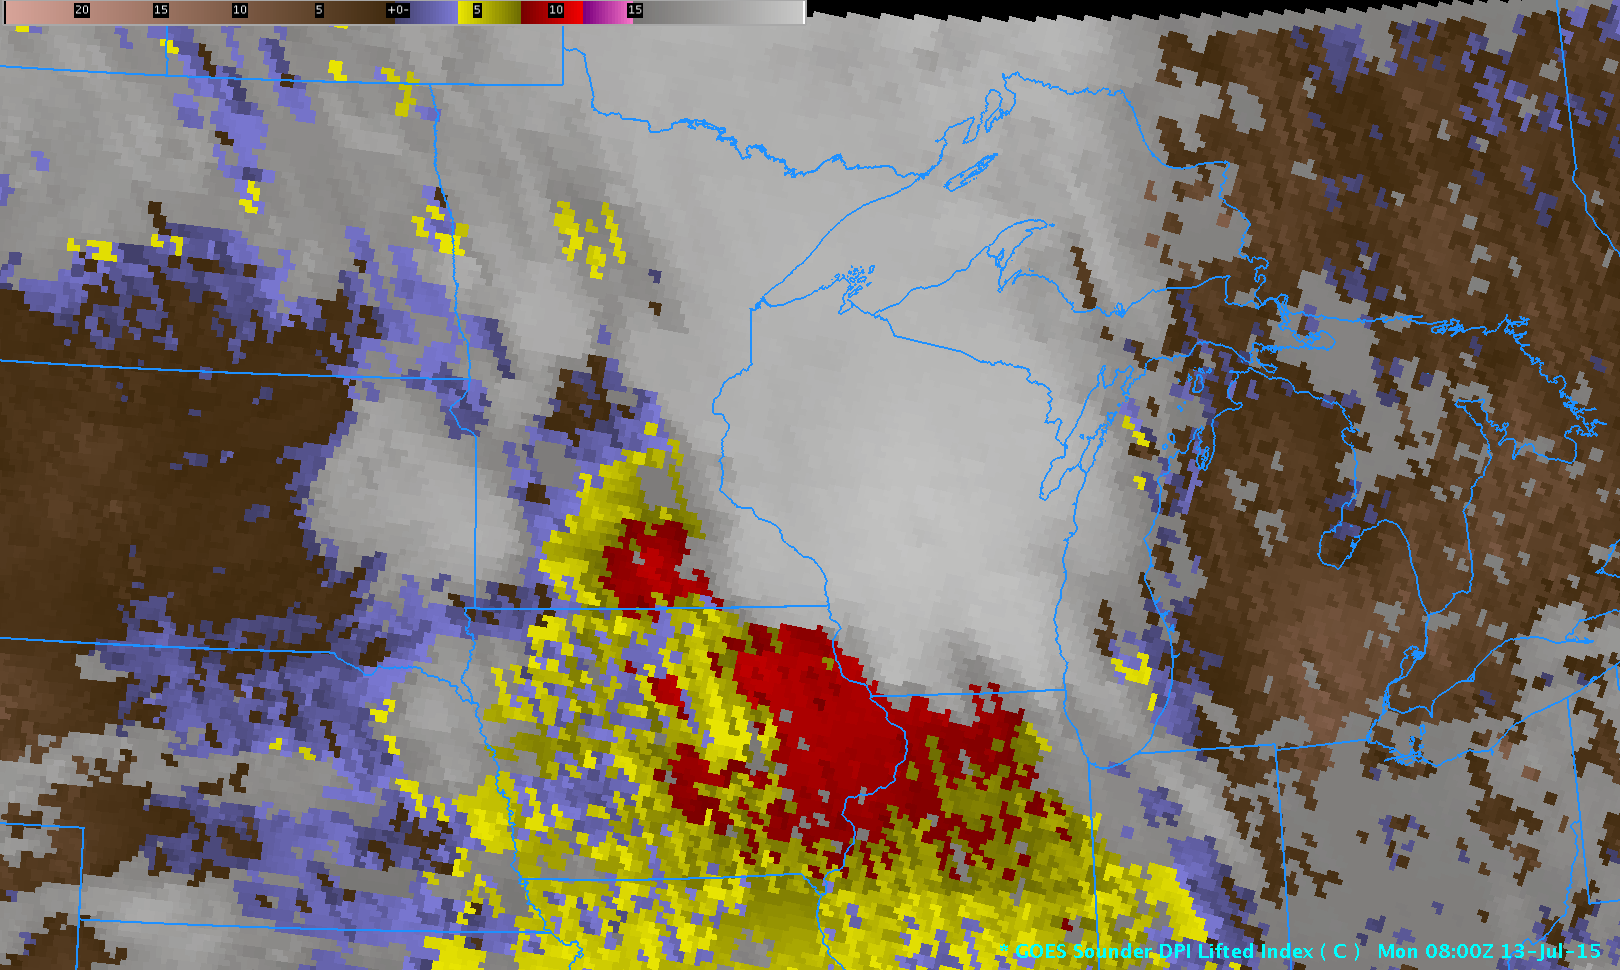
A strong mesoscale convective system (MCS) moving southeastward through the Upper Midwest from late 12 July 2015 into early morning 13 July caused numerous severe wind reports across Minnesota and Wisconsin. This MCS was forecast to drop southeastward and continue to produce severe weather during the day on 13 July 2015 (Storm Prediction Center outlook). The toggle above shows the 0420 UTC Terra MODIS 11.0 µm image and the 0400 UTC GOES-13 Sounder DPI Lifted Index product (which is available in realtime here). As the MCS moved over southern Wisconsin, the coldest cloud-top IR brightness temperature on the 0826 UTC MODIS 11.0 µm IR image was -85º C. The strong system continued to move southeastward as very unstable air as diagnosed by the Sounder fed into it (click here for 850-mb RAOB plots). The 0746 UTC Suomi NPP VIIRS 11.45 µm IR image, below, also toggled with a GOES-13 Sounder Lifted Index product, showed a similar story: very strong convection downwind of a source of strong instability. The GOES Sounder can also diagnose Convective Available Potential Energy (CAPE), with values from 5000-6000 J/kg seen over southern Minnesota and eastern Iowa.
Suomi NPP VIIRS 11.45 µm infrared imagery and GOES Sounder DPI Lifted Index, 0746/0800 UTC 13 July 2015 (click to enlarge)
The Suomi NPP VIIRS Day/Night Band, below, which is a source of visible imagery at night, depicted signatures of the active lightning that accompanied this system: numerous along-scan bright streaks over southern Wisconsin were caused by lightning illuminating the cloud as the VIIRS instruments scanned the cloud top. This toggle showed a comparison of Day/Night Band and 11.45 µm Infrared imagery.

Suomi NPP VIIRS Day/Night Band 0.70 µm visible imagery 0746 UTC 13 July 2015 (click to enlarge)
A closer view comparing the 0746 UTC VIIRS IR and Day/Night Band images, below, includes overlays of METAR reports and both 15-minute and 1-hour cloud-to-ground lightning strikes. The coldest VIIRS cloud-top IR brightness temperature was -78º C.
Suomi NPP VIIRS 11.45 µm IR and 0.7 µm Day/Night Band images, with overlays of METAR surface reports and cloud-to-ground lightning strikes (click to enlarge)
At 0805 UTC, the coldest CLAVR-x POES AVHRR Cloud Top Temperature value was -81º C, with maximum Cloud Top Height values of 15 km along the southwestern portion of the MCS.
POES AVHRR Cloud Top Temperature and Cloud Top Height products at 0805 UTC (click to enlarge)
This image of Radar Composites of the main line of storms was produced by Greg Carbin of SPC and was posted on Facebook on 13 July 2015.
View only this post Read Less
