Hail associated with a line of rapidly developing thunderstorms near the borders of Kansas, Nebraska and Colorado heavily damaged Delta Flight 1889 bound from Boston to Salt Lake City, forcing an emergency landing in Denver (media report). An excellent blog post on the radar presentation of the system is here. What... Read More
![GOES-13 Sounder Lifted Indices [click to play animation]](https://cimss.ssec.wisc.edu/satellite-blog/wp-content/uploads/sites/5/2015/08/GOESSounderDPI_LI_07August2015-10.png)
GOES-13 Sounder Lifted Indices [click to play animation]
Hail associated with a line of rapidly developing thunderstorms near the borders of Kansas, Nebraska and Colorado heavily damaged Delta Flight 1889 bound from Boston to Salt Lake City, forcing an emergency landing in Denver (
media report). An excellent blog post on the radar presentation of the system is
here. What did the satellite data show? GOES Sounder Derived Product Image (DPI) values of Lifted Index (LI), above, (realtime images available
here) showed instability over the High Plains of Colorado throughout the day. At
2000 UTC, for example, values greater than -8º C prevailed (subsequent cloud development prevented the retrieval of LI values using the Sounder). GOES Sounder DPI of Convective Available Potential Energy (CAPE), below, (realtime images available
here) also indicated strong destabilization during the late afternoon (1600, 1800 and 2000 UTC are shown in the animation). The 08 August/00 UTC
rawinsonde report from North Platte, Nebraska had LI and CAPE values of -5ºC and 1592 J/kg, respectively.
![GOES Sounder Convective Available Potential Energy (CAPE), 1600 - 2000 UTC 7 August 2015 [click to enlarge]](https://cimss.ssec.wisc.edu/satellite-blog/wp-content/uploads/sites/5/2015/08/GOESSounderCAPE.15219.1600.1800.2000toggle.gif)
GOES Sounder Convective Available Potential Energy (CAPE), 1600 – 2000 UTC 7 August 2015 [click to enlarge]
(from
here) also showed strong instability in between extensive cloud cover: the imagery at 1600 UTC on 7 August for CAPE and LI is shown below.
![GOES-13 LAP estimates of Lifted Index (LI) and Convective Available Potential Energy (CAPE), 1600 UTC 7 August 2015 [click to enlarge]](https://cimss.ssec.wisc.edu/satellite-blog/wp-content/uploads/sites/5/2015/08/LAPS_LI_CAPEGOESRP1_20150807_16Ztoggle.gif)
GOES-13 LAP estimates of Lifted Index (LI) and Convective Available Potential Energy (CAPE), 1600 UTC 7 August 2015 [click to enlarge]
Given the instability present, rapid thunderstorm development should not surprise (the region was under a
Severe Thunderstorm Watch, and a
Mesoscale Convective Discussion had been issued specifically mentioning the possibility of severe hail). The visible animation from GOES-13, below, from 1900 UTC on 7 August through 0145 UTC on 8 August, showed rapid convective growth, and the damaging convective cell is quite apparent growing northward over northwestern Kansas at the end of the animation.
![GOES-13 Visible imagery (0.63 µm) 1900 UTC 7 August - 0145 UTC 8 August [click to animate]](https://cimss.ssec.wisc.edu/satellite-blog/wp-content/uploads/sites/5/2015/08/GOES13_8August2015_0100.gif)
GOES-13 Visible imagery (0.63 µm) 1900 UTC 7 August – 0145 UTC 8 August [click to animate]
A slower animation of GOES-13 visible images from 0045-0130 UTC is shown below.
![GOES-13 Visible imagery (0.63 µm) 0045 UTC 8 August - 0130 UTC 8 August [click to animate]](https://cimss.ssec.wisc.edu/satellite-blog/wp-content/uploads/sites/5/2015/08/GOES13_8August2015_0045_0130anim.gif)
GOES-13 Visible imagery (0.63 µm) 0045 UTC 7 August – 0130 UTC 8 August [click to animate]
![GOES-15 Visible imagery (0.63 µm) 1900 UTC 7 August - 0145 UTC 8 August [click to animate]](https://cimss.ssec.wisc.edu/satellite-blog/wp-content/uploads/sites/5/2015/08/GOES15_8August2015_0100.gif)
GOES-15 Visible imagery (0.63 µm) 1900 UTC 7 August – 0145 UTC 8 August [click to animate]
GOES-15 also viewed the rapid development of convection. The animation from 1900 UTC on 7 August 2015 through 0145 UTC on 8 August is shown above; the animation from 0000 UTC through 0145 UTC is shown below. Convective development over northwest Kansas was racing northward.
![GOES-15 Visible imagery (0.62 µm) 1900 UTC 7 August - 0145 UTC 8 August [click to enlarge]](https://cimss.ssec.wisc.edu/satellite-blog/wp-content/uploads/sites/5/2015/08/GOES15_8August2015_0000_0145anim.gif)
GOES-15 Visible imagery (0.62 µm) 0000 UTC 8 August – 0145 UTC 8 August [click to enlarge]
GOES-13 Infrared (10.7 µm) brightness temperatures confirmed the quick growth of the convection. The animation below showed strong cooling starting around 0115 UTC in extreme northwest Kansas. Coldest brightness temperatures at 0100 UTC (200.2 K or -73ºC) dropped to 196.2 K (-77ºC) at 0115 UTC, then to 194.0 K (-79ºC) at 0130 UTC, 192.8 (-80.4ºC) at 0145 and 192.2 K (about -81ºC!) at 0200 UTC. The rocking animation at bottom testifies to how quickly the developing convection was able to close the gap in convection through which the aircraft was attempting to fly.
![GOES-13 Infrared imagery (10.7 µm) 0015 UTC 8 August - 0215 UTC 8 August [click to animate]](https://cimss.ssec.wisc.edu/satellite-blog/wp-content/uploads/sites/5/2015/08/GOES13_IR4_08AUGUST_0145.GIF)
GOES-13 Infrared imagery (10.7 µm) 0015 UTC 8 August – 0215 UTC 8 August [click to animate]
![Rocking animation of GOES-13 Infrared imagery (10.7 µm) 0015 UTC 8 August - 0215 UTC 8 August [click to enlarge]](https://cimss.ssec.wisc.edu/satellite-blog/wp-content/uploads/sites/5/2015/08/GOES13_IR4_08AUGUST_0015_0215rock.gif)
Rocking animation of GOES-13 Infrared imagery (10.7 µm) 0015 UTC 8 August – 0215 UTC 8 August [click to enlarge]
The side-by-side comparisons shown below of GOES-15 (left) and GOES-13 (right) 10.7 µm Infrared and 0.63 µm Visible images also help to demonstrate the value of more frequent images for monitoring the rapid development of such features. GOES-15 was in Rapid Scan Operations (RSO) mode, providing up to 10 images every hour (at :00, :11, :15, :22, :30, :41, :45, :52, :55, and :57), while GOES-13 was in Routine Scan mode, providing up to 4 images every hour (at :00, :15, :30. and :45). Unfortunately, there were 30-minute gaps in both GOES-15 (between 0030 and 0100 UTC) and GOES-13 (between 0015 and 0045 UTC) during the time that the new line of thunderstorms began to rapidly build northward across far northwestern Kansas, between the 2 pre-existing areas of thunderstorm activity.
![GOES-15 (left) and GOES-13 (right) 10.7 µm Infrared images [click to play animation]](https://cimss.ssec.wisc.edu/satellite-blog/wp-content/uploads/sites/5/2015/08/150807_G15_G13_IR4_DELTA1889_21.GIF)
GOES-15 (left) and GOES-13 (right) 10.7 µm Infrared images [click to play animation]
![GOES-15 (left) and GOES-13 (right) 0.63 µm Visible images [click to play animation]](https://cimss.ssec.wisc.edu/satellite-blog/wp-content/uploads/sites/5/2015/08/150807_G15_G13_VIS_DELTA1889_21.GIF)
GOES-15 (left) and GOES-13 (right) 0.63 µm Visible images [click to play animation]
In addition to the animated GIFs, MP4 versions of the Infrared and Visible images are available
here and
here.
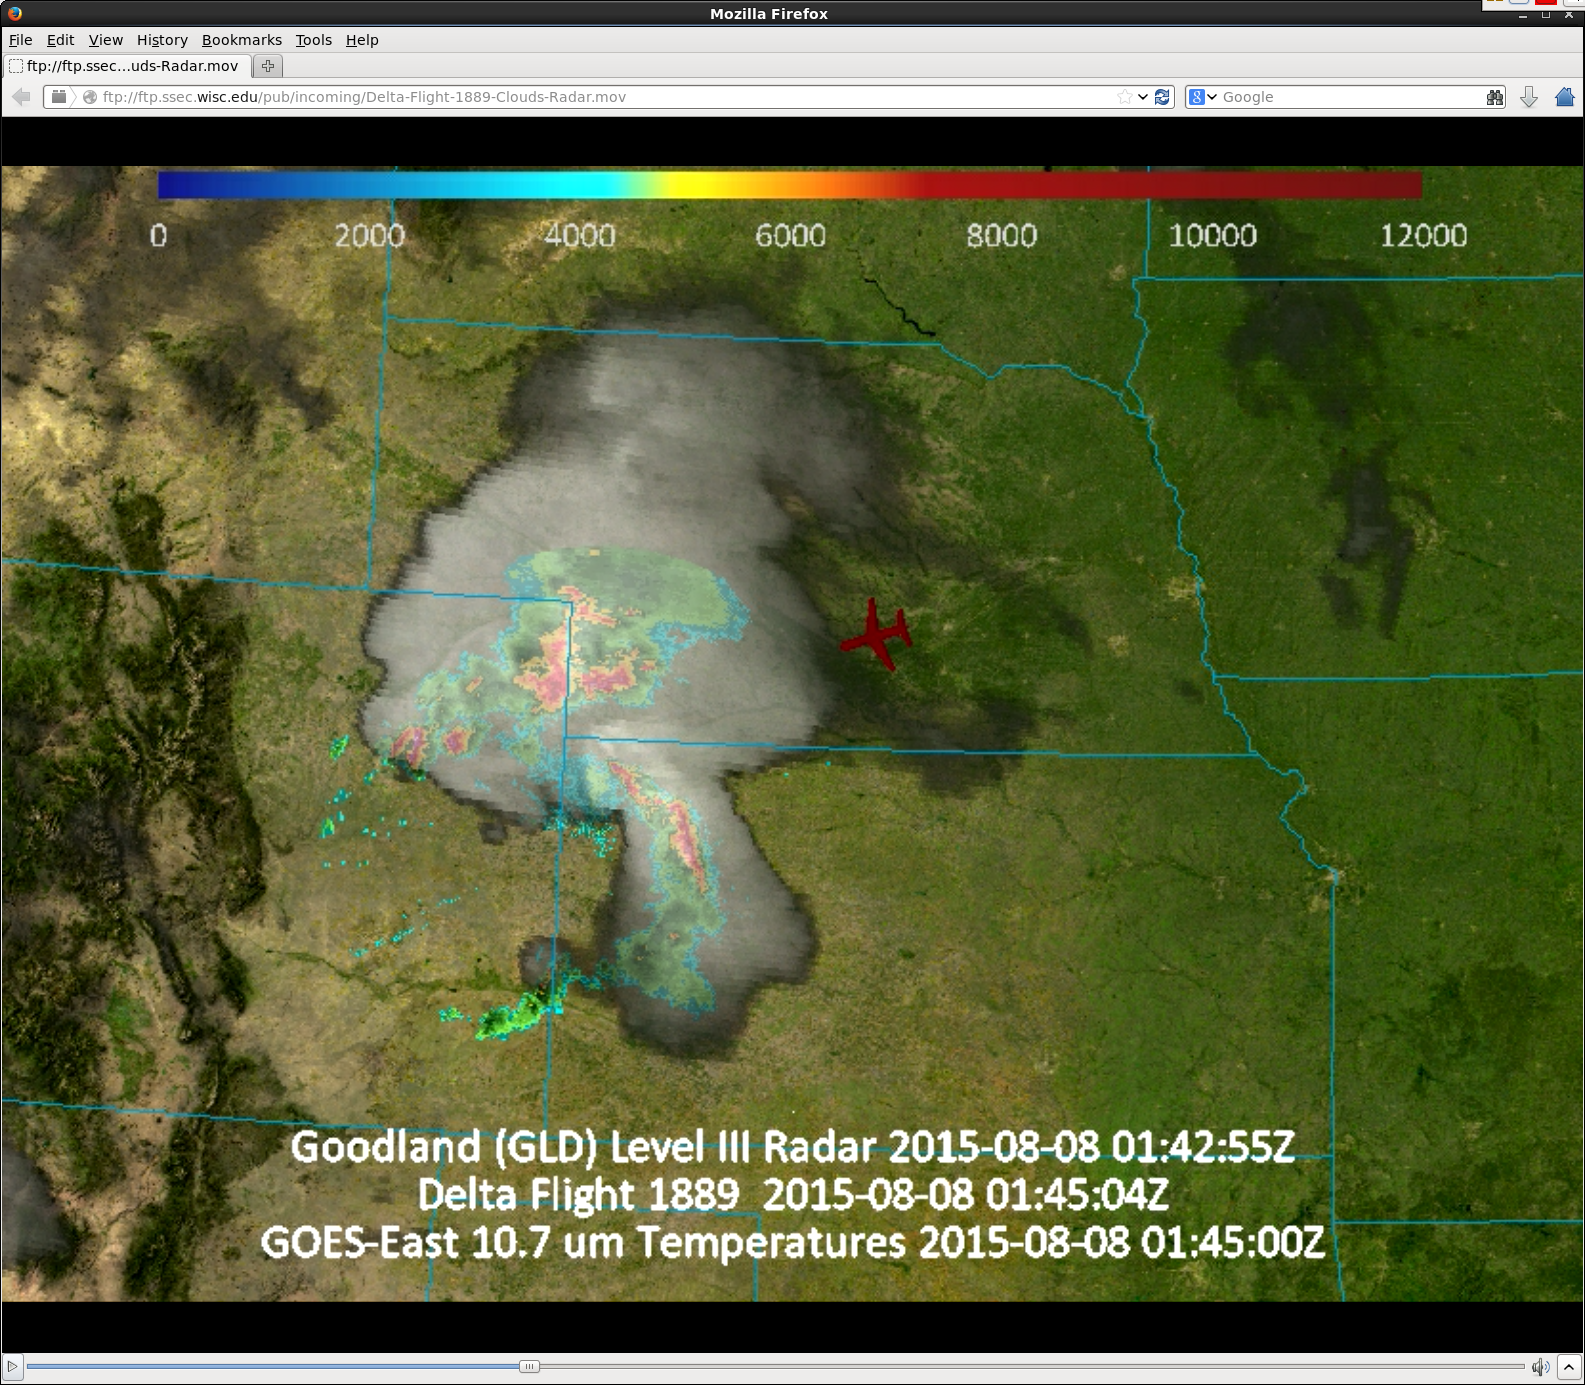
The flight positions of Delta 1889 are superimposed on a composite animation of GOES-13 Infrared (10.7 µm)and Goodland, Kansas radar reflectivity, below (courtesy of Rick Kohrs, SSEC).
![Delta Flight 1889 position, GOES-13 Infrared images, and Goodland, Kansas radar reflectivity [click to play QuickTime movie]](https://cimss.ssec.wisc.edu/satellite-blog/wp-content/uploads/sites/5/2015/08/Delta1889_goes13_ir_gld_radar.png)
Delta Flight 1889 position, GOES-13 Infrared images, and Goodland, Kansas radar reflectivity [click to play QuickTime movie]
View only this post
Read Less
![GOES-13 Sounder Lifted Indices [click to play animation]](https://cimss.ssec.wisc.edu/satellite-blog/wp-content/uploads/sites/5/2015/08/GOESSounderDPI_LI_07August201512z_08August201502zanim.gif)
![GOES-13 Visible imagery (0.63 µm) 1900 UTC 7 August - 0145 UTC 8 August [click to animate]](https://cimss.ssec.wisc.edu/satellite-blog/wp-content/uploads/sites/5/2015/08/GOES13_7August2015_1900_8August_0145anim.gif)
![GOES-15 Visible imagery (0.63 µm) 1900 UTC 7 August - 0145 UTC 8 August [click to animate]](https://cimss.ssec.wisc.edu/satellite-blog/wp-content/uploads/sites/5/2015/08/GOES15_7August2015_1900_8August_0145anim.gif)
![GOES-13 Infrared imagery (10.7 µm) 0015 UTC 8 August - 0215 UTC 8 August [click to animate]](https://cimss.ssec.wisc.edu/satellite-blog/wp-content/uploads/sites/5/2015/08/GOES13_IR4_08AUGUST_0015_0215anim.gif)
![GOES-15 (left) and GOES-13 (right) 10.7 µm Infrared images [click to play animation]](https://cimss.ssec.wisc.edu/satellite-blog/wp-content/uploads/sites/5/2015/08/150807_goes15_goes13_ir_Delta1889_anim.gif)
![GOES-15 (left) and GOES-13 (right) 0.63 µm Visible images [click to play animation]](https://cimss.ssec.wisc.edu/satellite-blog/wp-content/uploads/sites/5/2015/08/150807_goes15_goes13_visible_Delta1889_anim.gif)
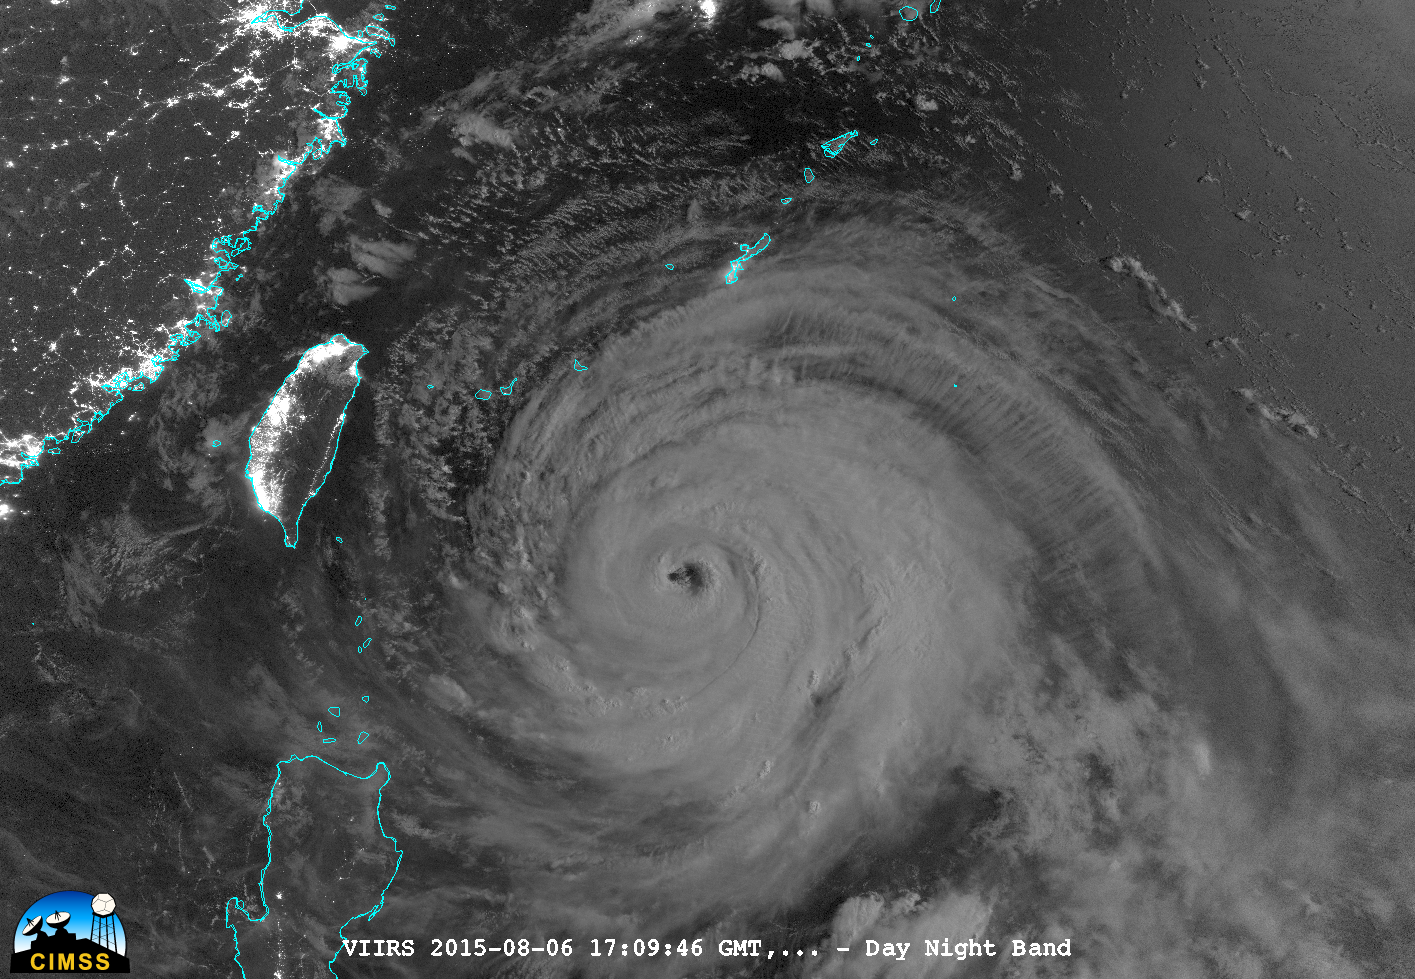


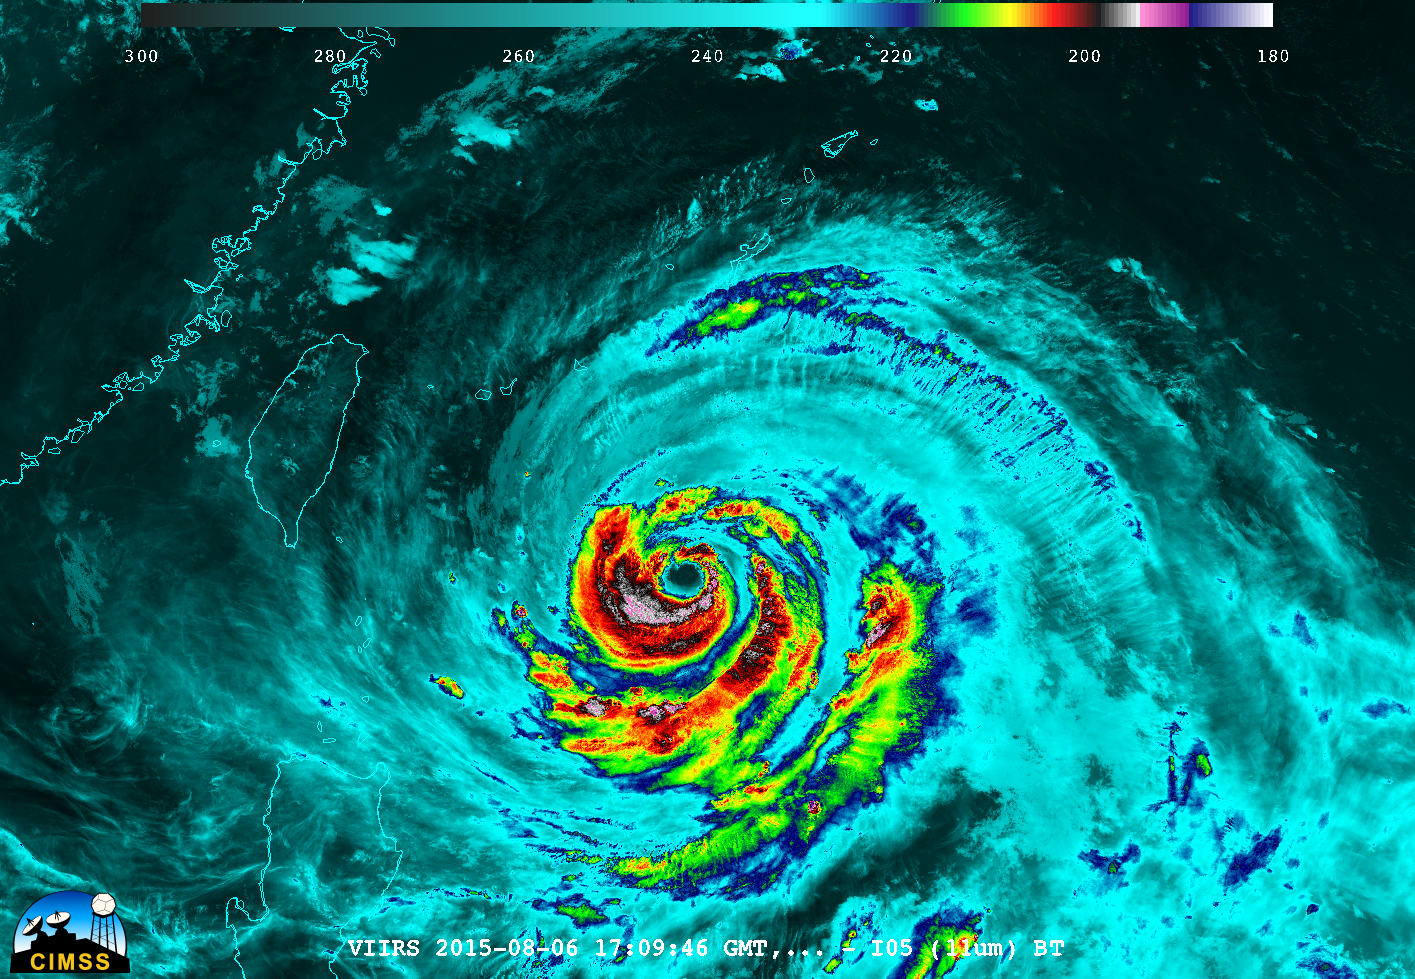
![Suomi NPP VIIRS Day/Night Band (0.7 µm) and Infrared (11.45 µm) images [click to enlarge]](https://cimss.ssec.wisc.edu/satellite-blog/wp-content/uploads/sites/5/2015/08/150807_1653utc_suomi_npp_viirs_dnb_ir_Typhoon_Soudelor_anim.gif)
![GOES-13 visible (0.63 µm) images [click to play animation]](https://cimss.ssec.wisc.edu/satellite-blog/wp-content/uploads/sites/5/2015/08/150807_goes13_visible_Hudson_Bay_ice_anim.gif)
![Terra MODIS true-color and false-color images [click to enlarge]](https://cimss.ssec.wisc.edu/satellite-blog/wp-content/uploads/sites/5/2015/08/150807_1611utc_terra_modis_truecolor_falsecolor_Hudson_Bay_ice_anim.gif)
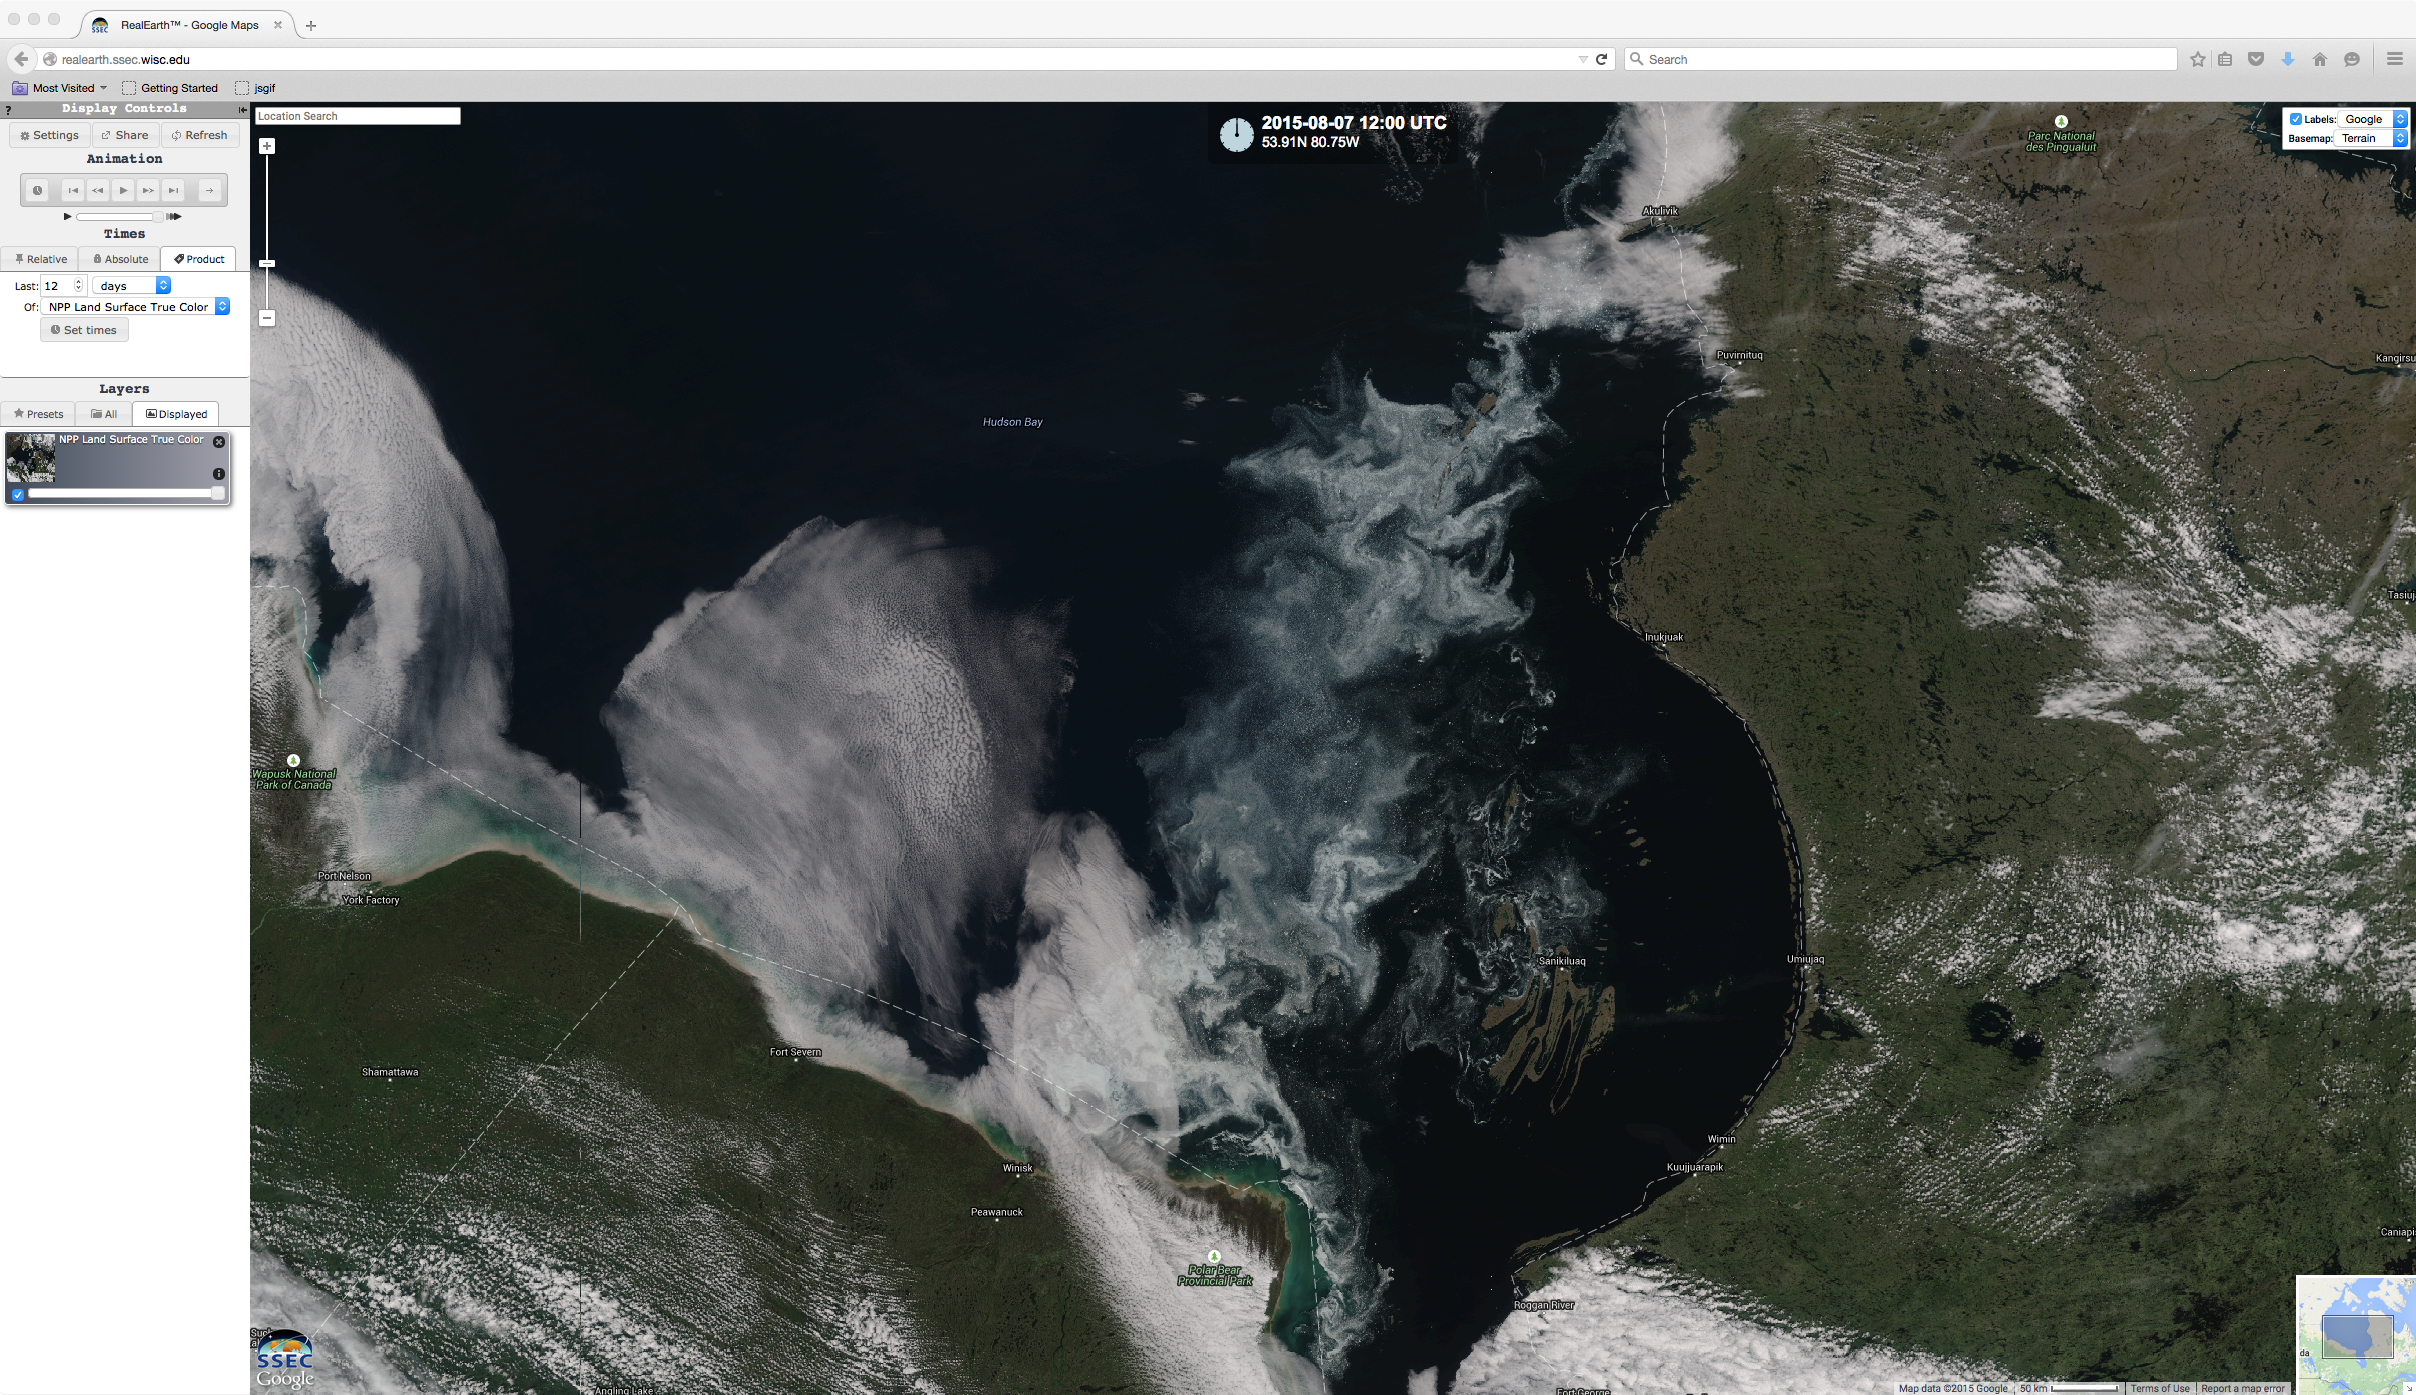
![Suomi NPP VIIRS true-color image [click to enlarge]](https://cimss.ssec.wisc.edu/satellite-blog/wp-content/uploads/sites/5/2015/08/150807_1800utc_suomi_npp_viirs_truecolor_Hudson_Bay_ice.jpg)
![Hudson Bay ice concentration [click to enlarge]](https://cimss.ssec.wisc.edu/satellite-blog/wp-content/uploads/sites/5/2015/08/150807_Hudson_Bay_ice_concentration.gif)
![Hudson Bay ice stage [click to enlarge]](https://cimss.ssec.wisc.edu/satellite-blog/wp-content/uploads/sites/5/2015/08/150807_Hudson_Bay_ice_stage.gif)
![Hudson Bay ice concentration departure from normal [click to enlarge]](https://cimss.ssec.wisc.edu/satellite-blog/wp-content/uploads/sites/5/2015/08/150803_Hudson_Bay_departure_from_normal_ice_concentration.gif)


