GOES-14 is again in SRSO-R (Super Rapid Scan Operations for GOES-R) mode, affording the opportunity for 1-minute imagery over select regions of the United States. Information on the daily activity is available here; SRSO-R will continue through 21 August and serves as a reminder of the kind of routine scanning... Read More
![GOES-14 Visible (0.62 µm) Imagery [click to play animation]](https://cimss.ssec.wisc.edu/satellite-blog/wp-content/uploads/sites/5/2015/08/960x1280_AGOES14_B1_GOES14_1_2015222_111500.GIF)
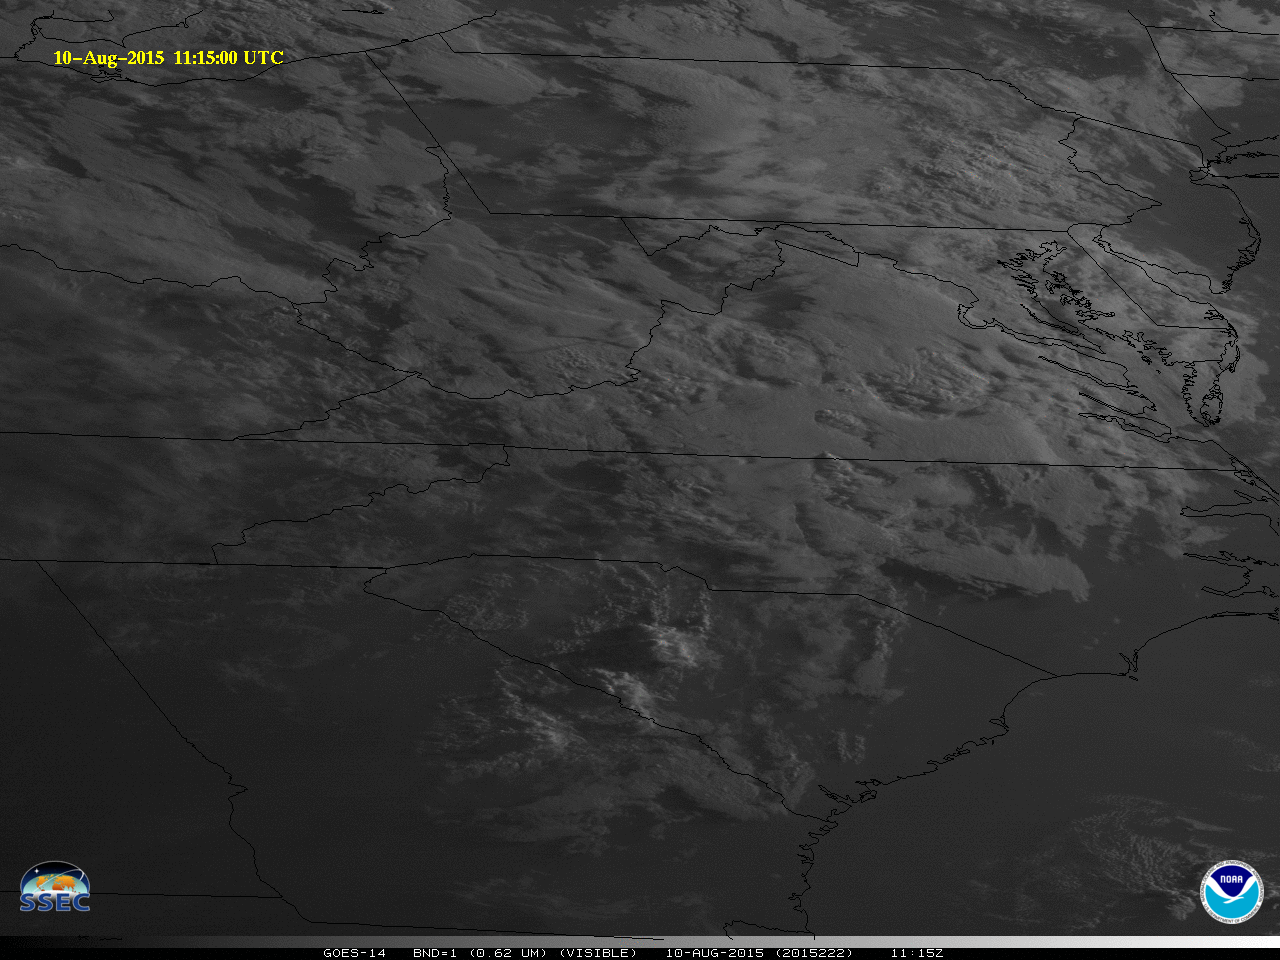
GOES-14 Visible (0.62 µm) Imagery [click to play animation]
GOES-14 is again in SRSO-R (
Super
Rapid
Scan
Operations for GOES-
R) mode, affording the opportunity for 1-minute imagery over select regions of the United States. Information on the daily activity is available
here; SRSO-R will continue through 21 August and serves as a reminder of the kind of routine scanning abilities that will be available when GOES-R is operational.
The images above, from the morning of 10 August, show a variety of features (thunderstorms over the Piedmont of South Carolina, North Carolina and Virginia, wave clouds over the high terrain of North Carolina, river valley fog in northern West Virginia and western Pennsylvania, fog in southern Vermont, etc.). High temporal resolution allows a better understanding of the cloud behavior.
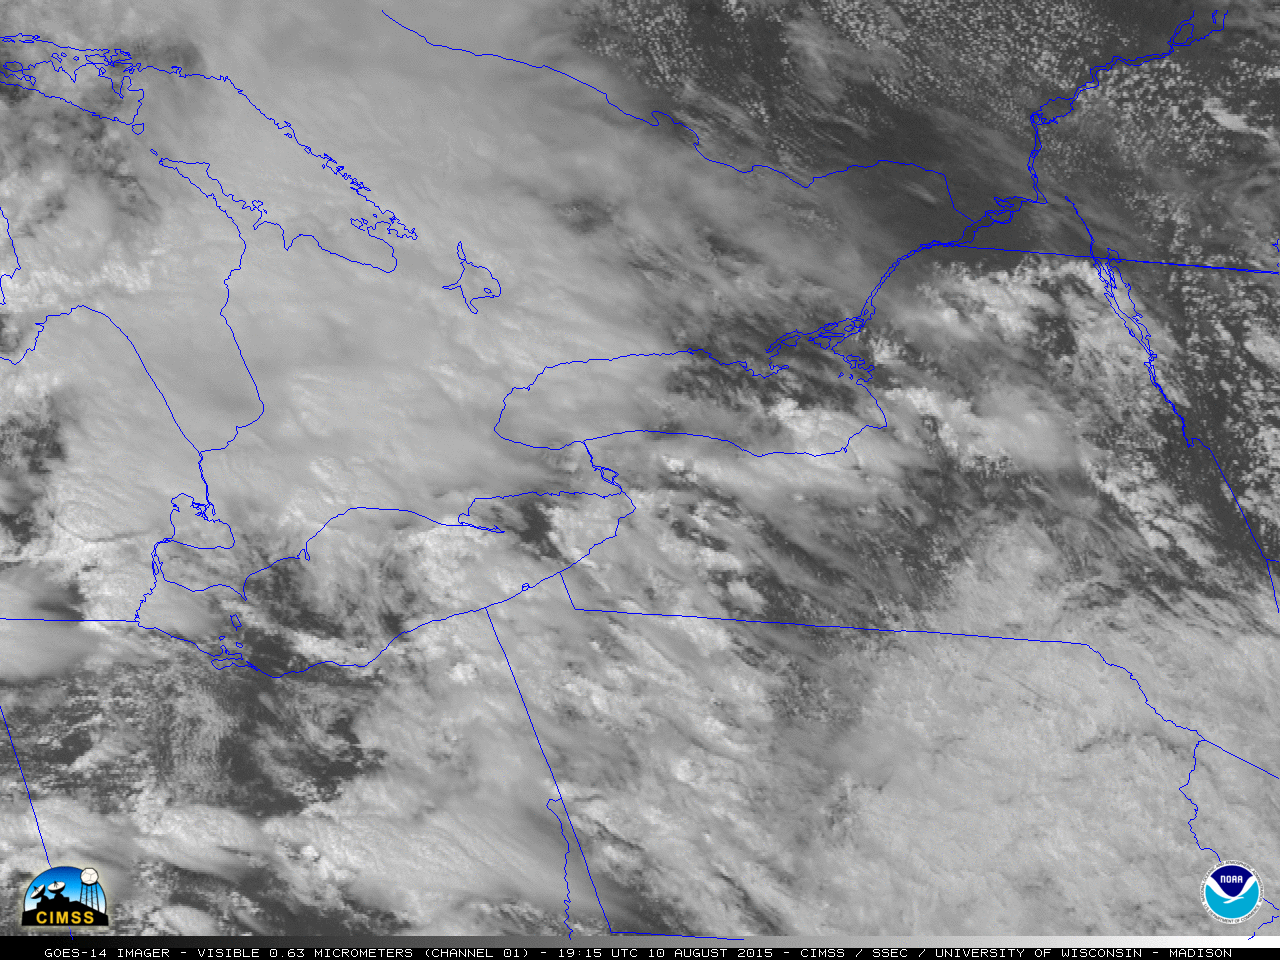
As solar heating increased toward mid-day and the atmosphere became more unstable, clusters of convection developed over parts of the Great Lakes region as seen in the MP4 animation below. One of the thunderstorms (which developed in eastern Wisconsin ahead of an approaching cold front) produced 1.75-inch diameter hail, and a brief EF0 tornado (SPC storm reports); not far to the south, a thunderstorm wind gust of 44 mph and 1.10 inches of rainfall in 30 minutes occurred at Milwaukee International Airport (Local Storm Reports). The MP4 movie file is also available as a very large (197 Mbyte) animated GIF.
![GOES-14 Visible (0.63 um) images [click to play animation]](https://cimss.ssec.wisc.edu/satellite-blog/wp-content/uploads/sites/5/2015/08/960x1280_GOES14_B1_GTLKS_TRW_2015222_185900.GIF)
GOES-14 Visible (0.63 um) images [click to play animation]
Over the Southeast US, widespread damaging wind reports resulted from strong thunderstorms forming ahead of a Mesoscale Convective Vortex that was moving southeastward across the Tennessee River Valley region (
SPC Mesoscale Discussion). The GOES-14 visible images below vividly displayed the complex nature of the convection associated with this feature. The MP4 movie file is also available as a very large (87 Mbyte)
animated GIF.
![GOES-14 Visible (0.63 µm) images [click to play animation]](https://cimss.ssec.wisc.edu/satellite-blog/wp-content/uploads/sites/5/2015/08/960x1280_GOES14_B1_TVA_TRW_2015222_200000.GIF)
GOES-14 Visible (0.63 µm) images [click to play animation]
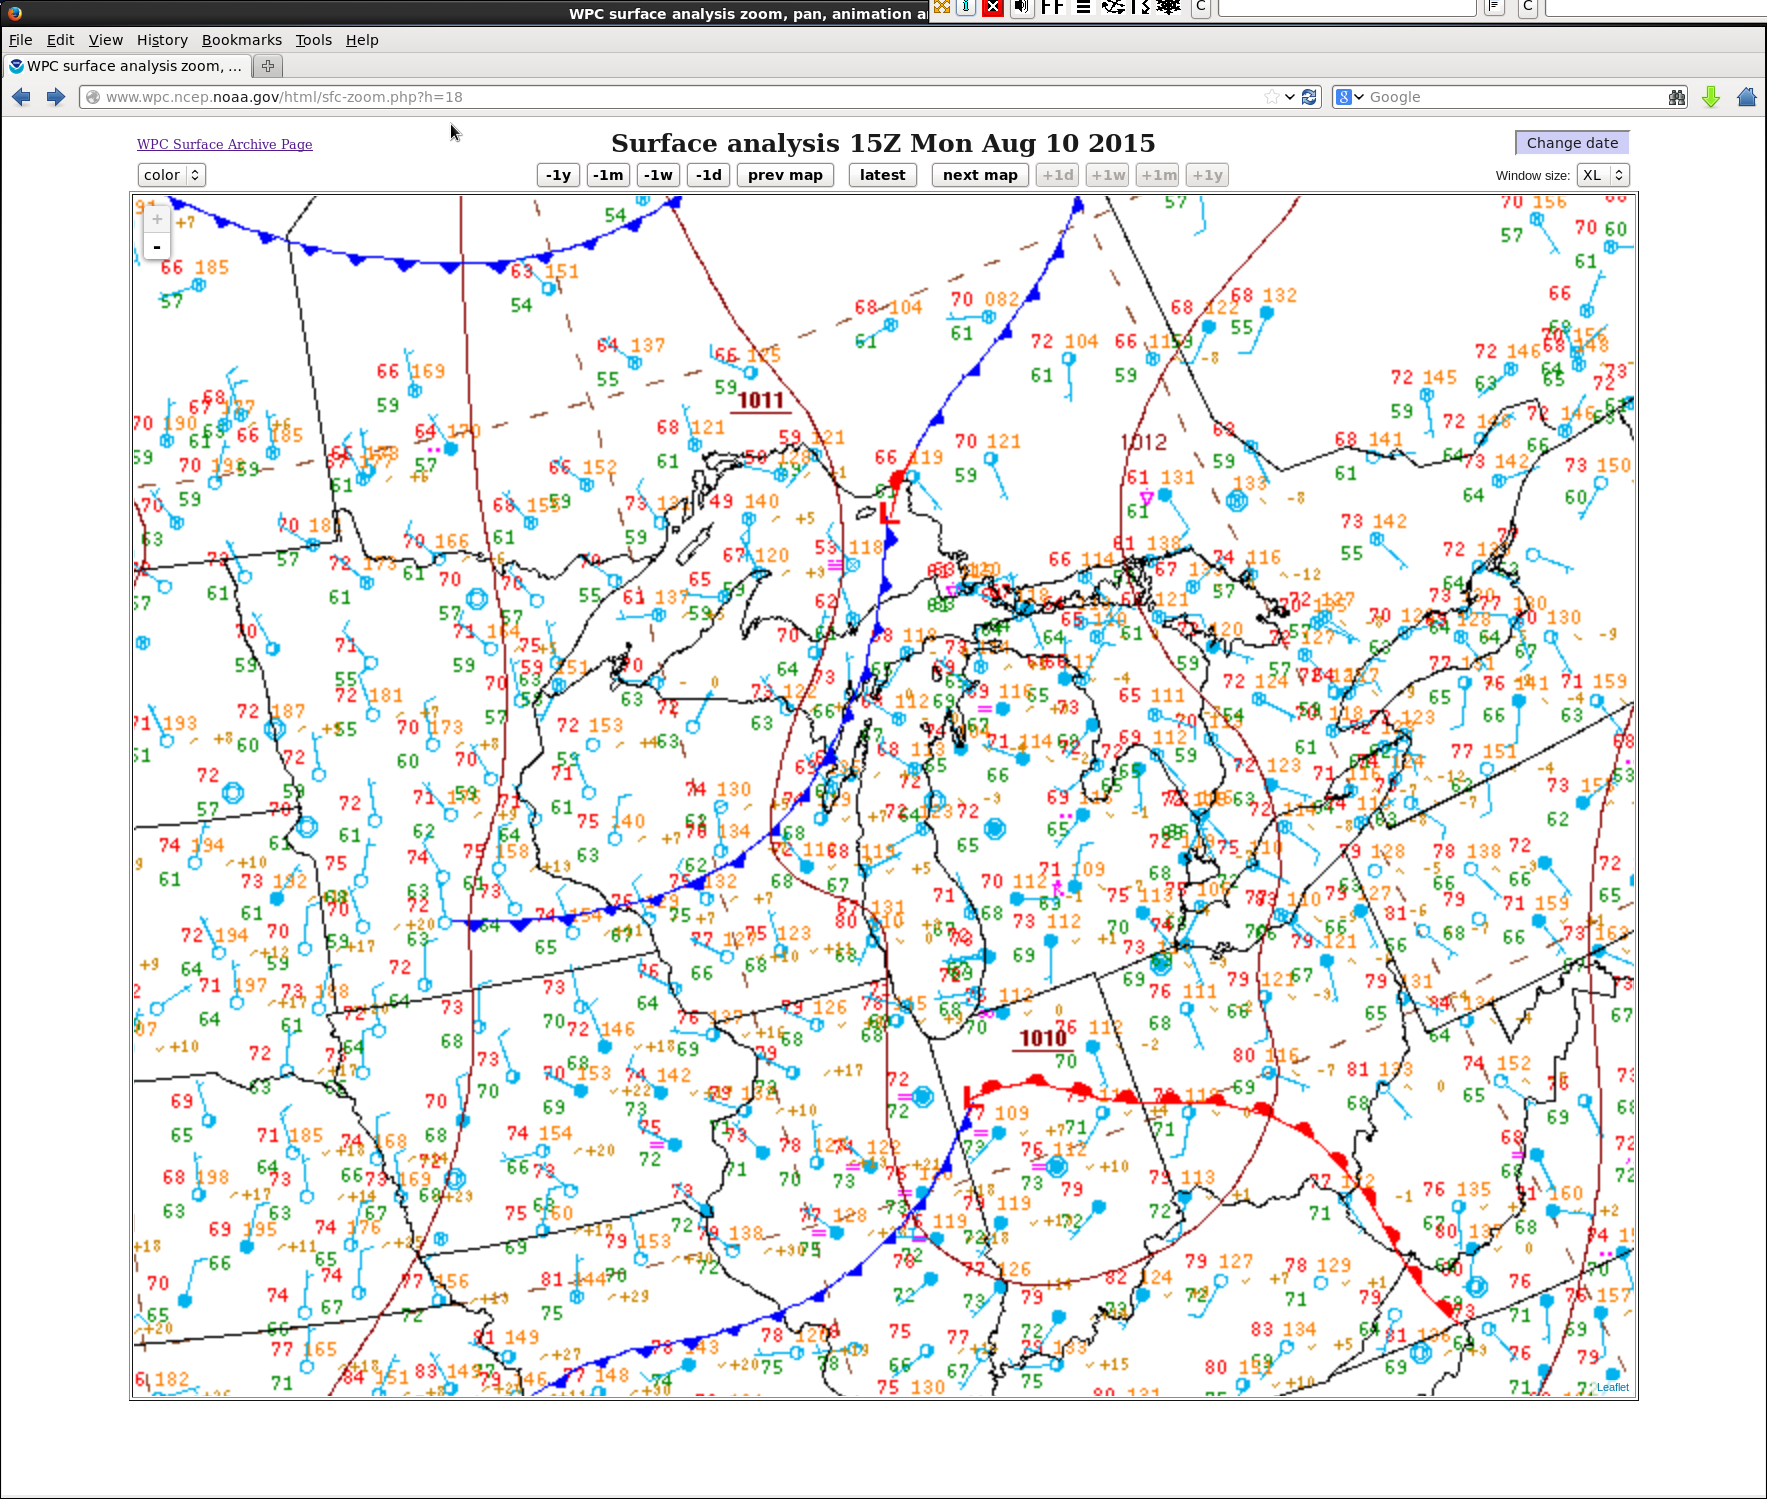
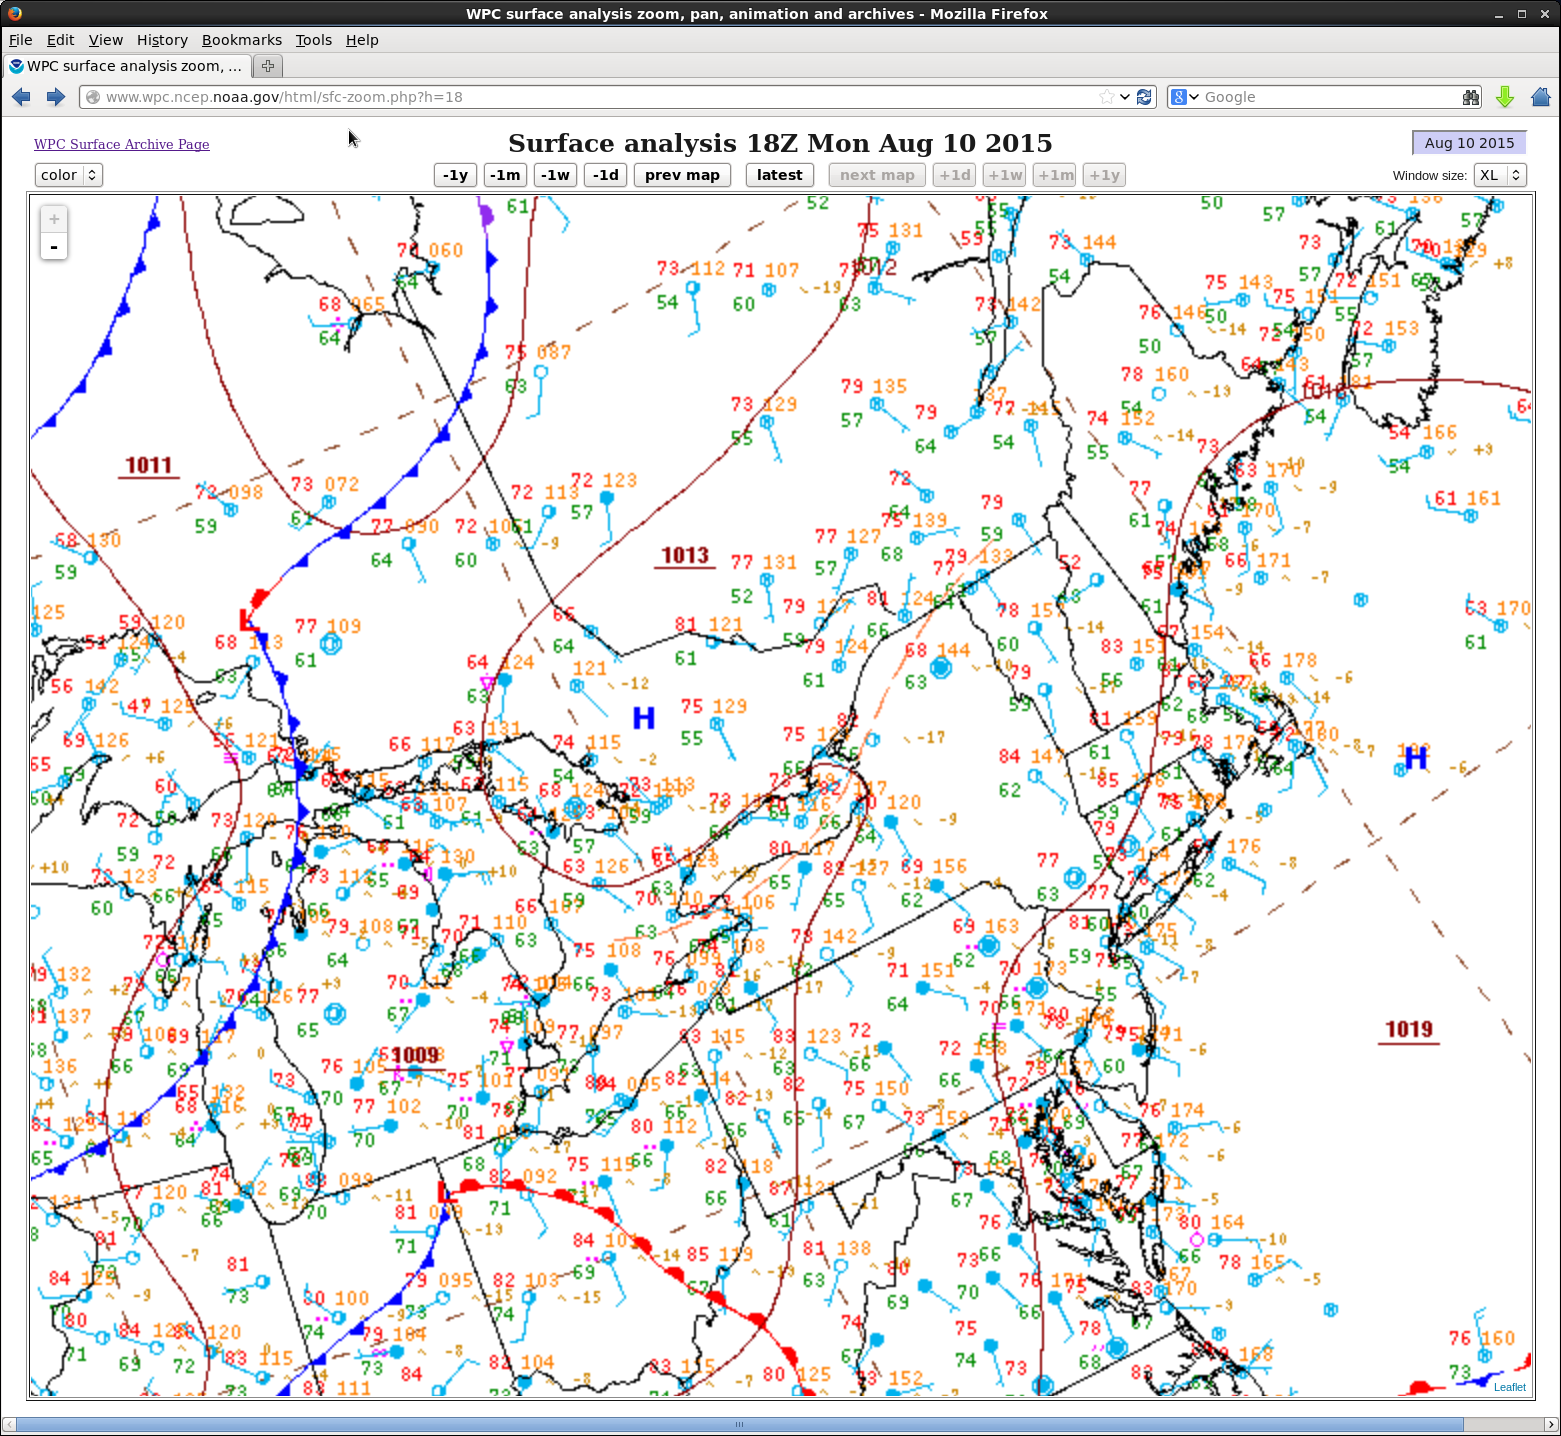
In the Northeast US, the GOES-14 visible images below showed convective development which was being aided by boundary layer convergence along a weak trough axis (
surface analysis). 1.00-inch diameter hail was reported at Franklin in Upstate New York at 2035 UTC, and damaging winds were reported in Victor, New York at 2002 UTC and then again in Lyons, New York at 2129 UTC. The MP4 movie file is also available as a very large (59 Mbyte)
animated GIF.
![GOES-14 Visible (0.63 µm) images [click to play animation]](https://cimss.ssec.wisc.edu/satellite-blog/wp-content/uploads/sites/5/2015/08/960x1280_GOES14_B1_NY_TRW_2015222_203500.GIF)
GOES-14 Visible (0.63 µm) images [click to play animation]
To access realtime GOES-14 1-minute data directly, click
here or
here.
One of the things SRSO-R supports is the 2015 Summer Experiment at the Aviation Weather Center. For more information on that experiment, click here.
View only this post
Read Less
![Himawari-8 (3.9 µm, top), MTSAT-2 (3.75 µm, middle) and COMS-1 (3.75 µm, bottom) shortwave infrared imagery, times as indicated [click to animate]](https://cimss.ssec.wisc.edu/satellite-blog/wp-content/uploads/sites/5/2015/08/HIMAWARI3PAN_NOMAP_12AUGUST2015_1500_1900anim.gif)
![Himawari-8 1.6 µm near-Infrared Imagery, times as indicated [click to enlarge]](https://cimss.ssec.wisc.edu/satellite-blog/wp-content/uploads/sites/5/2015/08/China_explosion_B05.gif)
![Himawari-8 1.6 µm near-Infrared Imagery, times as indicated [click to animate]](https://cimss.ssec.wisc.edu/satellite-blog/wp-content/uploads/sites/5/2015/08/China_explosion_B06.gif)
![Himawari-8 shortwave IR (3.9 um) images, displayed using RealEarth [click to enlarge]](https://cimss.ssec.wisc.edu/satellite-blog/wp-content/uploads/sites/5/2015/08/150812_himawari8_shortwaveIR_Tianjin_China_explosion_RealEarth_anim.gif)
![Suomi NPP VIIRS Day/Night Band (0.70 um) visible images on 9 August (before explosion) and 13 August (after explosion) [click to enlarge]](https://cimss.ssec.wisc.edu/satellite-blog/wp-content/uploads/sites/5/2015/08/150809-150813_suomi_npp_viirs_dnb_Tianjin_explosion_power_outages_anim.gif)
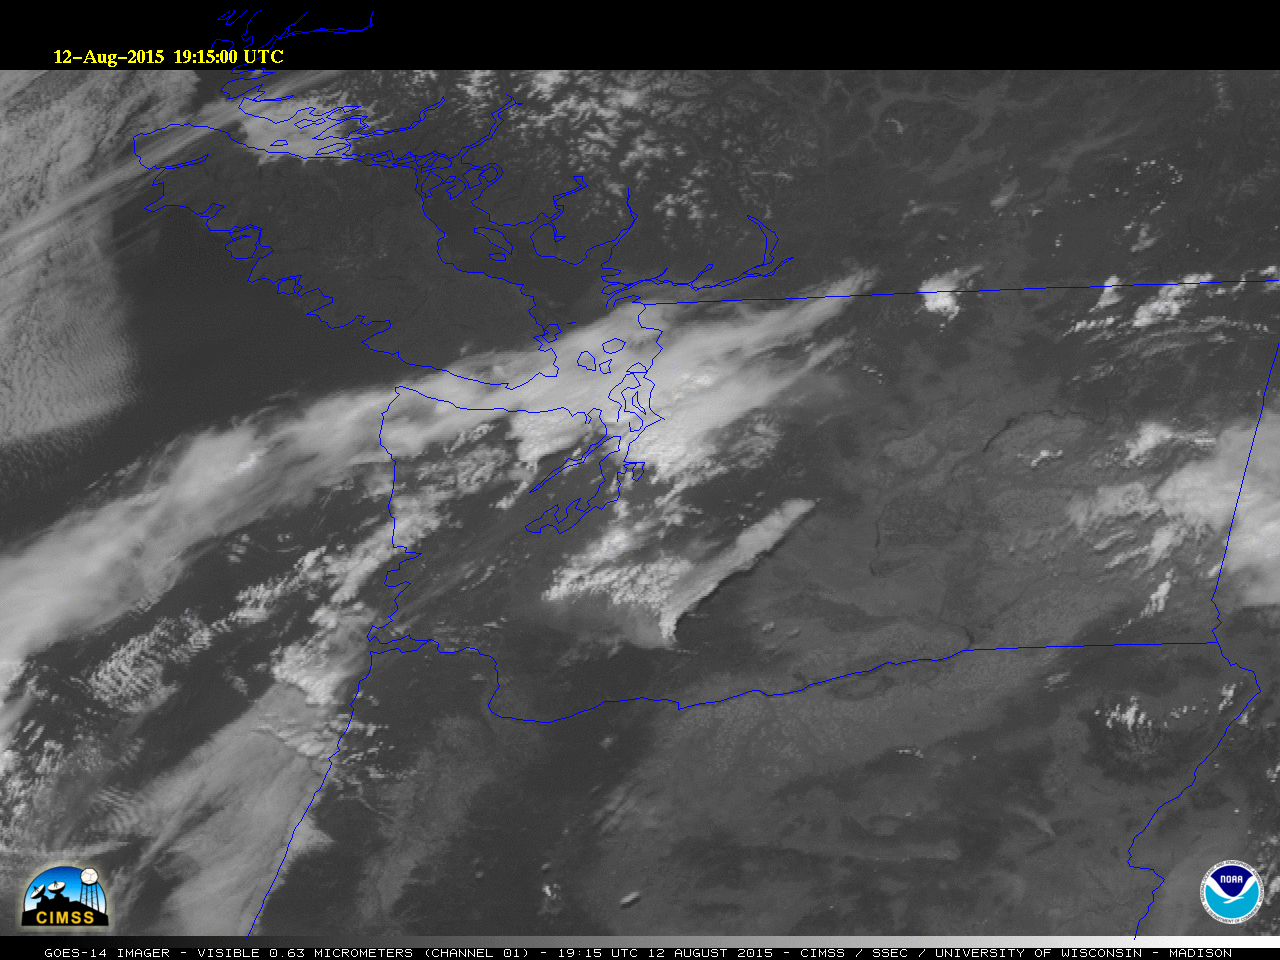
![GOES-14 visible (0.63 µm) images [click to play MP4 animation]](https://cimss.ssec.wisc.edu/satellite-blog/wp-content/uploads/sites/5/2015/08/960x1280_GOES14_B1_WA_FIRE_VIS_2015224_191500.GIF)
![Suomi NPP VIIRS shortwave Infrared (3.74 µm), Day/Night Band (0.8 µm), and Infrared (11.45 µm) images [click to enlarge]](https://cimss.ssec.wisc.edu/satellite-blog/wp-content/uploads/sites/5/2015/08/150812_1003utc_suomi_npp_viirs_swir_dnb_ir_WA_fire_anim.gif)
![GOES-13 Infrared (10.7 µm) and Suomi NPP VIIRS Infrared (11.45 µm) images [click to enlarge]](https://cimss.ssec.wisc.edu/satellite-blog/wp-content/uploads/sites/5/2015/08/150811_0845utc_goes13_viirs_ir_AR_LA_MS_mcs_anim.gif)
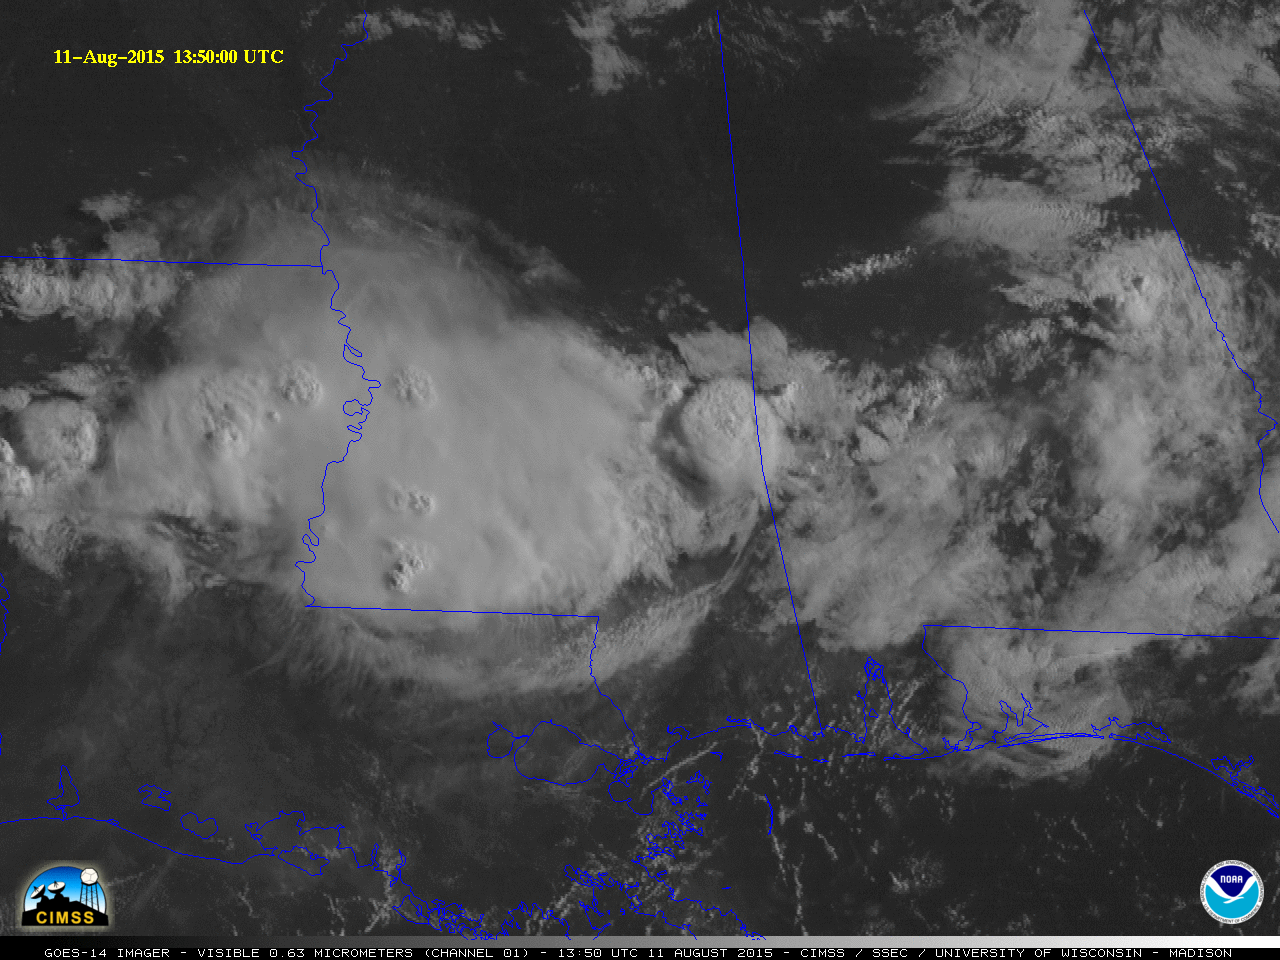
![GOES-14 visible (0.63 µm) images [click to play MP4 animation]](https://cimss.ssec.wisc.edu/satellite-blog/wp-content/uploads/sites/5/2015/08/960x1280_GOES14_B1_MS_TRW_2015223_135000.GIF)
![GOES-14 visible (0.63 µm) images [click to play MP4 animation]](https://cimss.ssec.wisc.edu/satellite-blog/wp-content/uploads/sites/5/2015/08/960x1280_GOES14_B1_VA_TRW_2015223_193000.GIF)
![GOES-14 Visible (0.62 µm) Imagery [click to play animation]](https://cimss.ssec.wisc.edu/satellite-blog/wp-content/uploads/sites/5/2015/08/960x1280_AGOES14_B1_GOES14_1_animated_2015222_111500_182_2015222_123000_182_GRAYa.gif)
