A strong tornado (rated a high-end EF-2) touched down near Pierson, Manitoba at around 0130 UTC on 28 July or 8:30 pm local time on 27 July (Press Report) and persisted until about 0355 UTC or 10:55 pm local time (near Virden Manitoba). The animation above shows GOES-15 (left) and GOES-13 (right) Infrared imagery... Read More
![Color-enhanced Infrared (10.7 µm) imagery from GOES-15 (left) and GOES-13 (right), times as indicated [click to play animation]](https://cimss.ssec.wisc.edu/satellite-blog/wp-content/uploads/sites/5/2015/07/GOES13GOES15_28July_0245.GIF)
Color-enhanced Infrared (10.7 µm) imagery from GOES-15 (left) and GOES-13 (right), times as indicated [click to play animation]
A strong tornado (rated a
high-end EF-2) touched down near
Pierson, Manitoba at around 0130 UTC on 28 July or 8:30 pm local time on 27 July (
Press Report) and persisted until about 0355 UTC or 10:55 pm local time (near
Virden Manitoba). The animation above shows GOES-15 (left) and GOES-13 (right) Infrared imagery from 0000 UTC through 0430 UTC. The strong storm lifting northward over southwestern Manitoba is apparent, with an enhanced-V signature especially noticeable in the GOES-13 imagery.
A closer view of the tornadic supercell is shown below, with overlays of surface reports (metric units). The pulsing nature of the overshooting tops is evident in the fluctuation of the coldest cloud-top IR brightness temperatures (the coldest of which was -69º C, darker black color enhancement, on the 0300 UTC GOES-15 and 0315 UTC GOES-13 images). There are different apparent positions of the storms based on the satellite that views them because of parallax shifts. Such shifts are especially pronounced at higher latitudes with very tall storms.
![GOES-15 (left) and GOES-13 (right) 10.7 µm Infrared images, with surface reports [click to play animation]](https://cimss.ssec.wisc.edu/satellite-blog/wp-content/uploads/sites/5/2015/07/150727-28_G15_G13_IR_MB_TORNADO_13.GIF)
GOES-15 (left) and GOES-13 (right) 10.7 µm Infrared images, with surface reports [click to play animation]
A 1-km resolution Terra MODIS 11.0 µm Infrared image at 0331 UTC is shown below; the minimum cloud-top IR brightness temperature was -73º C.
![Terra MODIS 11.0 µm Infrared image [click to enlarge]](https://cimss.ssec.wisc.edu/satellite-blog/wp-content/uploads/sites/5/2015/07/MODIS_IR_20150728_0331.png)
Terra MODIS 11.0 µm Infrared image [click to enlarge]
![GOES-13 Visible (0.63 µm) imagery, times as indicated [click to play animation]](https://cimss.ssec.wisc.edu/satellite-blog/wp-content/uploads/sites/5/2015/07/GOES13_VIS_28July2015_0100.GIF)
GOES-13 Visible (0.63 µm) imagery, times as indicated [click to play animation]
Visible imagery from GOES-13 (above) and GOES-15 (below) showed the overshooting tops associated with the tornadic thunderstorm, as well as the rapidly expanding cirrus shield.
![GOES-15 Visible (0.62 µm) imagery, times as indicated [click to play animation]](https://cimss.ssec.wisc.edu/satellite-blog/wp-content/uploads/sites/5/2015/07/GOES15_VIS_28July2015_0100.GIF)
GOES-15 Visible (0.62 µm) imagery, times as indicated [click to play animation]
A closer view of the tornadic supercell from GOES-15 vs GOES-13 is shown below, with overlays of surface reports (metric units). The overshooting tops are again apparent on the images, along with an above-anvil plume (which is easier seen on the GOES-13 images, due to a more favorable forward-scattering viewing geometry). The robust convective development was first seen on the 2030 UTC images, in the vicinity of the Saskatchewan/Manitoba/North Dakota border region.
![GOES-15 (left) and GOES-13 (right) 0.63 µm visible channel images, with surface reports [click to play animation]](https://cimss.ssec.wisc.edu/satellite-blog/wp-content/uploads/sites/5/2015/07/150727-28_G15_G13_VIS_MB_TORNADO_07.GIF)
GOES-15 (left) and GOES-13 (right) 0.63 µm visible channel images, with surface reports [click to play animation]
As an area of low pressure was deepening over eastern Montana, warm and humid air was surging northward into far southern Saskatchewan and Manitoba
(surface analyses). GOES sounder derived product images (available from
this site) of Convective Available Potential Energy (CAPE), Lifted Index, and Total Precipitable Water (below) showed that the environment across southern Manitoba was becoming increasingly unstable and moist leading up to the time of convective initiation.
![GOES sounder CAPE derived product images [click to play animation]](https://cimss.ssec.wisc.edu/satellite-blog/wp-content/uploads/sites/5/2015/07/150728_00utc_CAPE.gif)
GOES sounder CAPE derived product images [click to play animation]
![GOES sounder Lifted Index derived product images [click to play animation]](https://cimss.ssec.wisc.edu/satellite-blog/wp-content/uploads/sites/5/2015/07/150727_23utc_LI.gif)
GOES sounder Lifted Index derived product images [click to play animation]
![GOES sounder Total Precipitable Water derived product images [click to play animation]](https://cimss.ssec.wisc.edu/satellite-blog/wp-content/uploads/sites/5/2015/07/150727_23utc_TPW.gif)
GOES sounder Total Precipitable Water derived product images [click to play animation]
View only this post
Read Less
![Morphed Microwave Imagery centered on Soudelor, 1200 UTC 3 August - 1200 UTC 5 August 2015 [click to enlarge]](https://cimss.ssec.wisc.edu/satellite-blog/wp-content/uploads/sites/5/2015/08/Soudelorlast48hrs_ending1200UTC5AugMIMIC.gif)
![Himawari-8 0.52 µm imagery, 3-4 August 2015 [click to play animation]](https://cimss.ssec.wisc.edu/satellite-blog/wp-content/uploads/sites/5/2015/08/1000x1000_AHIM08_B2_SOUDELOR_animated_2015215_203215_86_2015216_095945_86_GRAY.gif)
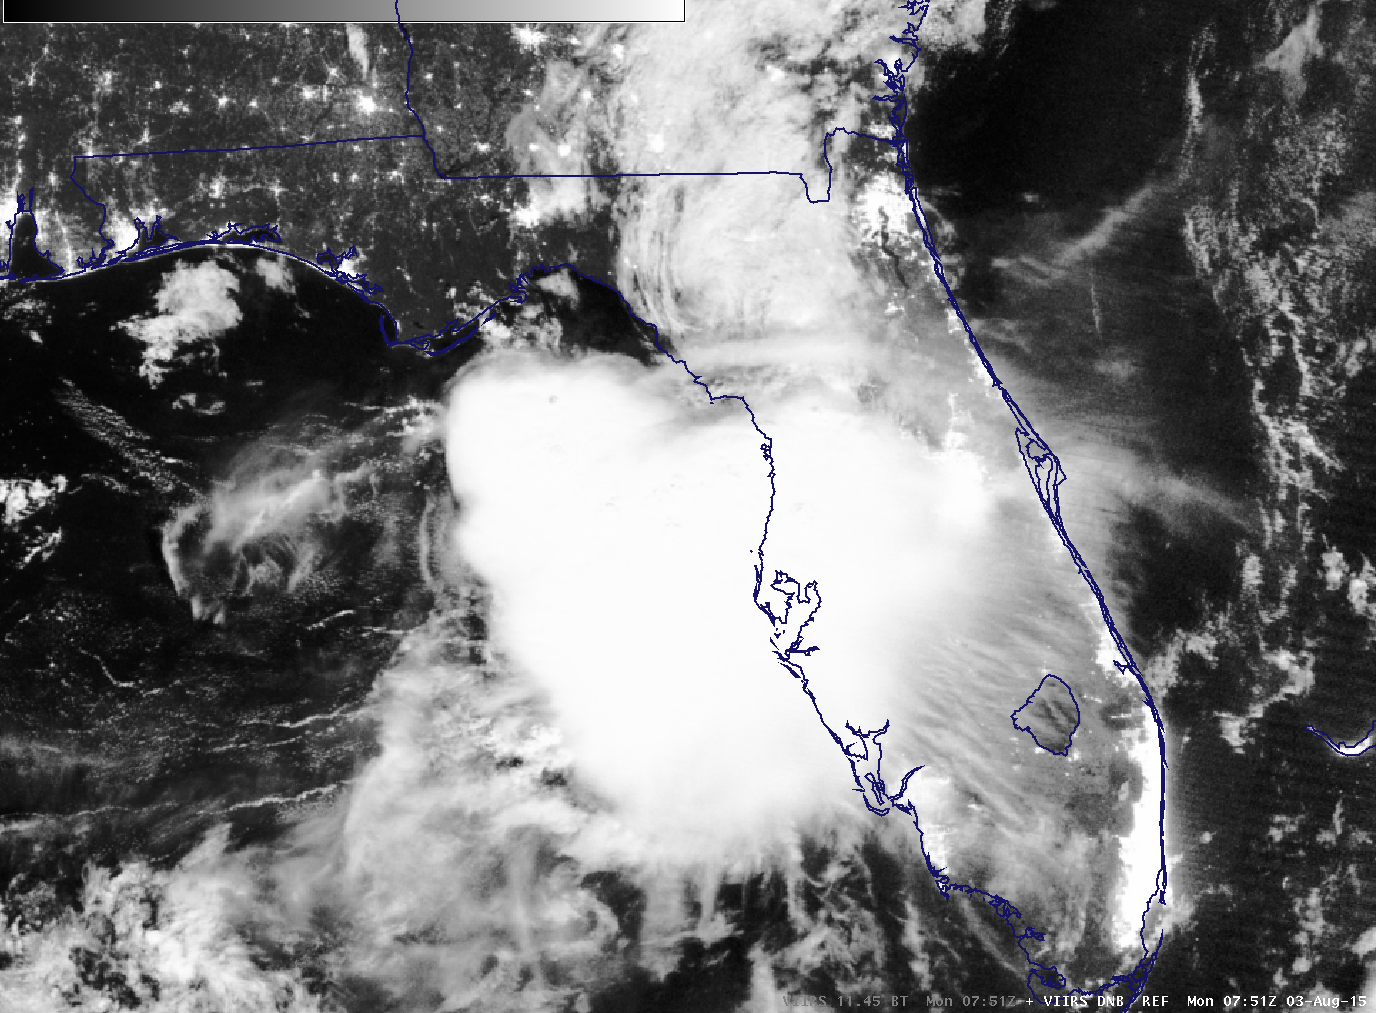
![Suomi NPP VIIRS Day/Night Band visible imager (0.70 µm) and infrared (11.45 µm) image at 1608 UTC 4 August 2015 [click to enlarge]](https://cimss.ssec.wisc.edu/satellite-blog/wp-content/uploads/sites/5/2015/08/ToggleI05_DNB_080415_1608_1.5E-8_TCSoudelor.gif)
![MIMIC Total Precipitable Water [click to play animation]](https://cimss.ssec.wisc.edu/satellite-blog/wp-content/uploads/sites/5/2015/08/MIMIC_TPW_20150804anim.gif)
![River Gauge Observations (Left) and National Weather Service (Tampa Bay) County Warning Area warnings (right) [click to enlarge]](https://cimss.ssec.wisc.edu/satellite-blog/wp-content/uploads/sites/5/2015/08/TampaFlood.gif)
![GOES-13 10.7 µm infrared imagery [click to play animation]](https://cimss.ssec.wisc.edu/satellite-blog/wp-content/uploads/sites/5/2015/08/960x1280_AGOES13_B4_TAMPA1_IR4_animated_2015213_114500_180_2015213_234500_180_IR4AVHRR4.gif)
![GOES-13 0.63 µm visible imagery [click to play animation]](https://cimss.ssec.wisc.edu/satellite-blog/wp-content/uploads/sites/5/2015/08/960x1280_AGOES13_B1_TAMPA2_VIS_animated_2015213_111500_180_2015213_234500_180_GRAY.gif)
![GOES-13 10.7 µm infrared imagery [click to play animation]](https://cimss.ssec.wisc.edu/satellite-blog/wp-content/uploads/sites/5/2015/08/960x1280_AGOES13_B4_TAMPA2_IR4_animated_2015215_054500_180_2015215_190000_180_IR4AVHRR4.gif)
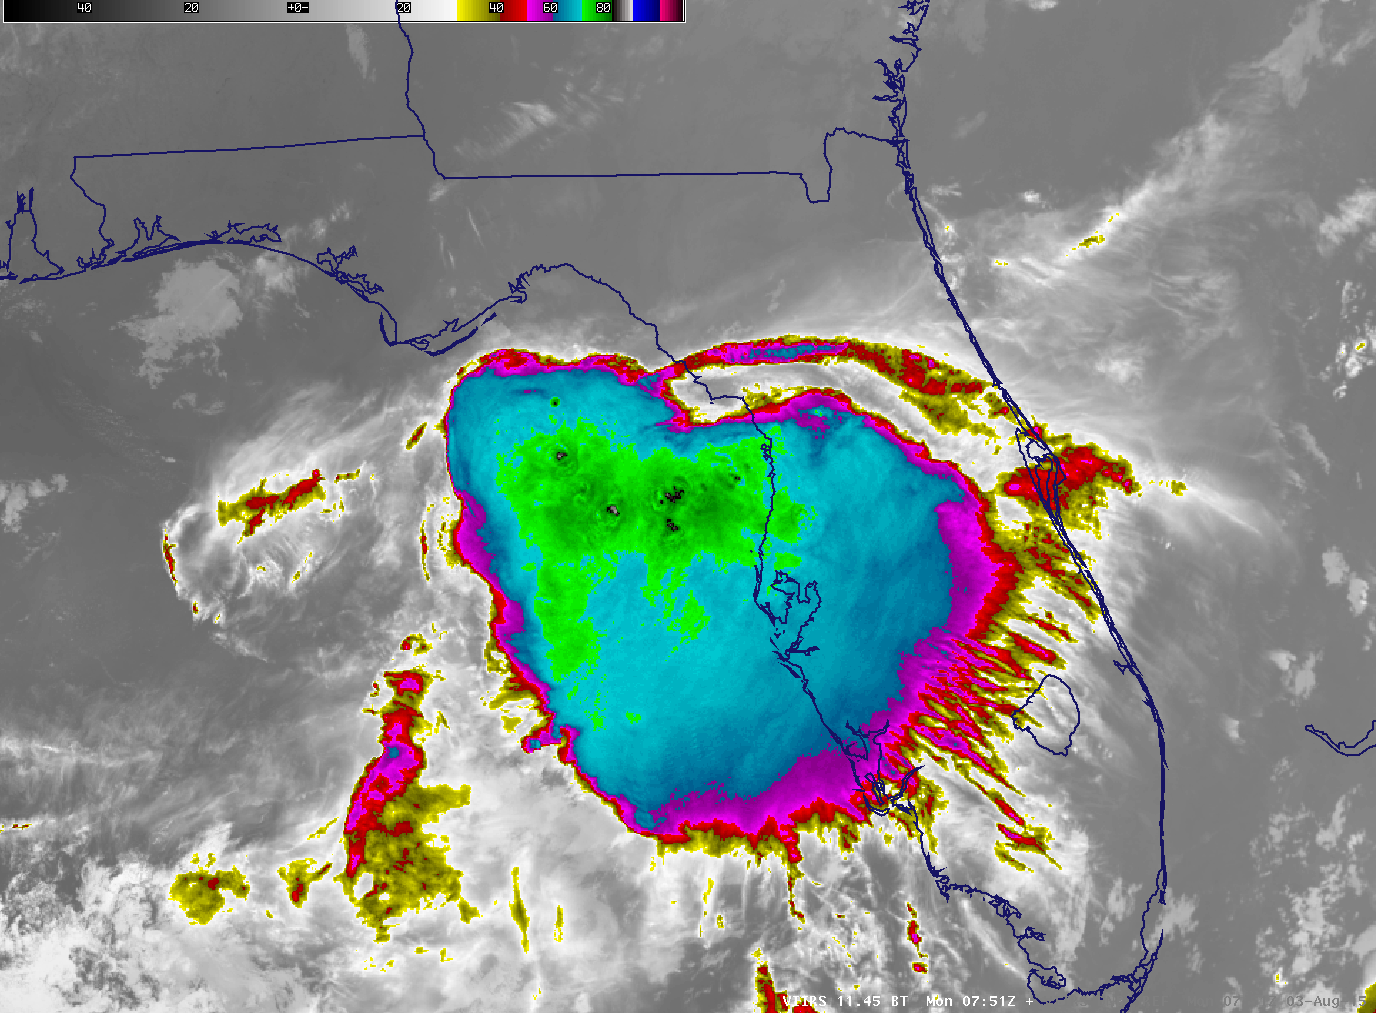
![Suomi NPP VIIRS Infrared Imagery (11.45 µm) and Day Night Band Visible (0.70 µm) Imagery, 0751 UTC 3 August 2015 [click to enlarge]](https://cimss.ssec.wisc.edu/satellite-blog/wp-content/uploads/sites/5/2015/08/VIIRS_DNB_11.45_BT_20150803_0751_Tampatoggle.gif)
![Weekly Rain Totals over Florida [click to enlarge]](https://cimss.ssec.wisc.edu/satellite-blog/wp-content/uploads/sites/5/2015/08/FloridaWeeklyRainsEnding4August.jpg)
![GOES-13 Visible (0.63µm) imagery [click to play animation]](https://cimss.ssec.wisc.edu/satellite-blog/wp-content/uploads/sites/5/2015/08/960x1280_EASTL_B1_G13_VIS_animated_2015214_104500_180_2015215_014500_180_GRAY.gif)
![GOES-13 Sounder DPI Lifted Index, times as indicated [click to play animation]](https://cimss.ssec.wisc.edu/satellite-blog/wp-content/uploads/sites/5/2015/08/GOESSounderDPI_LI_2-3August-24anim.gif)
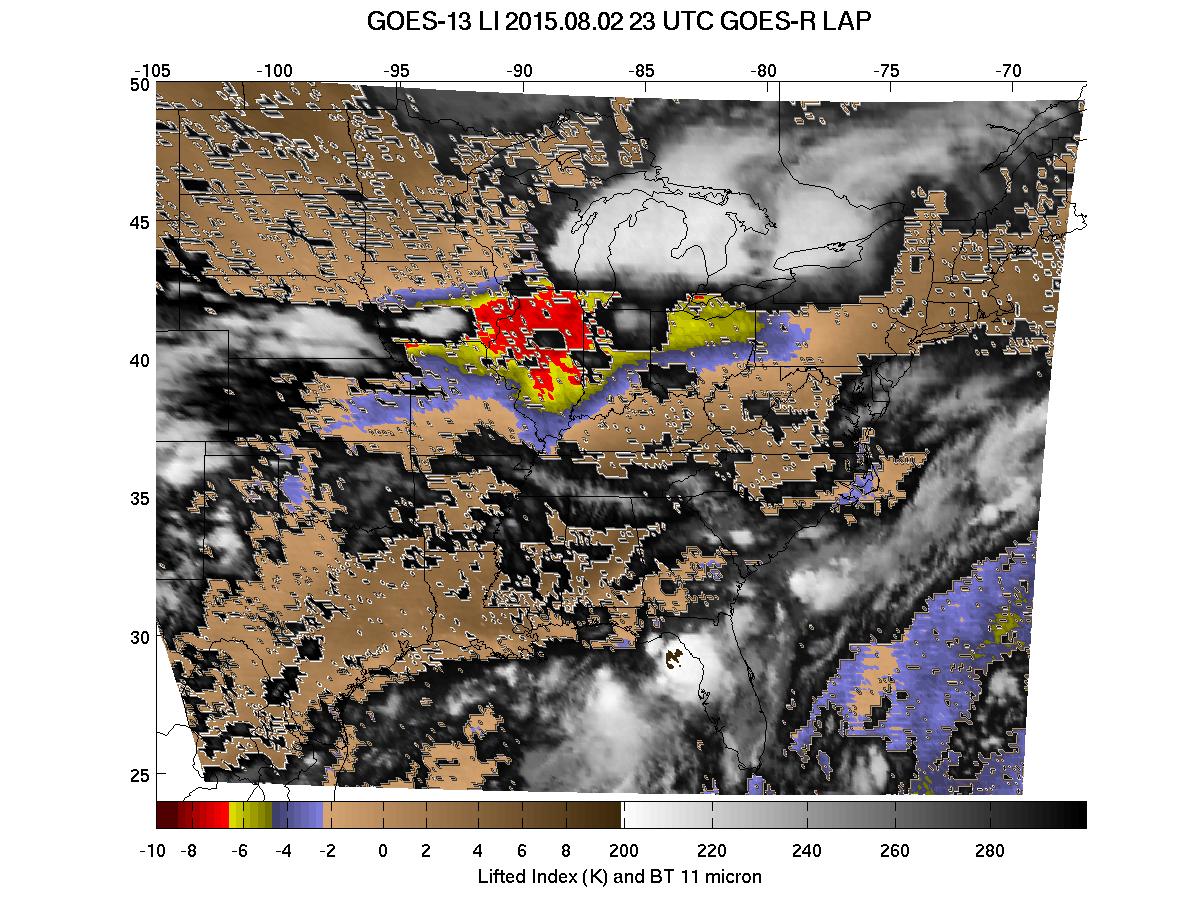
![GOES-R LAP Lifted Index, times as indicated [click to play animation]](https://cimss.ssec.wisc.edu/satellite-blog/wp-content/uploads/sites/5/2015/08/LIGOESRP1_20150802_17_23Zanim.gif)
![GOES-13 Sounder DPI Convective Available Potential Energy (CAPE), times as indicated [click to play animation]](https://cimss.ssec.wisc.edu/satellite-blog/wp-content/uploads/sites/5/2015/08/https://cimss.ssec.wisc.edu/satellite-blog/wp-content/uploads/sites/5/2015/08/GOES_CAPE_20150802_03anim.gif)
![GOES-R LAP Convective Available Potential Energy (CAPE), times as indicated [click to play animation]](https://cimss.ssec.wisc.edu/satellite-blog/wp-content/uploads/sites/5/2015/08/CAPEGOESRP1_20150802_12_23anim.gif)
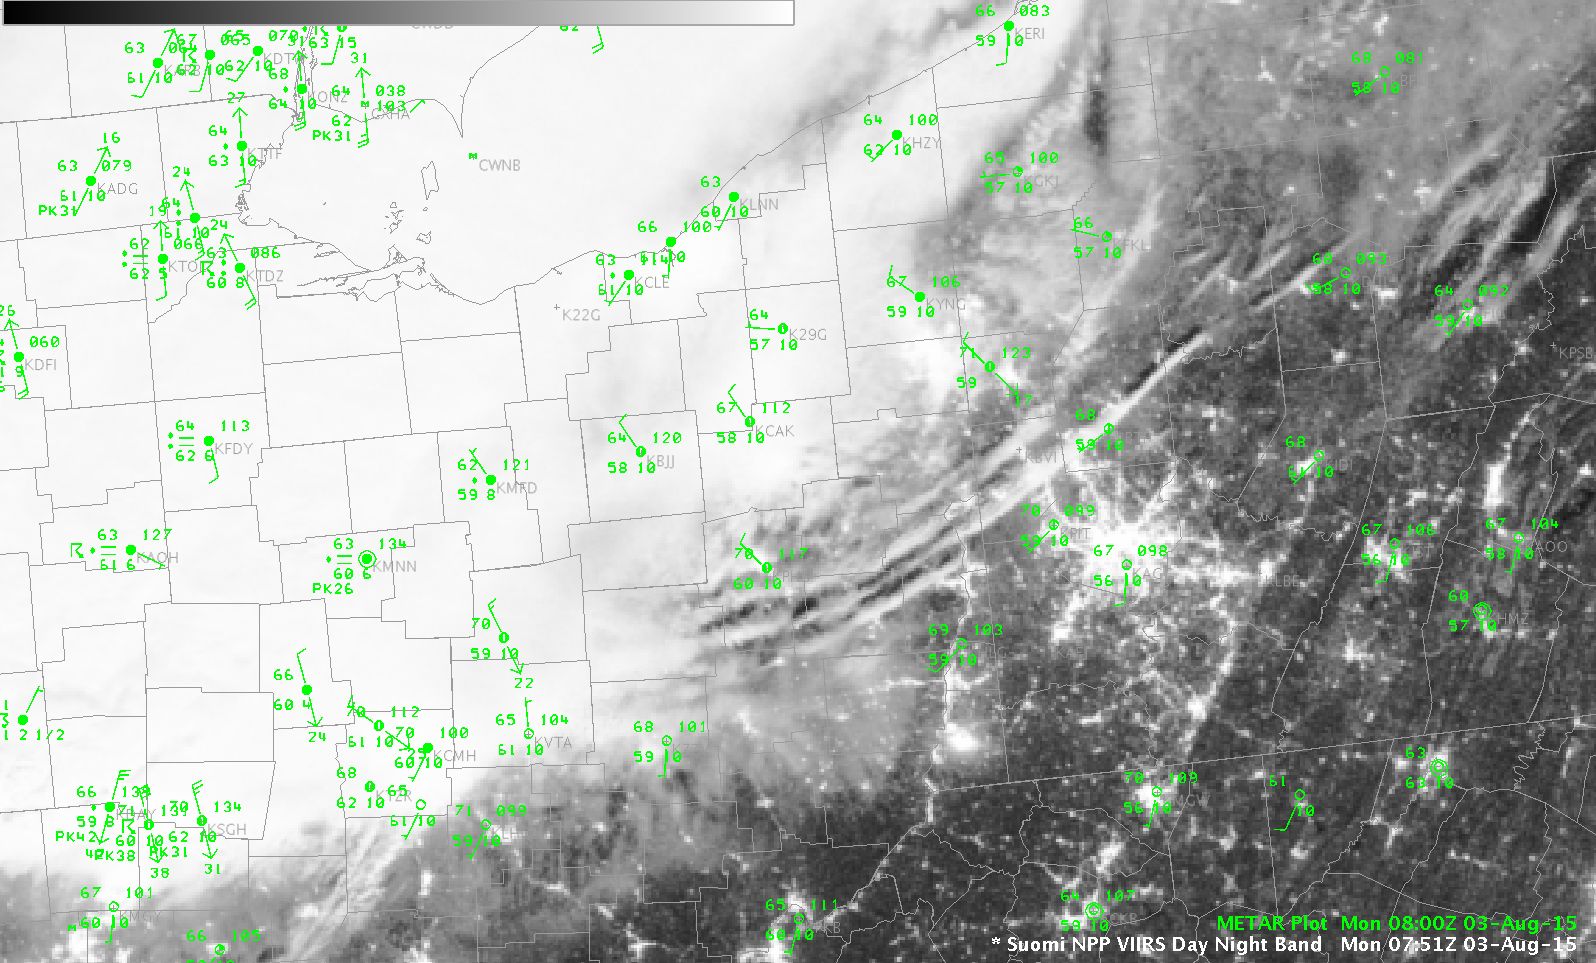
![Suomi NPP VIIRS Day Night Band Visible (0.70 µm) Imagery [click to enlarge]](https://cimss.ssec.wisc.edu/satellite-blog/wp-content/uploads/sites/5/2015/08/VIIRS_DNB__REF_20150803_0751.png)
![Suomi NPP VIIRS Infrared (11.45 µm) Imagery [click to enlarge]](https://cimss.ssec.wisc.edu/satellite-blog/wp-content/uploads/sites/5/2015/08/VIIRS_11.45_BT_20150803_0751.png)
![Color-enhanced Infrared (10.7 µm) imagery from GOES-15 (left) and GOES-13 (right), times as indicated [click to play animation]](https://cimss.ssec.wisc.edu/satellite-blog/wp-content/uploads/sites/5/2015/07/GOES13GOES15_28July_ManitobaTornadoanim.gif)
![GOES-15 (left) and GOES-13 (right) 10.7 µm Infrared images, with surface reports [click to play animation]](https://cimss.ssec.wisc.edu/satellite-blog/wp-content/uploads/sites/5/2015/07/150727-28_goes15_goes13_ir_MB_tornado_anim.gif)
![GOES-13 Visible (0.63 µm) imagery, times as indicated [click to play animation]](https://cimss.ssec.wisc.edu/satellite-blog/wp-content/uploads/sites/5/2015/07/GOES13_VIS_28July2015animMANITOBATORNADO.gif)
![GOES-15 Visible (0.62 µm) imagery, times as indicated [click to play animation]](https://cimss.ssec.wisc.edu/satellite-blog/wp-content/uploads/sites/5/2015/07/GOES15_VIS_28July2015animMANITOBATORNADO.gif)
![GOES-15 (left) and GOES-13 (right) 0.63 µm visible channel images, with surface reports [click to play animation]](https://cimss.ssec.wisc.edu/satellite-blog/wp-content/uploads/sites/5/2015/07/150727-28_goes15_goes13_visible_MB_tornado_anim.gif)
![GOES sounder CAPE derived product images [click to play animation]](https://cimss.ssec.wisc.edu/satellite-blog/wp-content/uploads/sites/5/2015/07/150727-28_goes_sounder_cape_MB_tornado_anim.gif)
![GOES sounder Lifted Index derived product images [click to play animation]](https://cimss.ssec.wisc.edu/satellite-blog/wp-content/uploads/sites/5/2015/07/150727-28_goes_sounder_li_anim.gif)
![GOES sounder Total Precipitable Water derived product images [click to play animation]](https://cimss.ssec.wisc.edu/satellite-blog/wp-content/uploads/sites/5/2015/07/150727-28_goes_sounder_tpw_MB_tornado_anim.gif)
