![GOES-13 Infrared (10.7 um) images [click to play animation]](https://cimss.ssec.wisc.edu/satellite-blog/wp-content/uploads/sites/5/2015/08/150827-28_goes13_ir_FSD_heavy_rain_anim.gif)
GOES-13 Infrared (10.7 um) images [click to play animation]
A comparison of 1-km resolution POES AVHRR Visible (0.86 µm) and Infrared (12.0 µm) images at 2330 UTC or 6:30 PM local time (below) showed the developing convective storms in greater detail. The coldest cloud-top IR brightness temperature was -73º C with the westernmost cluster of thunderstorms.
![POES AVHRR Visible (0.86 m) and Infrared (12.0 um) images [click to enlarge]](https://cimss.ssec.wisc.edu/satellite-blog/wp-content/uploads/sites/5/2015/08/150827_2330utc_poes_avhrr_ir_visible_SD_anim.gif)
POES AVHRR Visible (0.86 m) and Infrared (12.0 um) images [click to enlarge]
![GOES-13 Infrared (10.7 um) images with METAR surface reports [click to play animation]](https://cimss.ssec.wisc.edu/satellite-blog/wp-content/uploads/sites/5/2015/08/150827-28_goes13_ir_metar_SD_anim.gif)
GOES-13 Infrared (10.7 um) images with METAR surface reports [click to play animation]
![Blended Total Precipitable Water Percent of Normal [click to play animation]](https://cimss.ssec.wisc.edu/satellite-blog/wp-content/uploads/sites/5/2015/08/150827-28_percent_normal_tpw_FSD_heavy_rain_anim.gif)
Blended Total Precipitable Water Percent of Normal [click to play animation]
Check out the rainfall on the west side of Sioux Falls. Almost an inch of rain fell in 10 minutes! pic.twitter.com/OYavFY67pp
— NWS Sioux Falls (@NWSSiouxFalls) August 28, 2015
How unprecedented was the rain? At a SDSU automated rain gauge at Sertoma Park, it measured 2.73″ of rain within 25 minutes! Wow! — NWS Sioux Falls (@NWSSiouxFalls) August 28, 2015
At the same gauge at Sertoma Park, it recorded 0.71″ of rain within 5 minutes! That’s a lot of water!
— NWS Sioux Falls (@NWSSiouxFalls) August 28, 2015
Updated precip total map – thanks to NWS FSD for additional data. #sdwx #siouxfalls pic.twitter.com/fc9qHqZZ2y — Dennis Todey (@sdclimatologist) August 28, 2015
Wondering how much rain you received last night? Here is a map of rainfall reports we received. pic.twitter.com/rqUF6AVYdf
— NWS Sioux Falls (@NWSSiouxFalls) August 29, 2015
View only this post Read Less
![GOES-12 10.7 µm IR images [click to play mp4 animation]](https://cimss.ssec.wisc.edu/satellite-blog/wp-content/uploads/sites/5/2015/08/960x1280_AGOES12_B4_KATRINAIR4_2005240_154500.GIF)
![GOES-12 10.7 µm IR images [click to enlarge]](https://cimss.ssec.wisc.edu/satellite-blog/wp-content/uploads/sites/5/2015/08/960x1280_AGOES12_B4_KATRINAIR4_2005240_040200_061500toggle.gif)
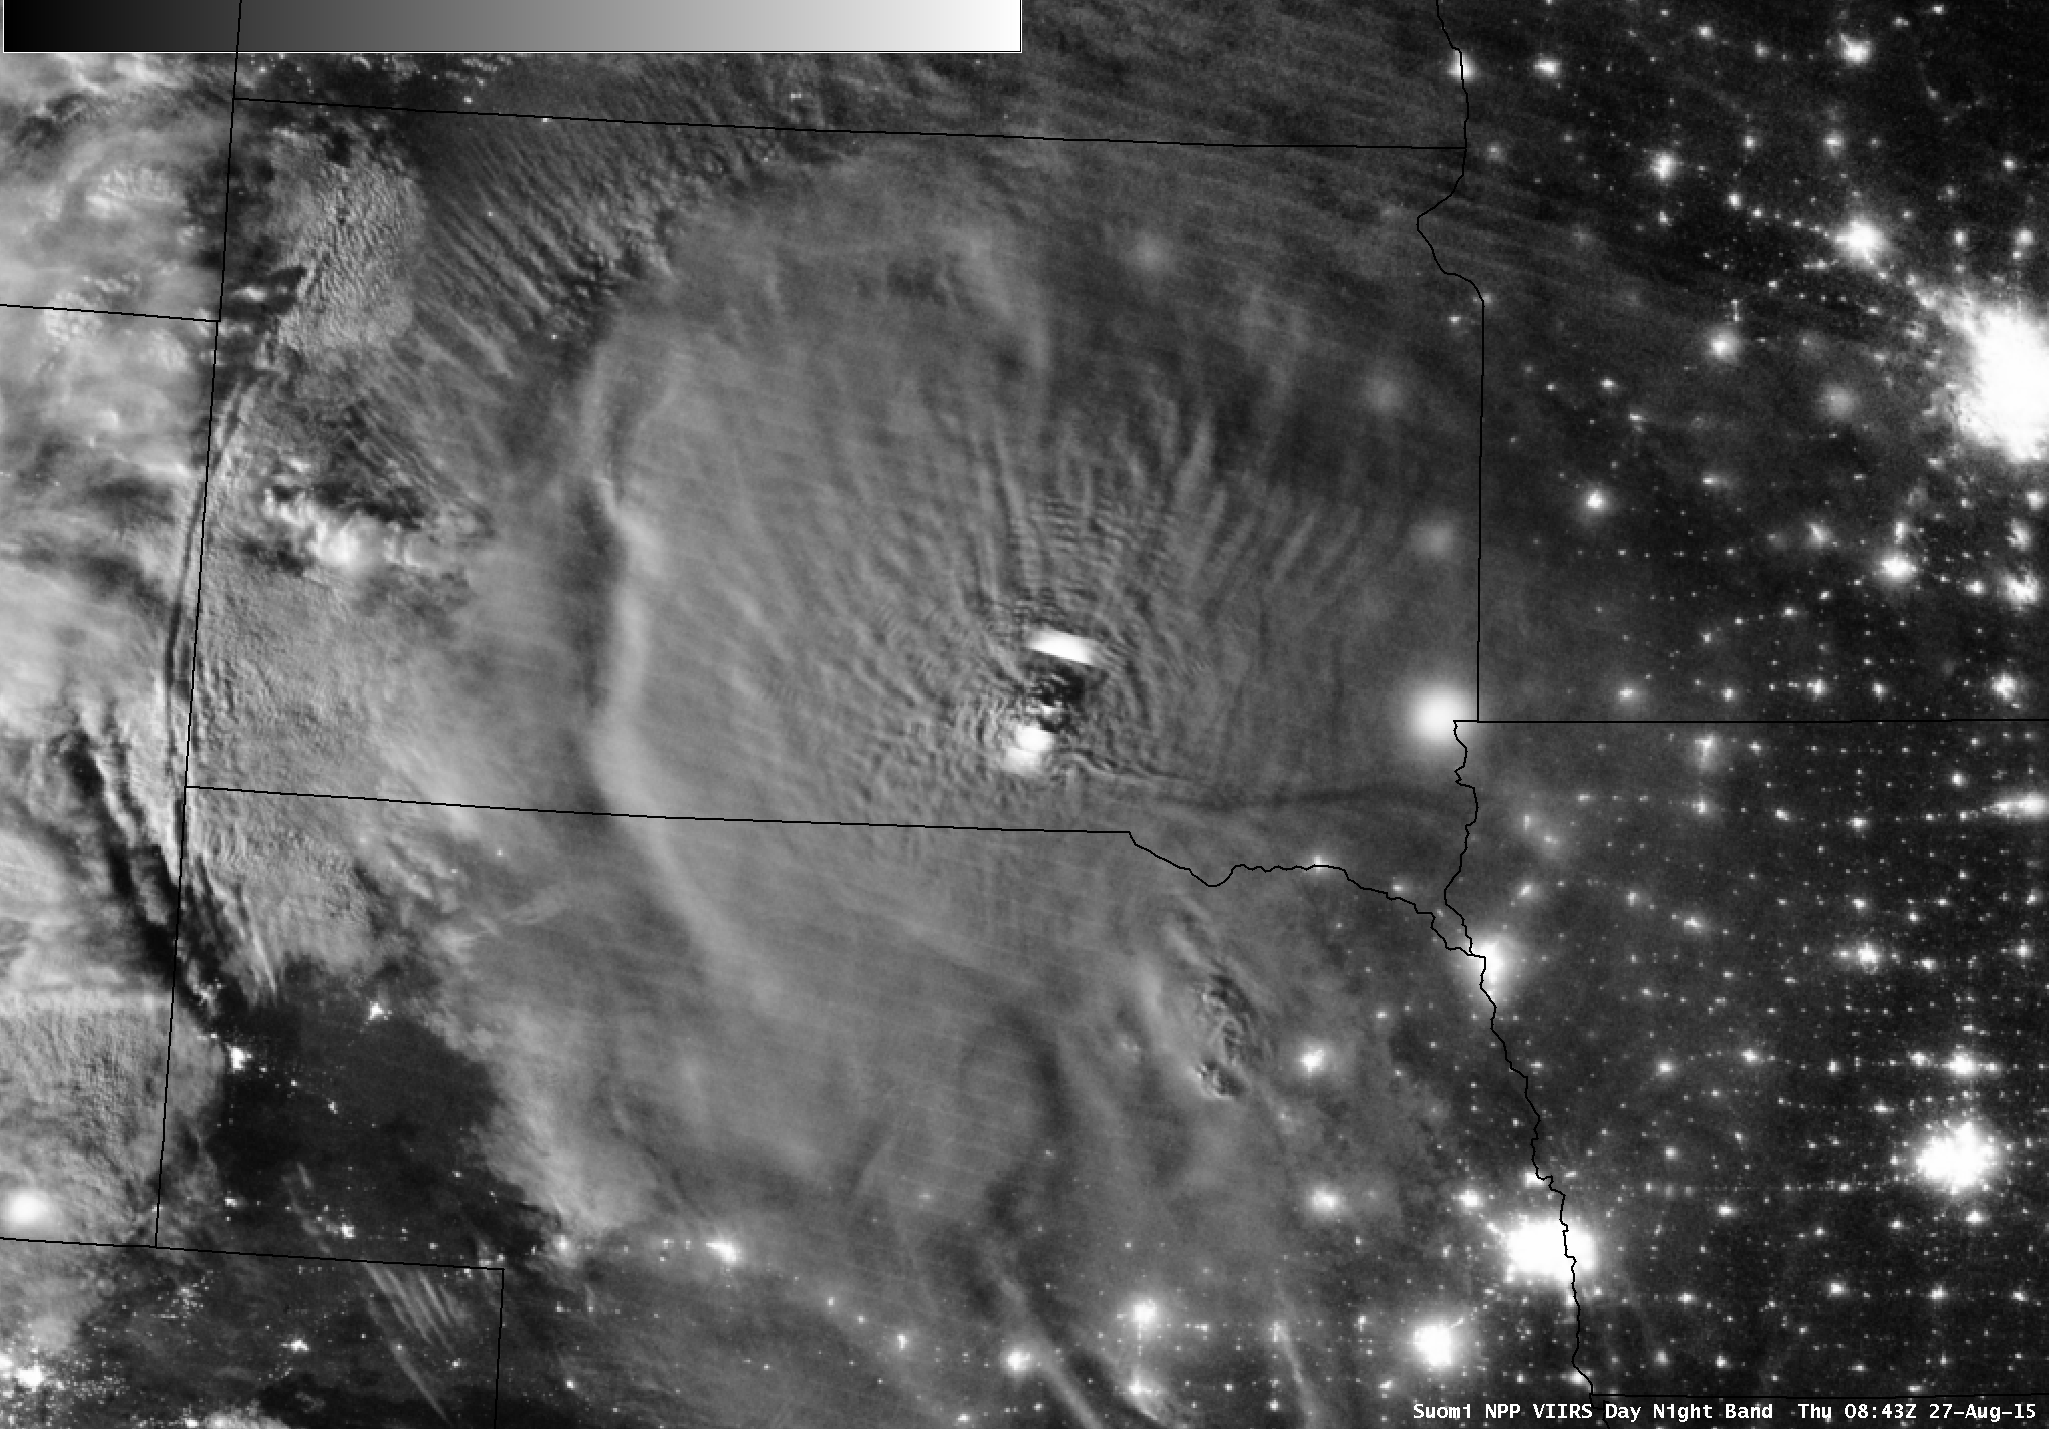
![Suomi NPP VIIRS Infrared (11.45 µm) and Day/Night Band (0.7 µm) images [click to enlarge]](https://cimss.ssec.wisc.edu/satellite-blog/wp-content/uploads/sites/5/2015/08/150827_0842utc_suomi_npp_viirs_ir_dnb_SD_mcs_anim.gif)
![GOES-13 water vapor (6.5 µm) images [click to play animation]](https://cimss.ssec.wisc.edu/satellite-blog/wp-content/uploads/sites/5/2015/08/150827_goes13_water_vapor_SD_mcs_anim.gif)
![GOES-13 10.7 µm IR images [click to play animated GIF]](https://cimss.ssec.wisc.edu/satellite-blog/wp-content/uploads/sites/5/2015/08/960x1280_AGOES13_B4_ERIKAIR4_animated_2015237_141500_180_2015238_141500_180_IR4AVHRR4.gif)
![GOES-13 Visible Imagery (0.63 µm) [click to play animated GIF]](https://cimss.ssec.wisc.edu/satellite-blog/wp-content/uploads/sites/5/2015/08/GOES13_VIS_26AUG2015_0945_1415anim.gif)
![ASCAT Winds and GOES-13 Water Vapor IR (6.5 µm) [click to enlarge]](https://cimss.ssec.wisc.edu/satellite-blog/wp-content/uploads/sites/5/2015/08/ASCAT_0056_26August2015.png)
![ASCAT Winds and GOES-13 Water Vapor IR (6.5 µm) [click to enlarge]](https://cimss.ssec.wisc.edu/satellite-blog/wp-content/uploads/sites/5/2015/08/ASCAT_1411_26August2015.png)
