* GOES-16 data posted on this page are preliminary, non-operational and are undergoing testing *During the week of 19 July – 26 July 2017, the Upper Midwest was affected by a number of strong to severe Mesoscale Convective System (MCS) events, as shown in an animation of GOES-16 “Clean” Infrared Window (10.3 µm) images... Read More
![GOES-16 Infrared Window (10.3 µm) images [click to play MP4 animation]](https://cimss.ssec.wisc.edu/satellite-blog/wp-content/uploads/sites/5/2017/07/WI_IRW_WEEK_800x800_B13_2017200_235718_0001PANEL.GIF)
GOES-16 Infrared Window (10.3 µm) images [click to play MP4 animation]
* GOES-16 data posted on this page are preliminary, non-operational and are undergoing testing *
During the week of 19 July – 26 July 2017, the Upper Midwest was affected by a number of strong to severe Mesoscale Convective System (MCS) events, as shown in an animation of GOES-16 “Clean” Infrared Window (10.3 µm) images (above).
At the beginning of that time period, a derecho moved across the region on 19 July producing widespread damaging winds, large hail and a few tornadoes (blog post).
Following the derecho, a separate outbreak of thunderstorms exhibited well-defined “enhanced-V” storm top signatures in western Wisconsin (below).
![GOES-16 Infrared Window (10.3 µm) image [click to enlarge]](https://cimss.ssec.wisc.edu/satellite-blog/wp-content/uploads/sites/5/2017/07/WI_IRW_WEEK_800x800_B13_2017201_050718_0001PANEL.GIF)
GOES-16 Infrared Window (10.3 µm) image [click to enlarge]
Another MCS produced tornadoes and damaging winds across eastern Iowa and northern Illinois on 21 July (
SPC storm reports) — at one point a storm in northern Illinois exhibited a seldom-seen “warm trench” surrounding an overshooting top (
below).
![GOES-16 Infrared Window (10.3 µm) image [click to enlarge]](https://cimss.ssec.wisc.edu/satellite-blog/wp-content/uploads/sites/5/2017/07/WI_IRW_WEEK_800x800_B13_2017203_010718_0001PANEL.GIF)
GOES-16 Infrared Window (10.3 µm) image [click to enlarge]
Early in the day on 23 July, “transverse banding” — a signature indicating the likelihood of high-altitude turbulence — was seen around the northern periphery of an MCS that was centered in southern Illinois (
below).
![GOES-16 Infrared Window (10.3 µm) image [click to enlarge]](https://cimss.ssec.wisc.edu/satellite-blog/wp-content/uploads/sites/5/2017/07/WI_IRW_WEEK_800x800_B13_2017204_114718_0001PANEL.GIF)
GOES-16 Infrared Window (10.3 µm) image [click to enlarge]
A pattern of mesoscale banding was displayed by thunderstorms that produced localized 1-2″ amounts of rainfall across southern Wisconsin on 26 July (
below).
![GOES-16 Infrared Window (10.3 µm) image [click to enlarge]](https://cimss.ssec.wisc.edu/satellite-blog/wp-content/uploads/sites/5/2017/07/WI_IRW_WEEK_800x800_B13_2017207_052218_0001PANEL.GIF)
GOES-16 Infrared Window (10.3 µm) image [click to enlarge]
Also noteworthy was the swath of very heavy rainfall during this 1-week period across eastern Iowa, far southwestern Wisconsin and northern Illinois
(below), which was responsible for flash flooding in those areas.
![7-day total precipitation, departure from normal and percent of normal [click to enlarge]](https://cimss.ssec.wisc.edu/satellite-blog/wp-content/uploads/sites/5/2017/07/170727_12utc_7day_precip_departure_percent_anim.gif)
7-day total precipitation, departure from normal and percent of normal [click to enlarge]
View only this post
Read Less
![GOES-16 Infrared Window (10.3 µm) images, with surface station identifiers plotted in yellow [click to play MP4 animation]](https://cimss.ssec.wisc.edu/satellite-blog/wp-content/uploads/sites/5/2017/07/G16_IR_MD_SPC_24JUL2017_960x1280_B13_2017205_052926_0001PANEL.GIF)
![1-minute GOES-16 (10.3 µm, left) vs 15-minute GOES-13 (10.7 µm, right) Infrared Window images [click to play MP4 animation]](https://cimss.ssec.wisc.edu/satellite-blog/wp-content/uploads/sites/5/2017/07/G16_G13_IR_SPC_MD_TORN_24JUL2017_958x638_B134_2017205_052926_0002PANELS.GIF)
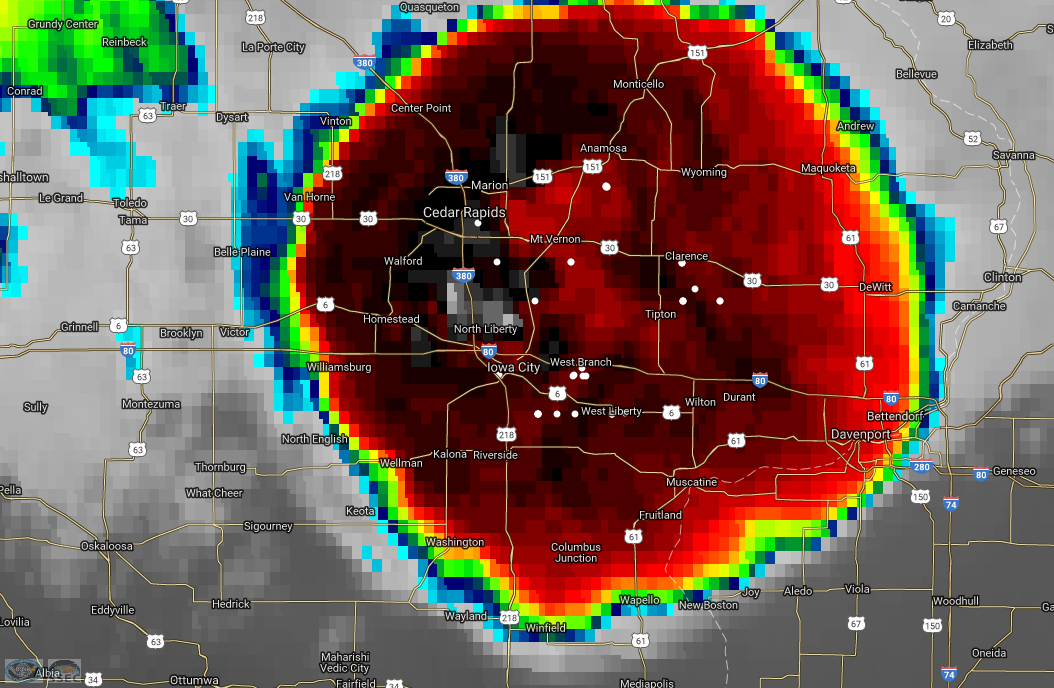
![GOES-16 Infrared Window (103 µm) images, with GLM Group data points plotted as white dots [click to play animation]](https://cimss.ssec.wisc.edu/satellite-blog/wp-content/uploads/sites/5/2017/07/170721_2030_2200_goes16_mesoscale_infrared_glm_Iowa_City_IA_anim.gif)
![GOES-16 Infrared Window (10.3 µm) images, with SPC storm reports plotted in cyan [click to play MP4 animation]](https://cimss.ssec.wisc.edu/satellite-blog/wp-content/uploads/sites/5/2017/07/960x1280_GOES16A_B13_G16_IR_DERECHO_19-20JUL2017_2017200_213718_0001PANEL.GIF)
![GOES-16 Visible (0.64 µm) images, with SPC storm reports plotted in red [click to play MP4 animation]](https://cimss.ssec.wisc.edu/satellite-blog/wp-content/uploads/sites/5/2017/07/960x1280_GOES16A_B2_G16_VIS_SD_SVR_19UL2017_2017200_152226_0001PANEL.GIF)
![GOES-16 Infrared Window (10.3 µm) images, with SPC storm reports plotted in cyan [click to play MP4 animation]](https://cimss.ssec.wisc.edu/satellite-blog/wp-content/uploads/sites/5/2017/07/960x1280_GOES16A_B13_G16_IR_SD_SVR_19UL2017_2017200_152226_0001PANEL.GIF)
![Terra MODIS Visible and Infrared Window (11.0 µm) images, with SPC storm reports [click to enlarge]](https://cimss.ssec.wisc.edu/satellite-blog/wp-content/uploads/sites/5/2017/07/170719_1656utc_terra_modis_visible_infrared_spc_storrm_reports_SD_MCS_anim.gif)
![Suomi NPP VIIRS Visible (0.64 µm) and Infrared Window (11.45 µm) images, with SPC storm reports [click to enlarge]](https://cimss.ssec.wisc.edu/satellite-blog/wp-content/uploads/sites/5/2017/07/170719_1846utc_suomi_npp_viirs_visible_infrared_spc_storm_reports_SD_MN_MCS_anim.gif)
