GOES-13 Visible (0.63 µm, 1-km resolution) images (above) showed the development of lake effect snow bands across the Great Lakes region following the passage of a strong arctic cold front on 12 February 2016. As a result of the atmospheric instability (due to the advection of very cold air aloft), several distinct... Read More
![GOES-13 Visible (0.63 µm) images [click to play animation]](https://cimss.ssec.wisc.edu/satellite-blog/wp-content/uploads/sites/5/2016/02/960x1280_AGOES13_B1_GOES13_VIS_LES_MI_12FEB_2016043_204500_0001PANEL.GIF)
GOES-13 Visible (0.63 µm) images [click to play animation]
GOES-13 Visible (0.63 µm, 1-km resolution) images
(above) showed the development of lake effect snow bands across the Great Lakes region following the passage of a strong arctic cold front on
12 February 2016. As a result of the atmospheric instability (due to the advection of very cold air aloft), several distinct convective elements could be seen developing within a few of the lake effect bands — especially over Lower Michigan where moderate to heavy snow was reported at some locations during brief snow squalls.
Many of these lake effect snow bands could also be seen on the corresponding GOES-13 Water Vapor (6.5 µm, 4-km resolution) images (below).
![GOES-13 Water Vapor (6.5 µm) images [click to play animation]](https://cimss.ssec.wisc.edu/satellite-blog/wp-content/uploads/sites/5/2016/02/960x1280_AGOES13_B3_GOES13_WV_LES_MI_12FEB_2016043_204500_0001PANEL.GIF)
GOES-13 Water Vapor (6.5 µm) images [click to play animation]
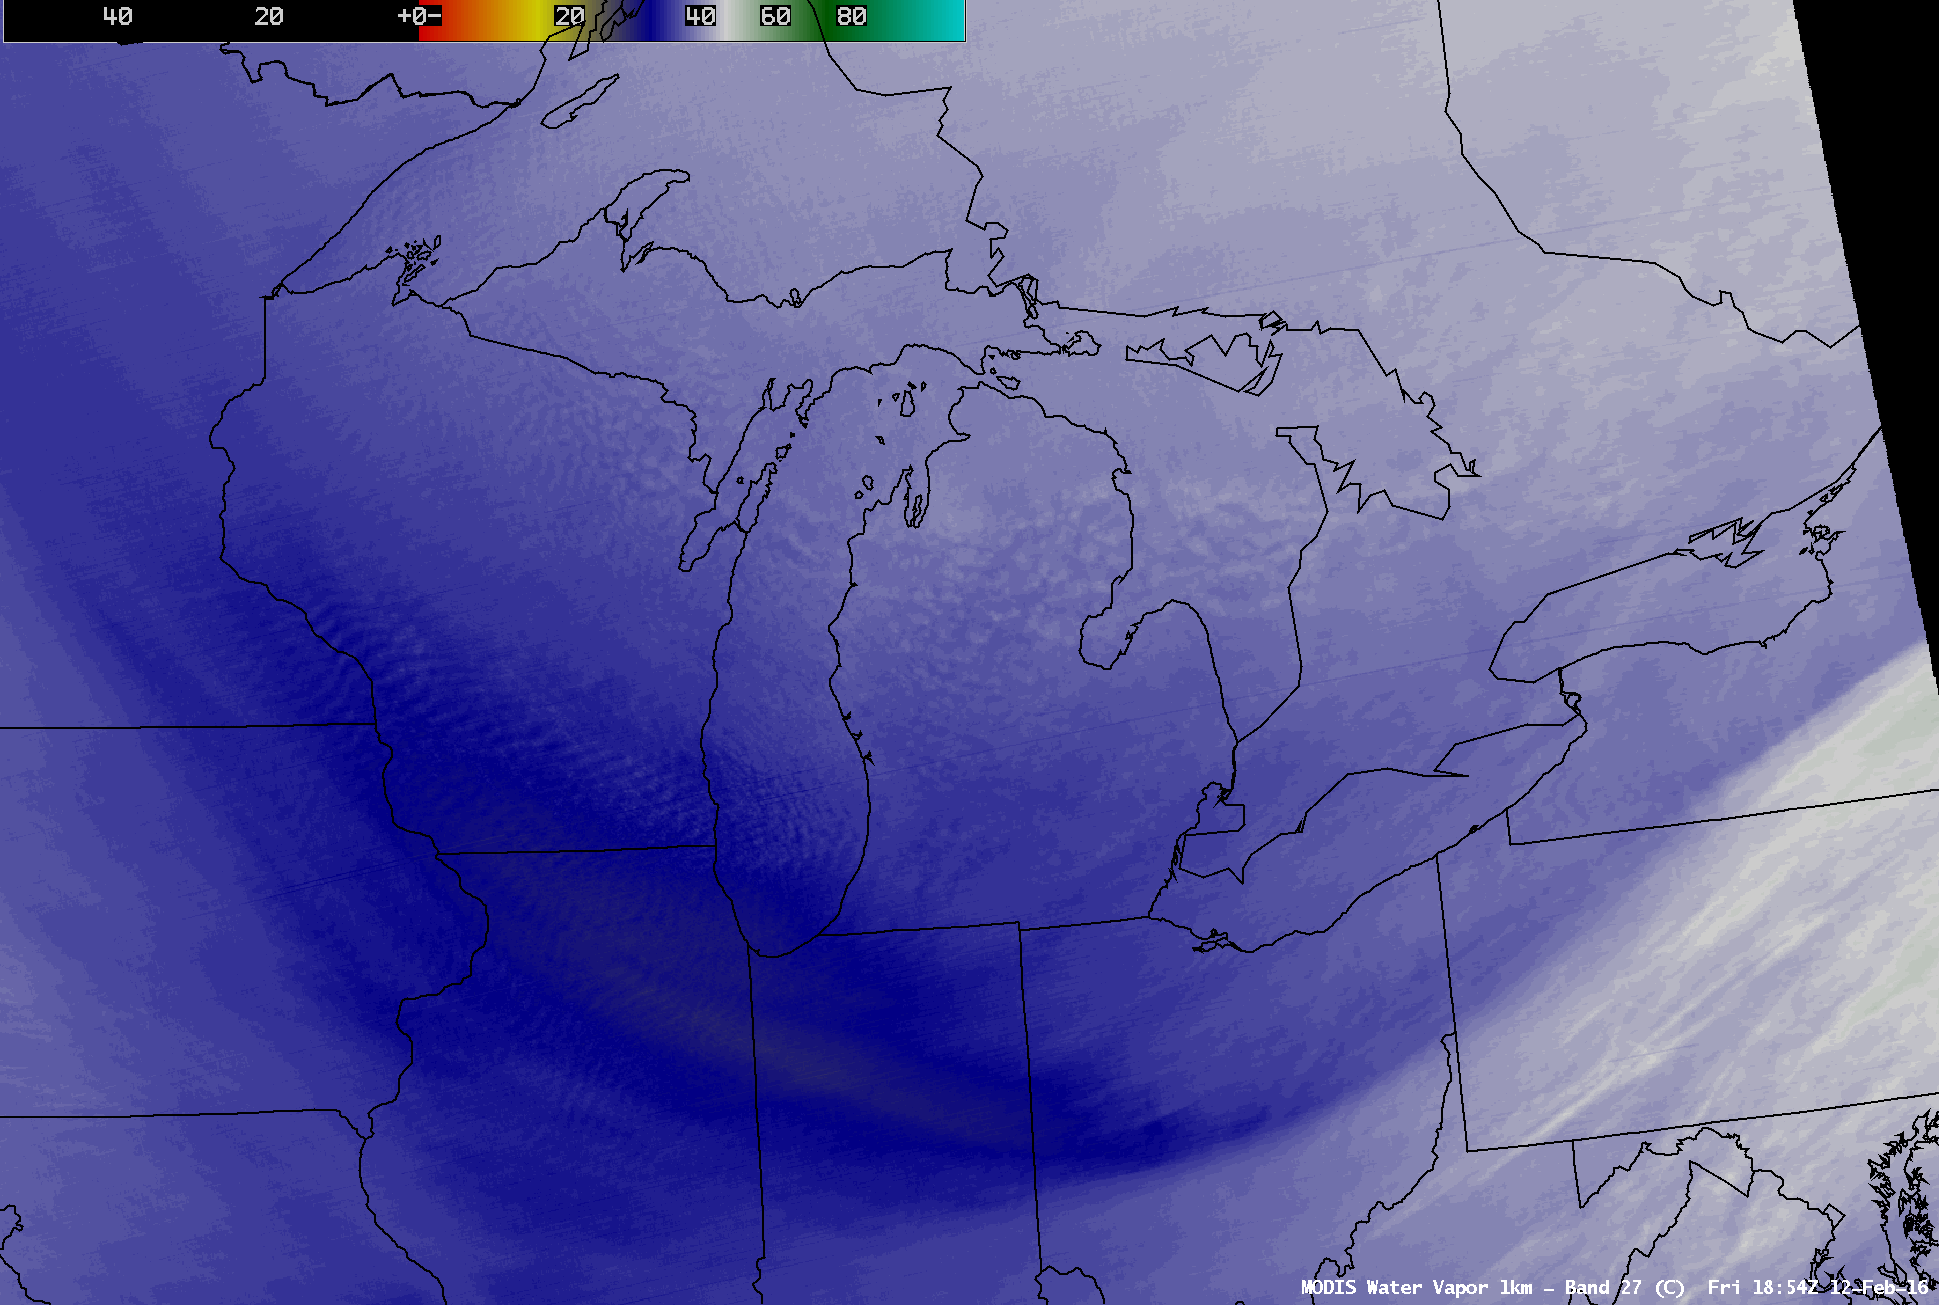
A comparison of 1-km resolution Aqua MODIS Visible (0.65 µm) and Water Vapor (6.7 µm) images at 1854 UTC
(below) revealed much better detail of the lake effect cloud band features in the water vapor image.
![Aqua MODIS Visible (0.65 m) and Water Vapor (6.7 µm) images [click to enlarge]](https://cimss.ssec.wisc.edu/satellite-blog/wp-content/uploads/sites/5/2016/02/160212_1854utc_modis_water_vapor_visible_MI_les_bands_anim.gif)
Aqua MODIS Visible (0.65 m) and Water Vapor (6.7 µm) images [click to enlarge]
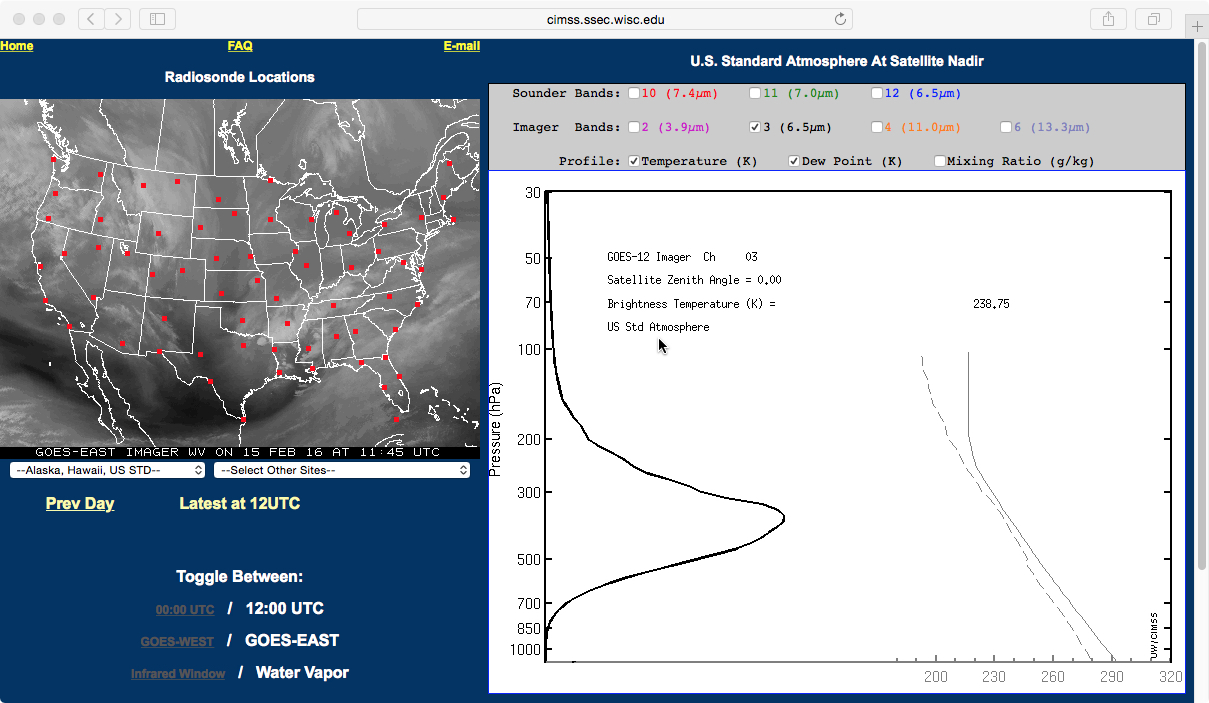
Conventional wisdom states that water vapor imagery generally portrays features located within the middle to upper troposphere, due to the altitude of the peak of the water vapor channel
weighting function calculated using a relatively warm and moist “US Standard Atmosphere” (
plot). However, in air masses that are very cold and/or very dry, the altitude of the water vapor channel weighting function peak is shifted to much lower altitudes, allowing a look at features that are located in (or at least rooted within) the lower to middle troposphere. Such was the case on this day, with the flow of very cold and dry arctic air behind the cold front. A comparison of the GOES-13
imager* water vapor channel weighting function plots at 12 UTC for Green Bay WI
(behind the cold front) and Detroit MI
(ahead of the cold front) showed the dramatic drop in the peak altitude over Green Bay
(below).
![GOES-13 imager Water Vapor (6.5 µm) weighting function plots for Green Bay WI and Detroit MI at 12 UTC on 12 February [click to enlarge]](https://cimss.ssec.wisc.edu/satellite-blog/wp-content/uploads/sites/5/2016/02/160212_12utc_GRB_DTX_water_vapor_weighting_function_anim.gif)
GOES-13 imager Water Vapor (6.5 µm) weighting function plots for Green Bay WI and Detroit MI at 12 UTC on 12 February [click to enlarge]
Similarly, a comparison of GOES-13 imager water vapor channel weighting function plots for Detroit MI at 12 UTC
(before the passage of the cold front) and 00 UTC on 13 February
(after the passage of the cold front) showed a sharp drop in the altitude of the weighting function peak. This allowed radiation emitted from the tops of the more pronounced and vertically-developed lake effect cloud bands to reach the water vapor detectors on the satellite.
![GOES-13 imager Water Vapor (6.5 µm) weighting function plots calculated from Detroit MI rawindsonde data at 12 UTC on 12 February and 00 UTC on 13 February [click to enlarge]](https://cimss.ssec.wisc.edu/satellite-blog/wp-content/uploads/sites/5/2016/02/160212_12utc_160213_00utc_DTX_water_vapor_weighting_function_anim.gif)
GOES-13 imager Water Vapor (6.5 µm) weighting function plots calculated from Detroit MI rawindsonde data at 12 UTC on 12 February and 00 UTC on 13 February [click to enlarge]
Note: there are also 3 unique water vapor channels on the GOES
sounder instrument (6.5 µm, 7.0 µm, and 7.4 µm) — however, due to an ongoing
problem with the GOES-13 sounder, said water vapor imagery was not available (as it was for
this example). However, the
ABI instrument on
GOES-R will provide imagery from 3 separate water vapor channels that are similar to those found on the current-generation sounder (but at much higher spatial and temporal resolution).
Hat tip to @turnageweather for the suggestion to blog about this case!
View only this post
Read Less
![GOES-13 Visible (0.63 µm) images [click to play animation]](https://cimss.ssec.wisc.edu/satellite-blog/wp-content/uploads/sites/5/2016/02/160212_goes13_visible_MI_lake_effect_snow_bands_anim.gif)
![GOES-13 Water Vapor (6.5 µm) images [click to play animation]](https://cimss.ssec.wisc.edu/satellite-blog/wp-content/uploads/sites/5/2016/02/160212_goes13_water_vapor_MI_lake_effect_snow_bands_anim.gif)
![Aqua MODIS Sea Surface Temperature product [click to enlarge]](https://cimss.ssec.wisc.edu/satellite-blog/wp-content/uploads/sites/5/2016/02/MODIS_SST_20160207_1836.png)
![Suomi NPP VIIRS and Aqua MODIS true-color images, combined with radar refectivity [click to enlarge]](https://cimss.ssec.wisc.edu/satellite-blog/wp-content/uploads/sites/5/2016/02/160209_modis_viirs_AL_LES_anim.gif)
![GOES-14 Visible (0.63 µm) images [click to play MP4 animation]](https://cimss.ssec.wisc.edu/satellite-blog/wp-content/uploads/sites/5/2016/02/960x1280_GOES14_B1_GOES14_VIS_AL_LES_10FEB_2016041_140000_0001PANEL.GIF)
![Terra MODIS true-color and false-color images [click to enlarge]](https://cimss.ssec.wisc.edu/satellite-blog/wp-content/uploads/sites/5/2016/02/160210_terra_modis_truecolor_falsecolor_AL_les_anim.gif)
![24-hour snowfall amounts ending at 12 UTC on 09, 10, and 11 February [click to enlarge]](https://cimss.ssec.wisc.edu/satellite-blog/wp-content/uploads/sites/5/2016/02/160209-11_24hour_snowfall_AL_les_anim.gif)
![Snow depth during the 24-hour period ending at 12 UTC on 09, 10, and 11 February [click to enlarge]](https://cimss.ssec.wisc.edu/satellite-blog/wp-content/uploads/sites/5/2016/02/160209-11_12utc_snow_depth_AL_les_anim.gif)
![GOES-14 Visible (0.63 µm) images [click to play MP4 animation]](https://cimss.ssec.wisc.edu/satellite-blog/wp-content/uploads/sites/5/2016/02/960x1280_GOES14_B1_GOES14_VIS_NC_SC_HOLE_PUNCH_2016040_150300_0001PANEL.GIF)
![GOES-14 Visible 0.63 µm (left) and Shortwave Infrared 3.9 µm (right) images [click to play MP4 animation]](https://cimss.ssec.wisc.edu/satellite-blog/wp-content/uploads/sites/5/2016/02/960x640_GOES14_B12_GOES14_VIS_SWIR_NC_SC_HOLE_PUNCH_CLOUDS_09FEB_2016040_150300_0002PANELS.GIF)
![POES AVHRR Visible 0.86 µm) and Infrared (12.0 µm) images [click to enlarge]](https://cimss.ssec.wisc.edu/satellite-blog/wp-content/uploads/sites/5/2016/02/160209_1517utc_poes_avhrr_visible_ir_NC_SC_hole_punch_clouds_anim.gif)
![GOES-14 Visible (0.63 µm) and Water Vapor (6.5 µm) images, with surface weather symbols plotted [click to play animation]](https://cimss.ssec.wisc.edu/satellite-blog/wp-content/uploads/sites/5/2016/02/160207_goes14_visible_water_vapor_Gulf_Stream_storm_anim.gif)
![GOES-14 Visible (0.63 µm) images, with surface weather symbols plotted [click to play MP4 animation]](https://cimss.ssec.wisc.edu/satellite-blog/wp-content/uploads/sites/5/2016/02/960x1280_GOES14_B1_GOES14_VIS_GULF_STREAM_STORM_2016038_213200_0001PANEL.GIF)
![POES AVHRR Visible (0.86 µm) and Infrared (12.0 µm) images [click to enlarge]](https://cimss.ssec.wisc.edu/satellite-blog/wp-content/uploads/sites/5/2016/02/160207_2202utc_poes_avhrr_visible_infrared_Gulf_Stream_Storm_anim.gif)
![POES AVHRR Infrared (12.0 µm) image [cluck to enlarge]](https://cimss.ssec.wisc.edu/satellite-blog/wp-content/uploads/sites/5/2016/02/AVHRR_VOL_IR_20160208_0137.png)
