
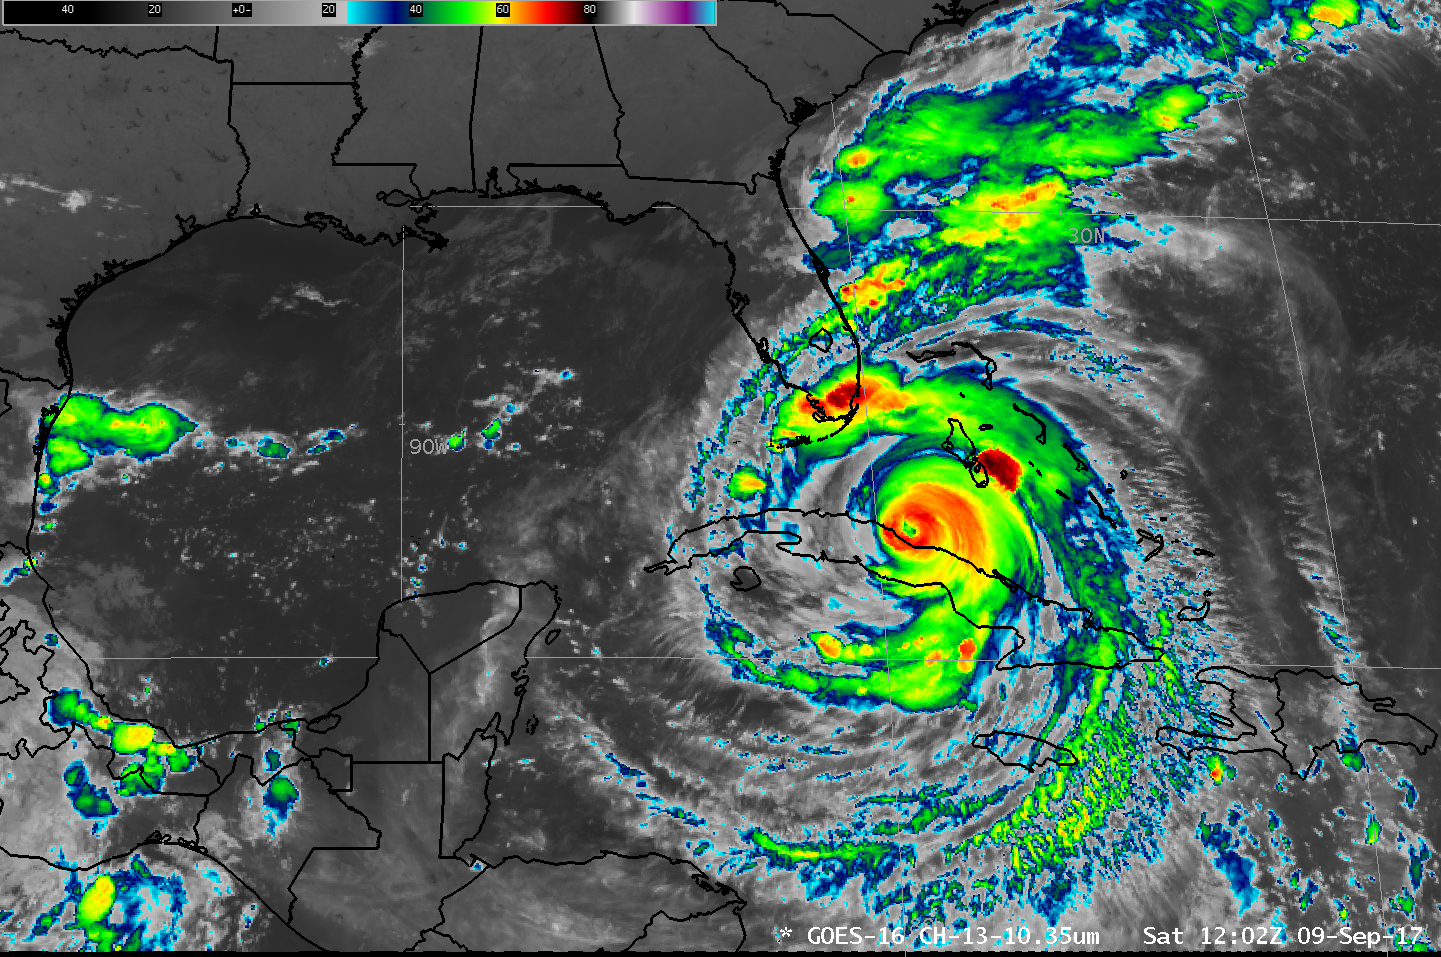
GOES-16 ABI Infrared Imagery from the Clean Window (10.3 µm), 0122-1342 UTC (Click to animate)
GOES-16 data posted on this page are preliminary, non-operational and are undergoing testing
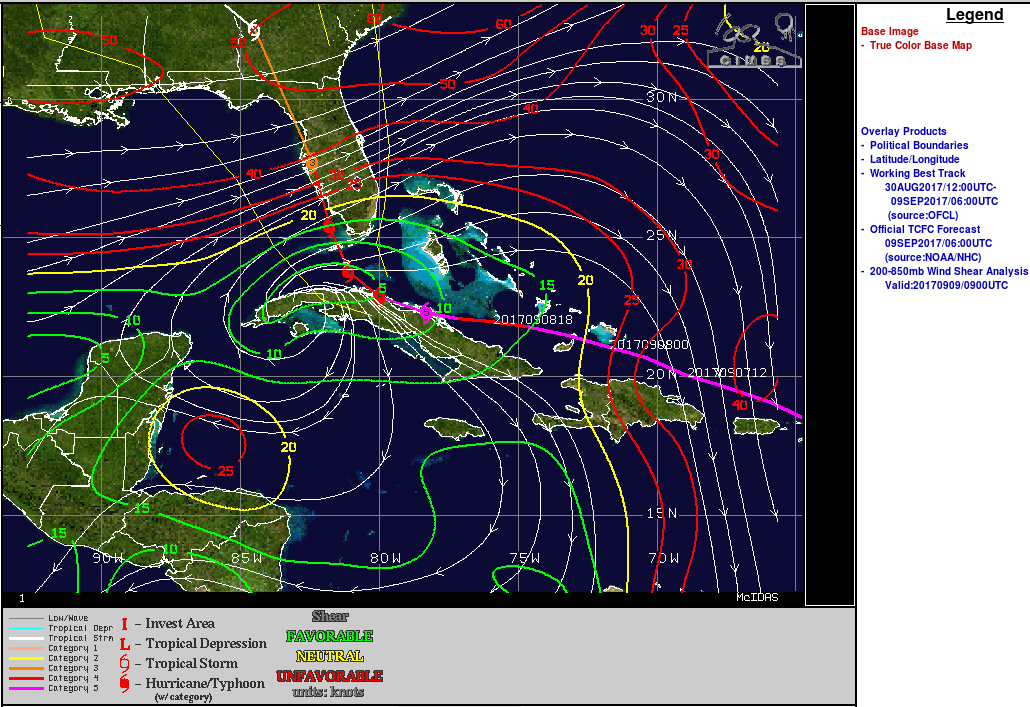
GOES-16 Infrared Imagery, above, shows Hurricane Irma moving north on a wobbly path (displaying trochoidal motion) through the Florida Keys. The eye of the storm moved between Key West (surface data plot) and Marathon (surface data plot) around sunrise on 10 September. Also note the development of well-defined transverse banding well to the northwest and north of the storm center — a cloud signature often associated with high-altitude turbulence. (In addition, GOES-16 Infrared images during 09-10 September with plots of surface wind gusts in knots is available here). Irma is a storm increasingly affected by wind shear, as evidenced by the asymmetries in the upper level clouds. and as noted in the 1200 UTC 10 September 2017 Wind Shear analysis below (Source).
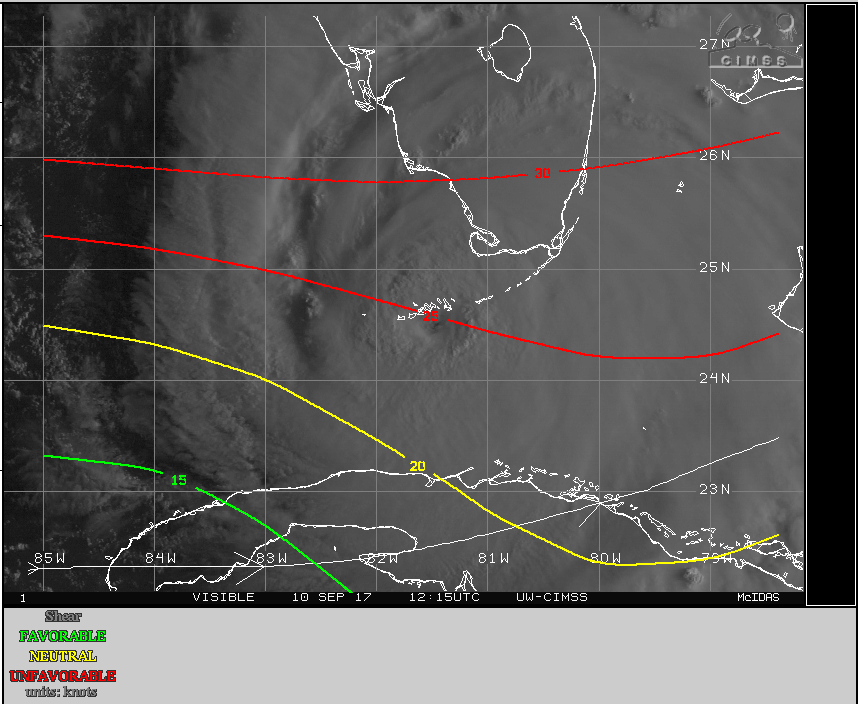
Wind shear (850-250 hPa) analysis, 1200 UTC 10 September, over GOES-13 Visible Imagery (0.64) (Click to enlarge)
Irma is being influenced by a mid-latitude system and is gradually starting the extended process of extratropical transition. The drying associated with the mid-latitude system is very apparent over the Gulf of Mexico in the animation of 6.95 µm (Mid-level Water Vapor) Infrared Imagery from GOES-16, below.

GOES-16 Mid-Level Water Vapor (6.95 µm) Infrared Imagery, 0230 -1445 UTC on 10 September 2017 (Click to animate)
MIMIC TPW, below (source), shows the convergence of residual Atlantic frontal moisture from the east (into northern Florida) and Hurricane Irma’s moisture fro the the Caribbean (into southern Florida) (Click to animate).
MIMIC Total Precipitable Water (Click to animate)
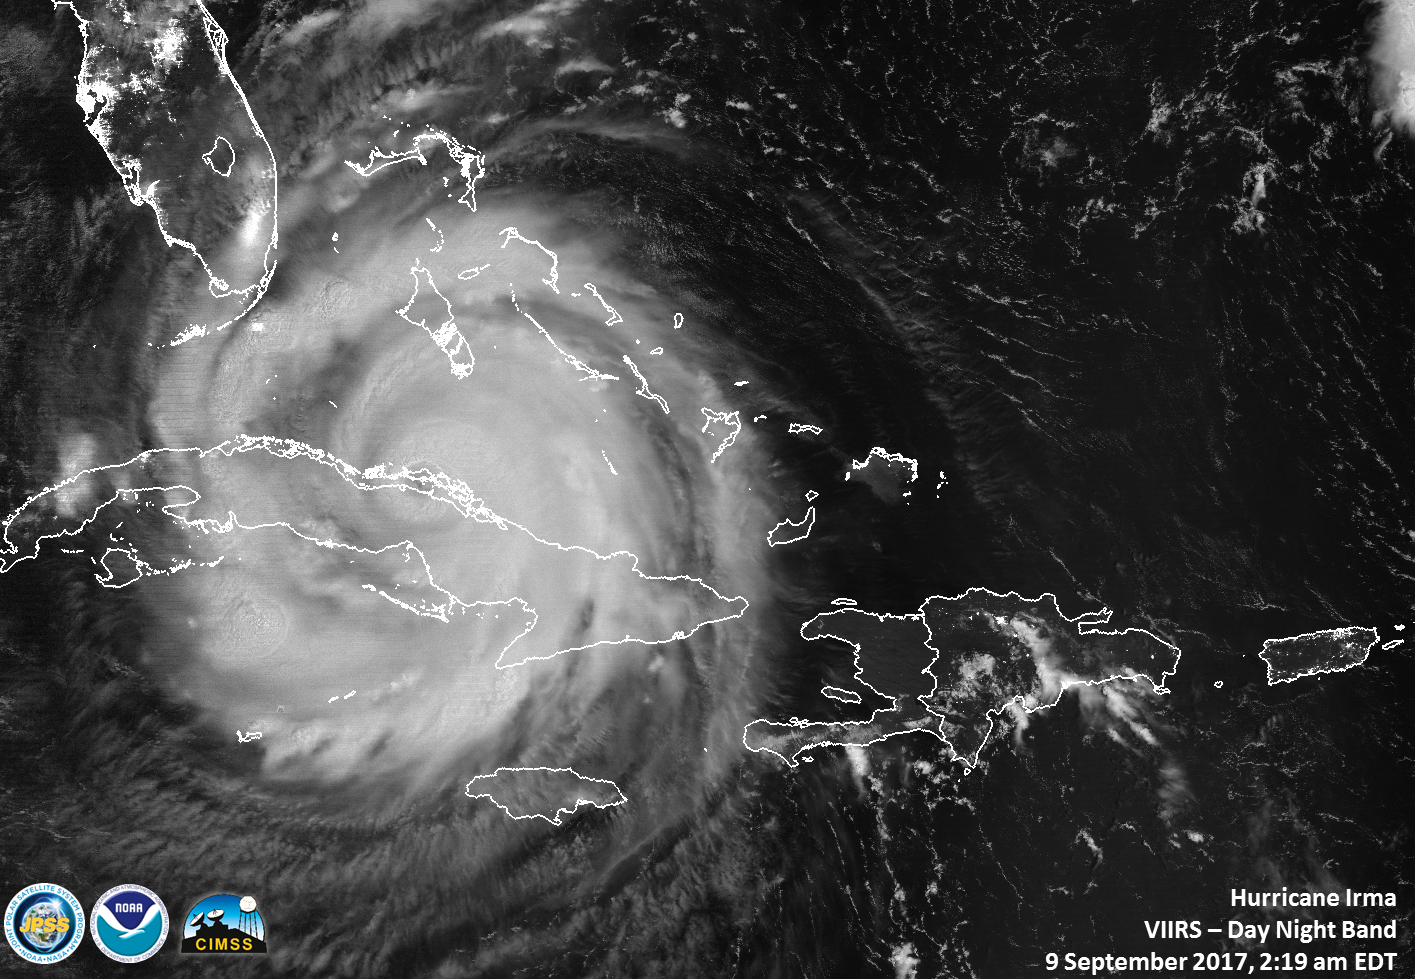
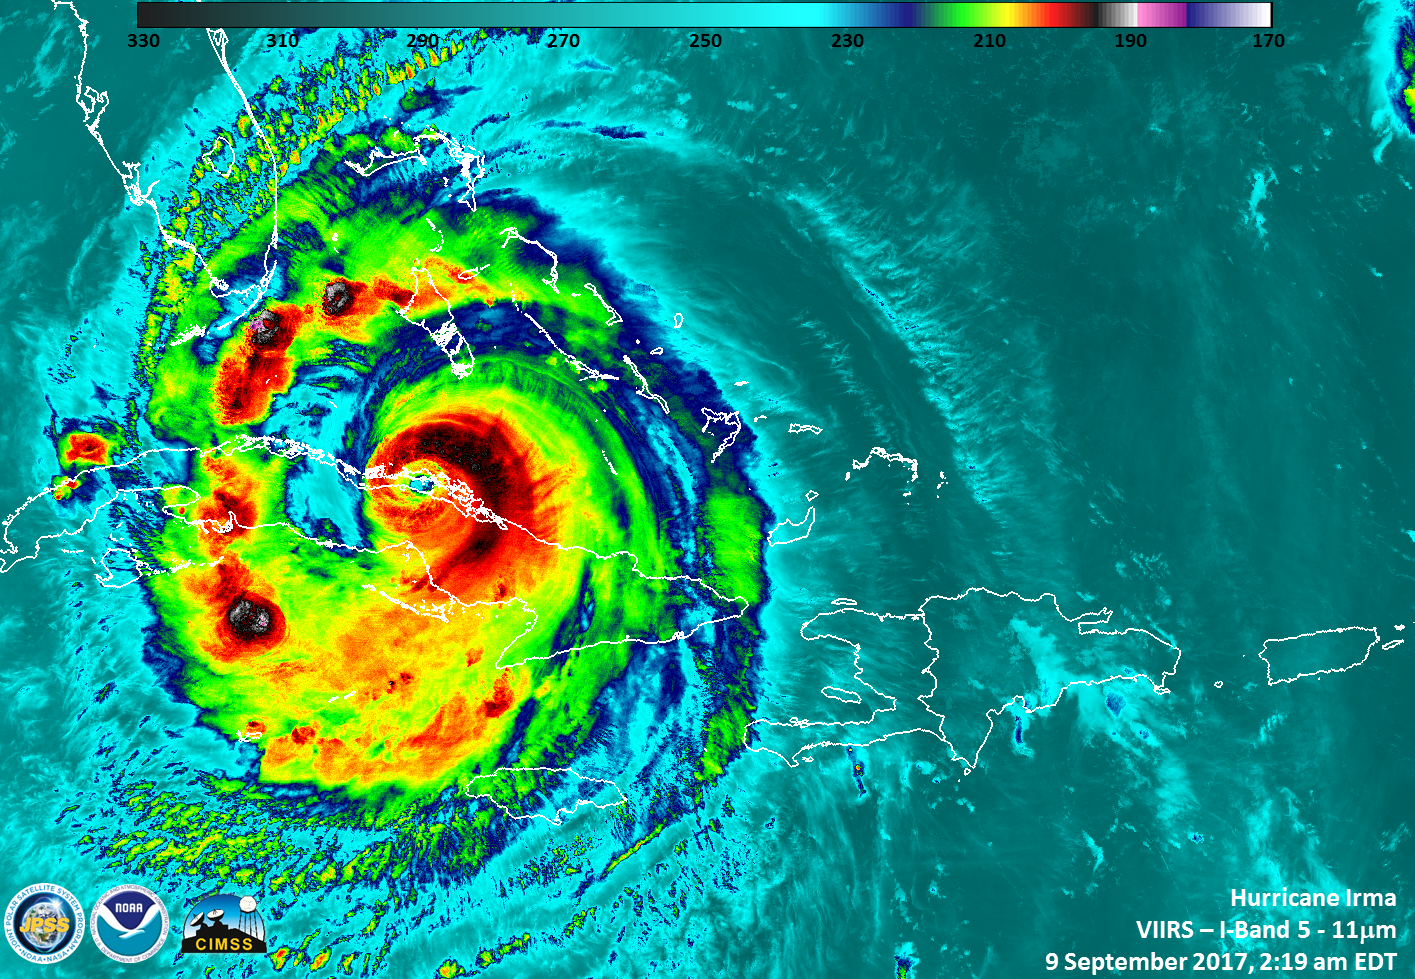
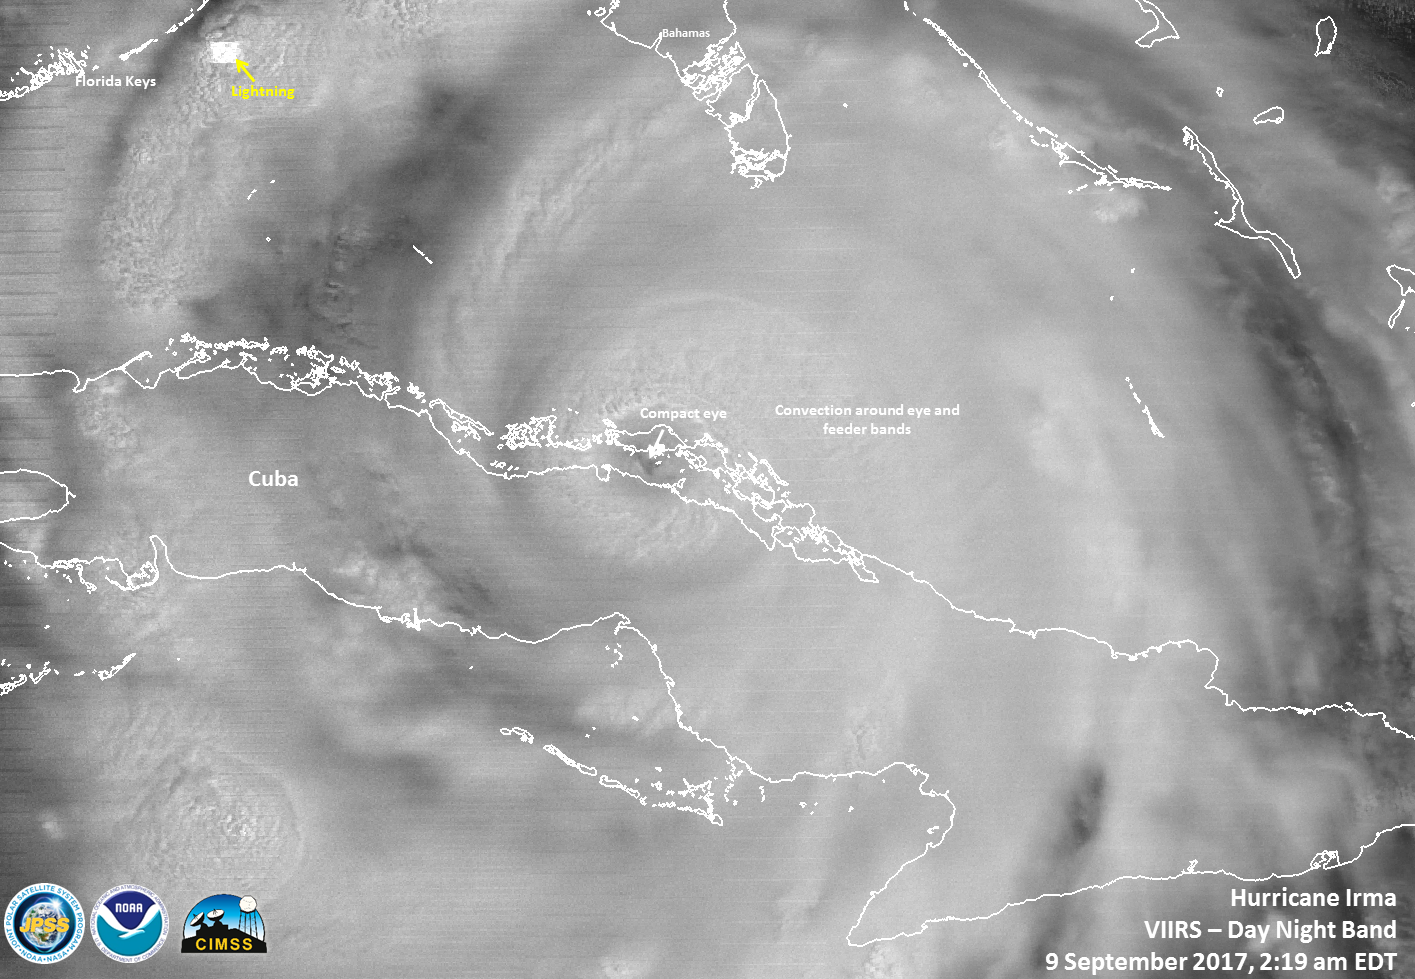
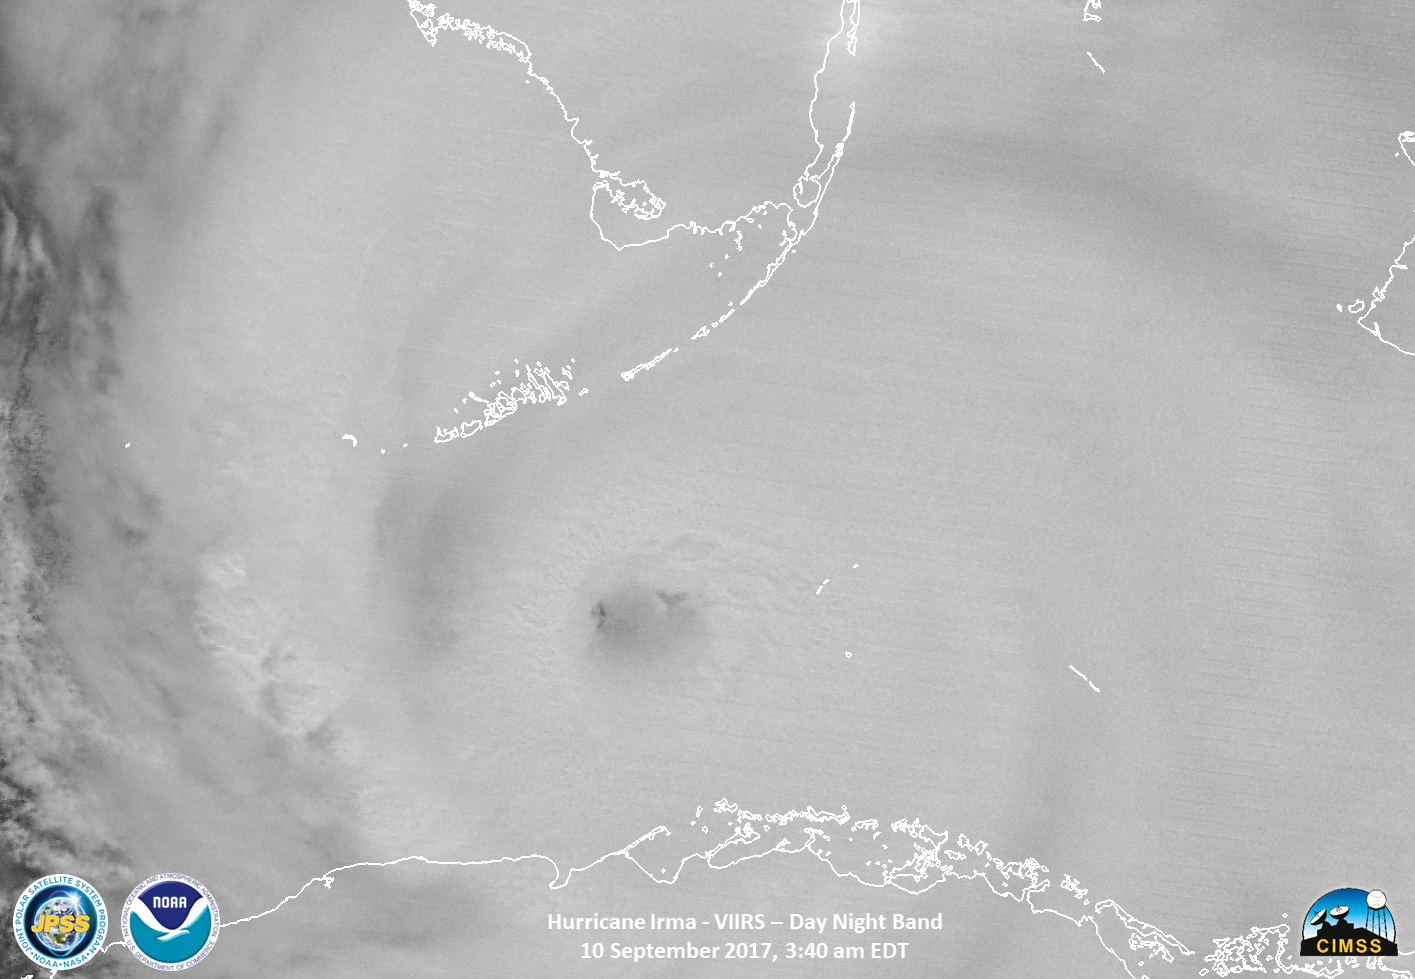
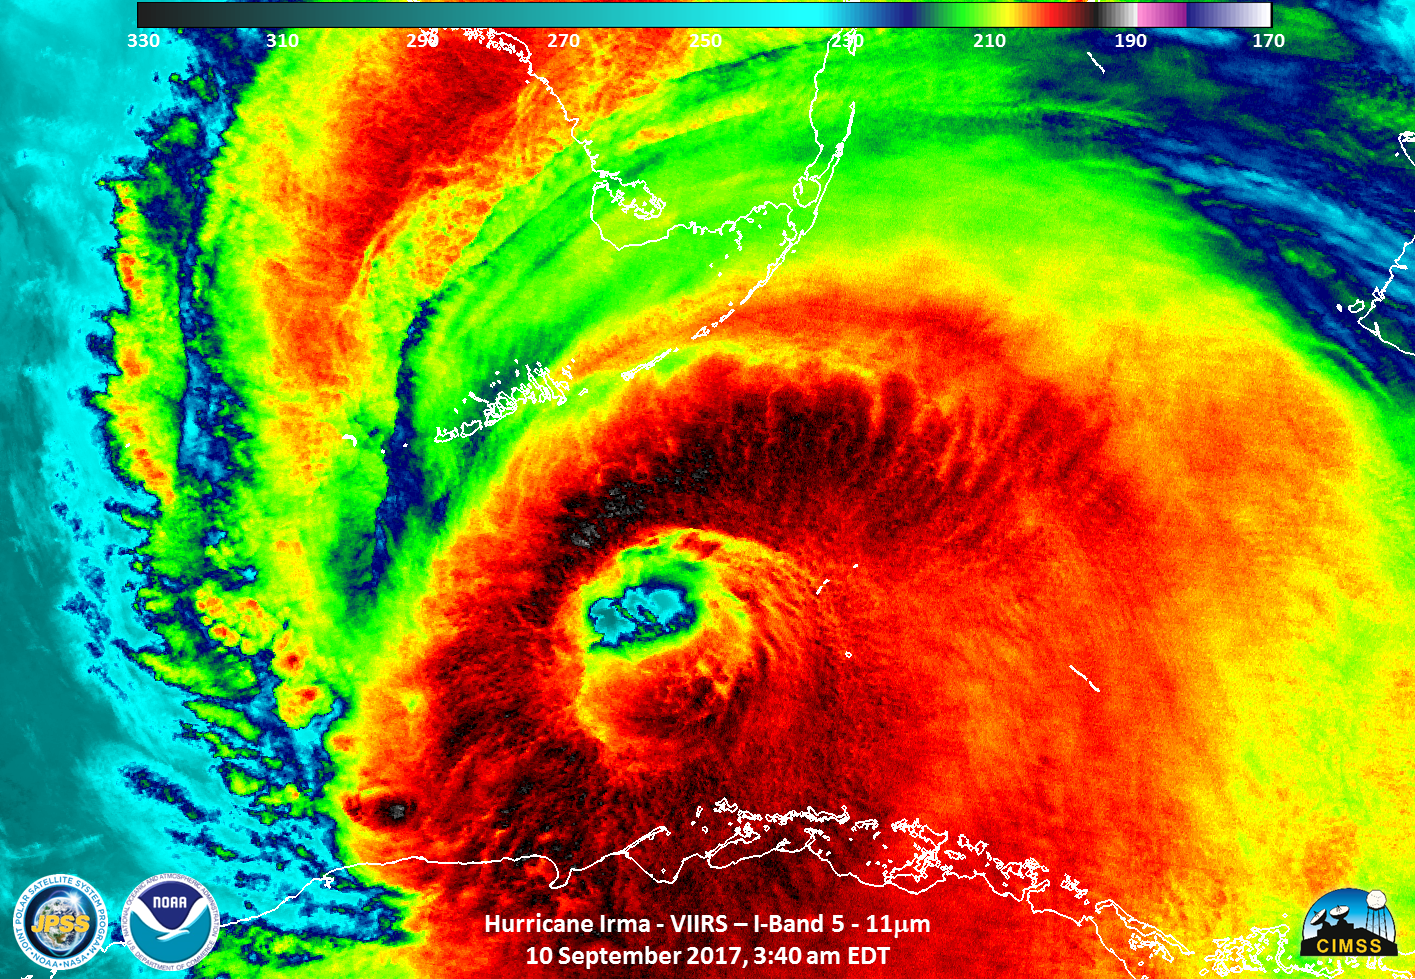
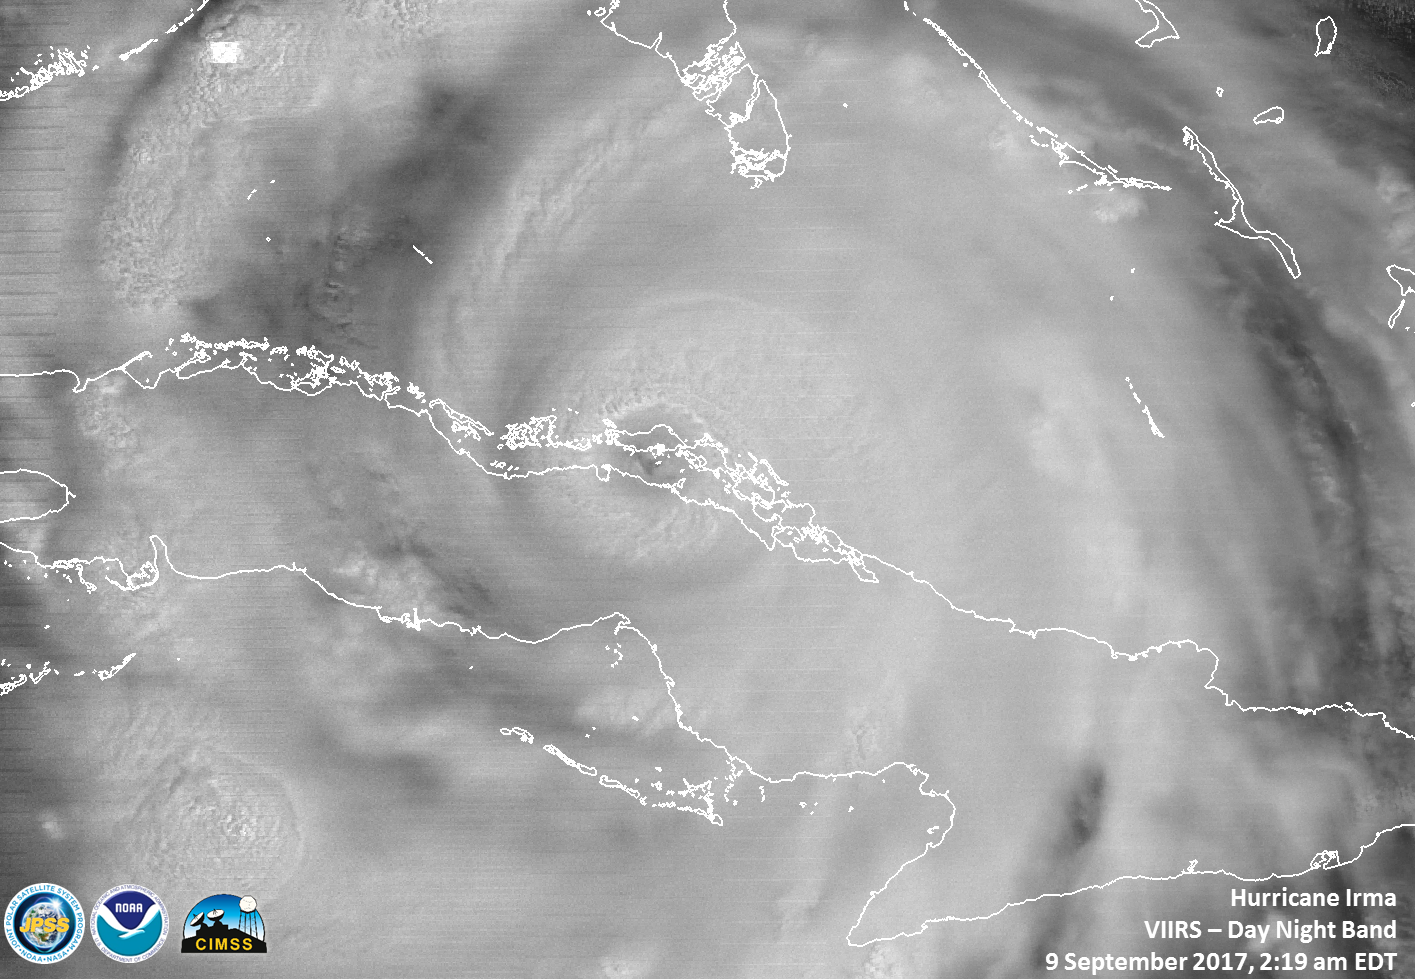
Suomi NPP overflew Irma at 0740 UTC on 10 September, and Day/Night Band Visible Imagery (0.70 µm) is toggled with Infrared Imagery (11.45 µm) over the eye, below.

Suomi NPP Imagery over the eye of Irma: Day/Night Band Visible (0.70 µm) and Infrared (11.45 µm), 0740 UTC on 10 September (Click to enlarge)
Suomi NPP Imagery: Day/Night Band Visible (0.70 µm) and Infrared (11.45 µm), 0740 UTC on 10 September (Click to enlarge)
During the subsequent daytime hours, VIIRS Visible (0.64 µm) and Infrared Window (11.45 µm) images at 1855 UTC, below, showed the eye of Category 3 Hurricane Irma about 40 minutes prior to landfall at Marco Island, Florida.
Suomi NPP VIIRS Visible (0.64 µm) and Infrared Window (11.45 µm) images (Click to enlarge)
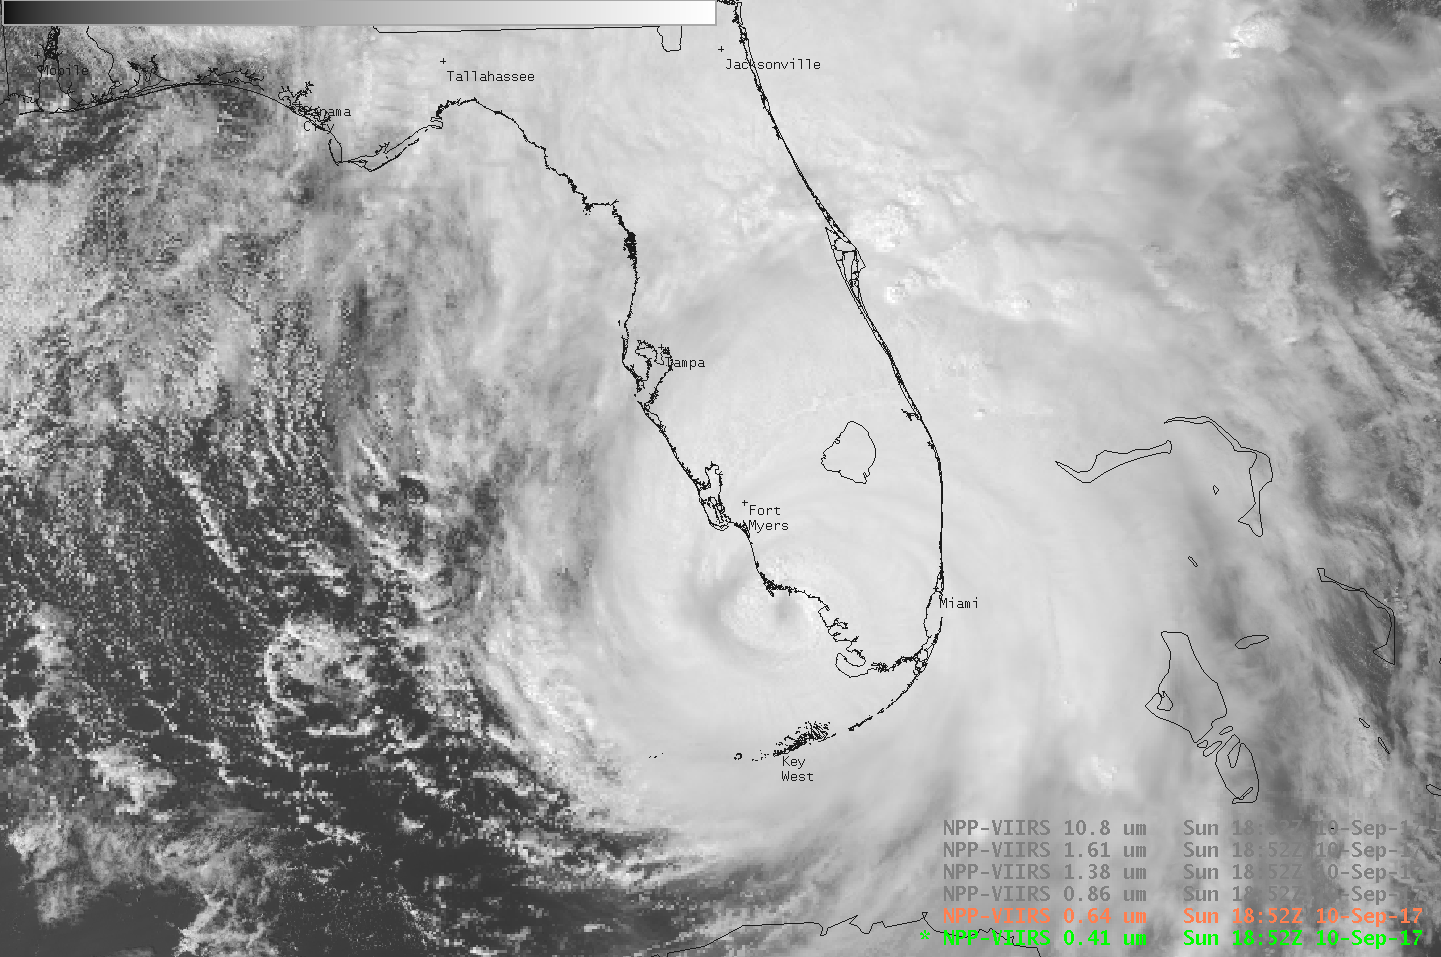
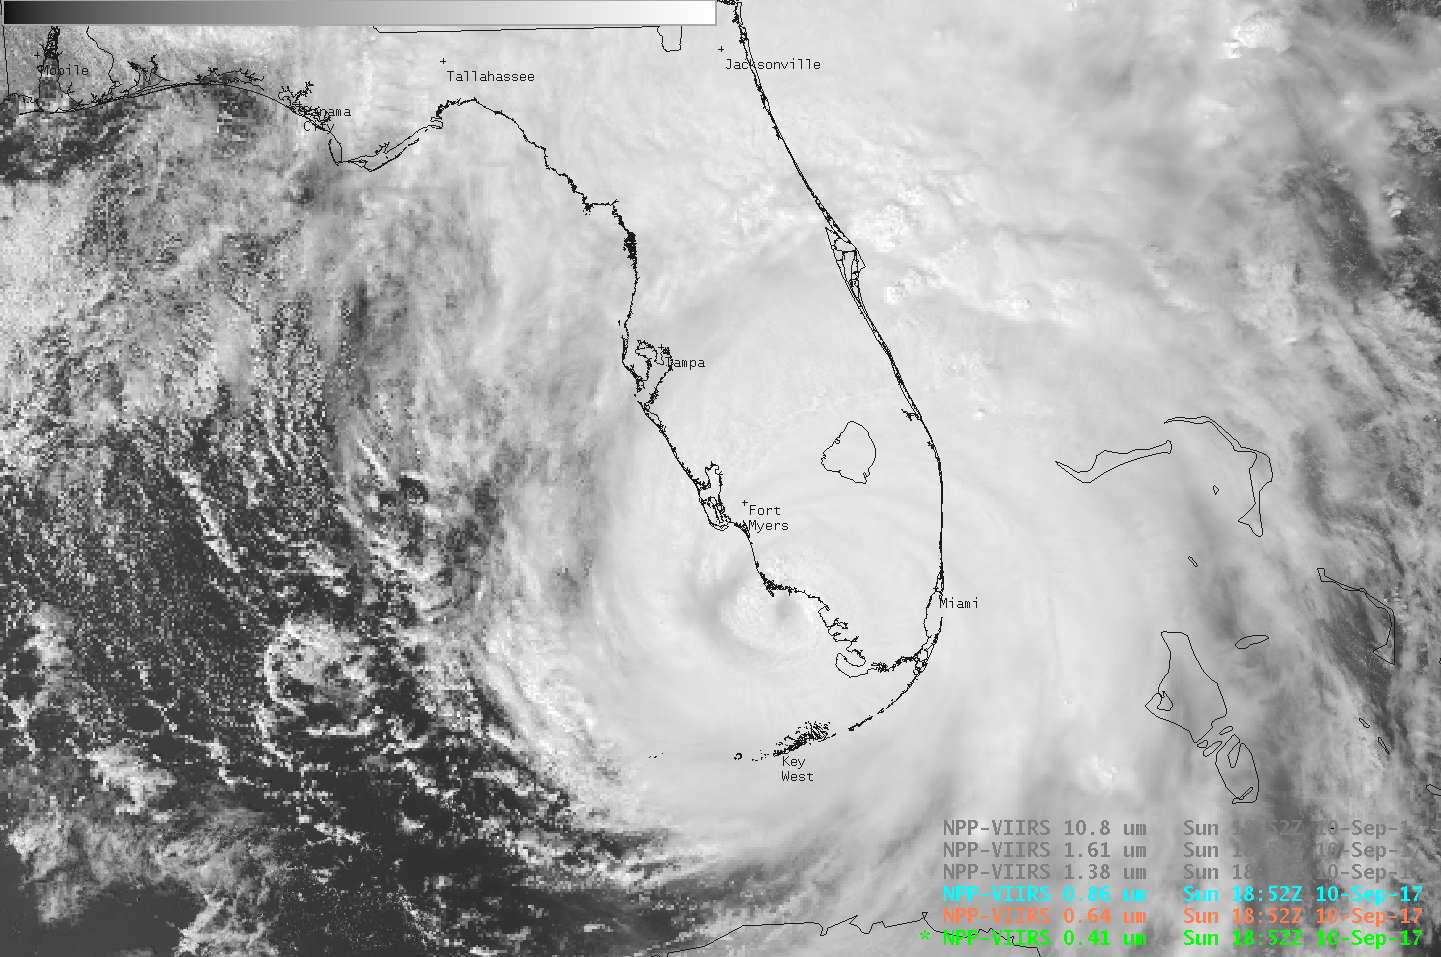
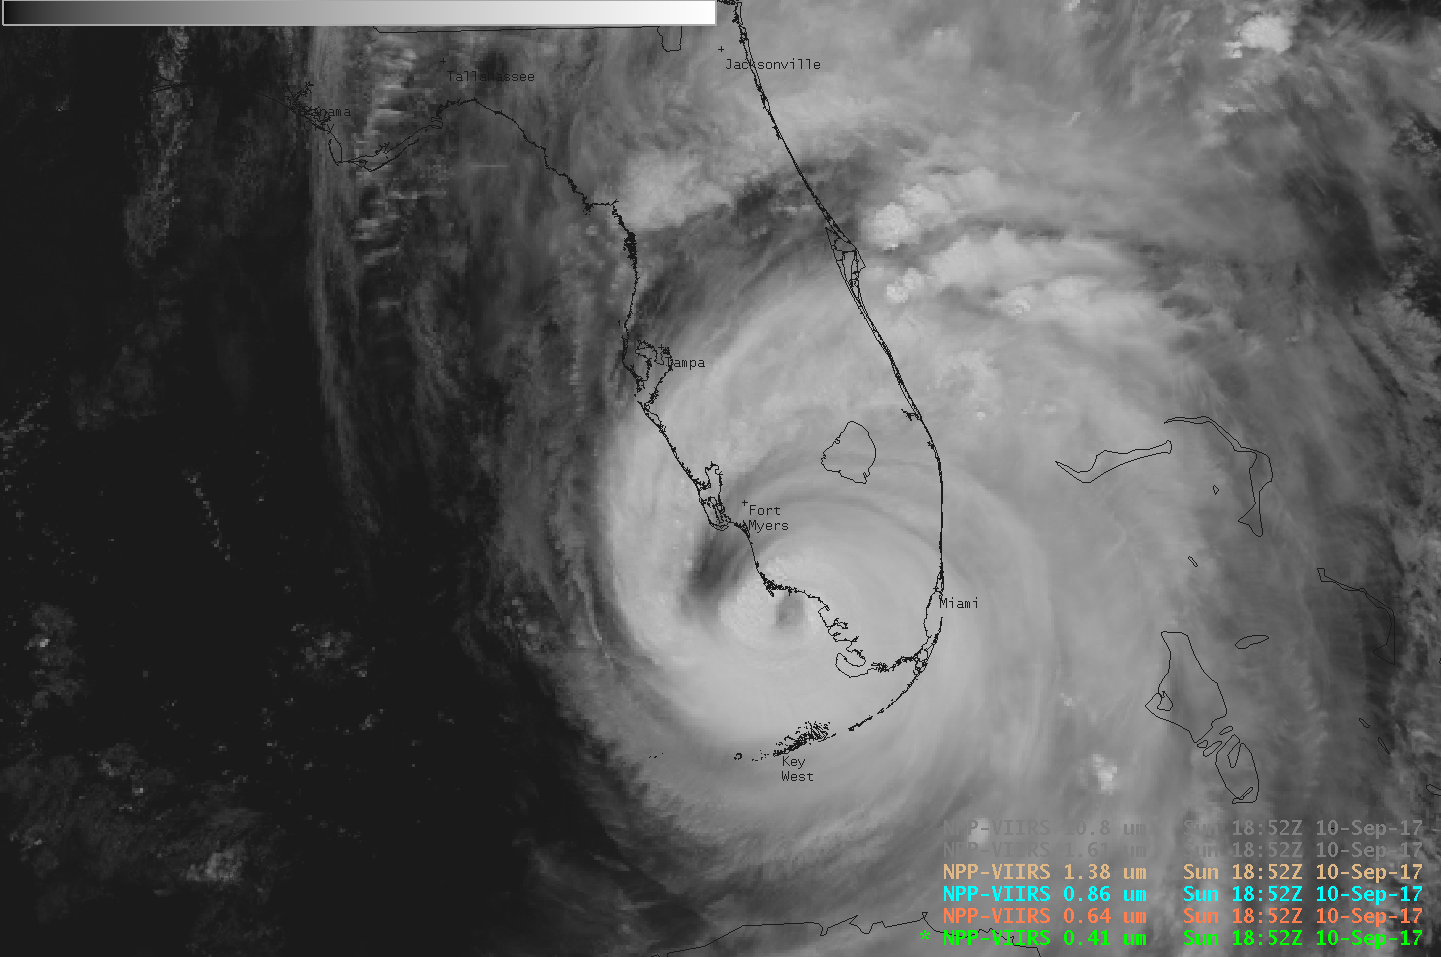
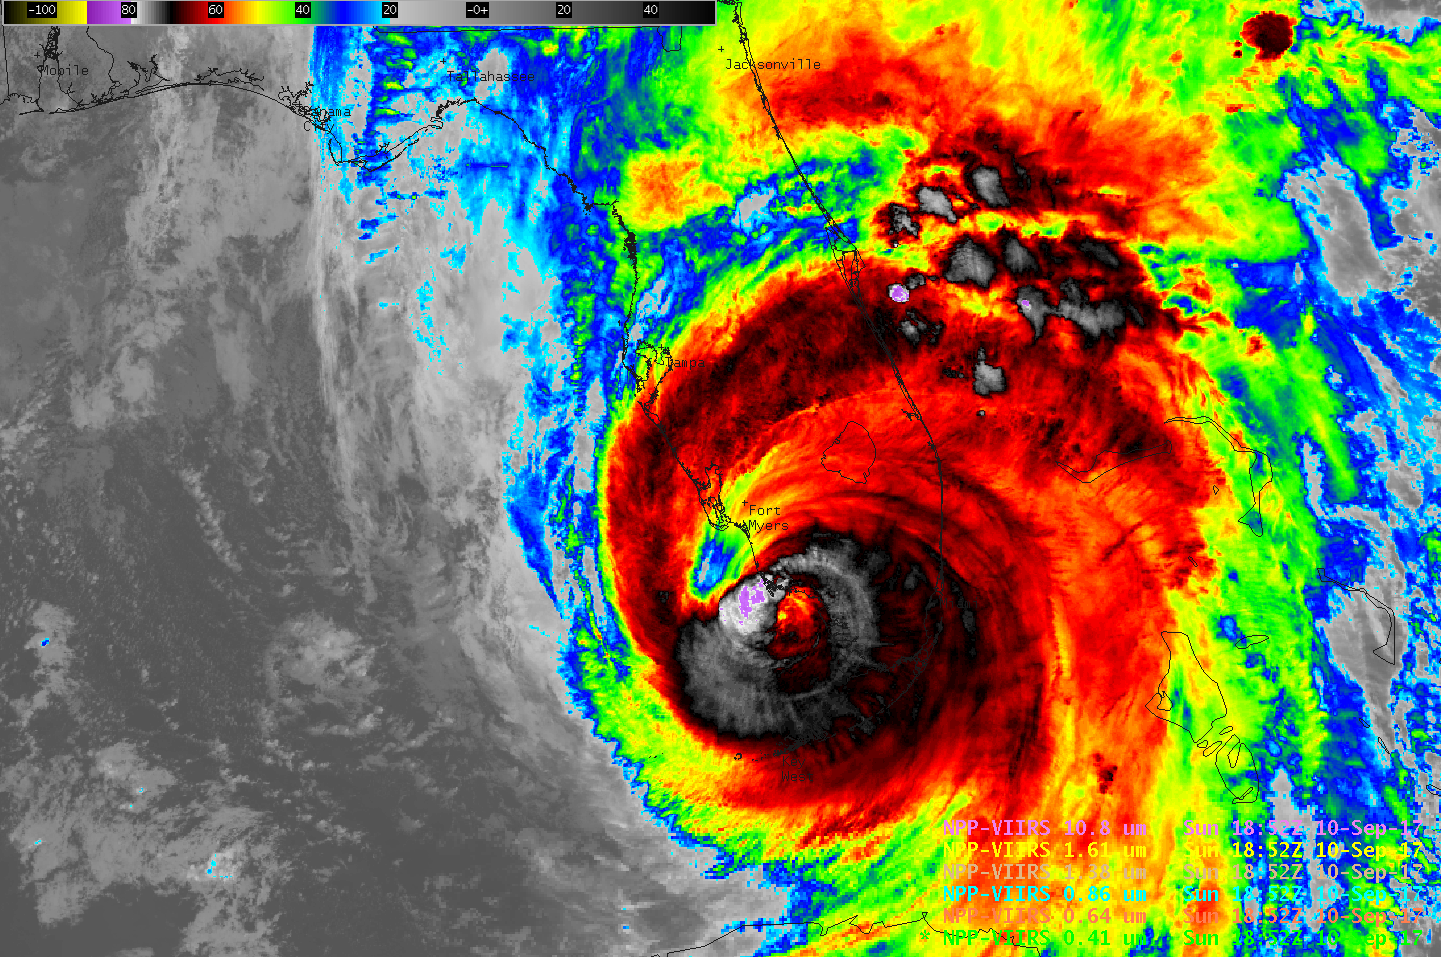
A toggle through 6 different Suomi NPP Channels near the time of landfall (0.41 µm, 0.64 µm, 0.86 µm, 1.38 µm, 1.61 µm and 10.8 µm) is shown below.
Suomi NPP VIIRS Imagery at 1852 UTC on 10 September 2017: 0.41 µm, 0.64 µm, 0.86 µm, 1.38 µm, 1.61 µm and 10.8 µm) (Click to enlarge)
View only this post Read Less


