As a cold front moved rapidly southward across the Great Plains (surface analyses) on 05 February 2018, the signature of a deep-tropospheric lee-side cold frontal gravity wave (reference) could be seen on GOES-16 Low-level (7.3 µm), Mid-level (6.9 µm) and Upper-level (6.2 µm) Water Vapor images (above; also available as an MP4 animation). In addition, the initial... Read More
![GOES-16 Low-level (7.3 µm, left), Mid-level (6.9 µm, middle) and Upper-level (6.2 µm, right) Water Vapor images, with hourly surface wind barbs plotted in cyan [click to play animation]](https://cimss.ssec.wisc.edu/satellite-blog/wp-content/uploads/sites/5/2018/02/G16_WATER_VAPOR_PLAINS_LEE_GW_05FEB2018_960x427_B1098_2018036_181228_0003PANELS_00063.GIF)
GOES-16 Low-level (7.3 µm, left), Mid-level (6.9 µm, middle) and Upper-level (6.2 µm, right) Water Vapor images, with hourly surface wind barbs plotted in cyan [click to play animation]
As a cold front moved rapidly southward across the Great Plains (
surface analyses) on
05 February 2018, the signature of a deep-tropospheric lee-side cold frontal gravity wave (
reference) could be seen on GOES-16 Low-level (
7.3 µm), Mid-level (
6.9 µm) and Upper-level (
6.2 µm) Water Vapor images
(above; also available as an MP4 animation). In addition, the initial gravity wave was soon followed by a secondary lee-side gravity wave, which could be seen moving southward over the northern Texas Panhandle by the end of the animation.
Plots of the weighting function (or “contribution function”) for each of the three GOES-16 Water Vapor bands (below) are calculated using 05 February/12 UTC rawinsonde data from Dodge City, Kansas — which was south of the cold front at that time. The peak pressure level for all three weighting function plots was in the 442-497 hPa range, giving some indication of the depth of these vertically-propagating gravity waves.
![Weighting function plots for each of the three GOES-16 Water Vapor bands, calculated using 05 February/12 UTC rawinsonde data from Dodge City, Kansas [click to enlarge]](https://cimss.ssec.wisc.edu/satellite-blog/wp-content/uploads/sites/5/2018/02/180205_12utc_kddc_wv_wf.jpeg)
Weighting function plots for each of the three GOES-16 Water Vapor bands, calculated using 05 February/12 UTC rawinsonde data from Dodge City, Kansas [click to enlarge]
GOES-16 Water Vapor weighting functions using 06 February/00 UTC rawinsonde data from Amarillo, Texas — where the surface cold front had passed about 3 hours earlier — are shown below. Note that in the
drier post-frontal air mass, the peak pressures for the 3 water vapor bands had increased, descending to the 477 to 684 hPa pressure levels. This
comparison helps to underscore the dependence of water vapor weighting function height on the temperature and/or moisture profile of the atmosphere.
![Weighting function plots for each of the three GOES-16 Water Vapor bands, calculated using 06 February/00 UTC rawinsonde data from Amarillo, Texas [click to enlarge]](https://cimss.ssec.wisc.edu/satellite-blog/wp-content/uploads/sites/5/2018/02/180206_00utc_kama_wv_wf.jpeg)
Weighting function plots for each of the three GOES-16 Water Vapor bands, calculated using 06 February/00 UTC rawinsonde data from Amarillo, Texas [click to enlarge]
View only this post
Read Less
![GOES-16 Low-level (7.3 µm, left), Mid-level (6.9 µm, middle) and Upper-level (6.2 µm, right) Water Vapor images, with hourly surface wind barbs plotted in cyan [click to play animation]](https://cimss.ssec.wisc.edu/satellite-blog/wp-content/uploads/sites/5/2018/02/180205_goes16_water_vapor_surface_winds_Plains_lee_side_gravity_wave_anim.gif)
![GOES-16 "Red" Visible (0.64 µm) images, with plots of hourly surface reports [click to play animation]](https://cimss.ssec.wisc.edu/satellite-blog/wp-content/uploads/sites/5/2018/02/180204_goes16_visible_western_Lake_Superior_ice_anim.gif)
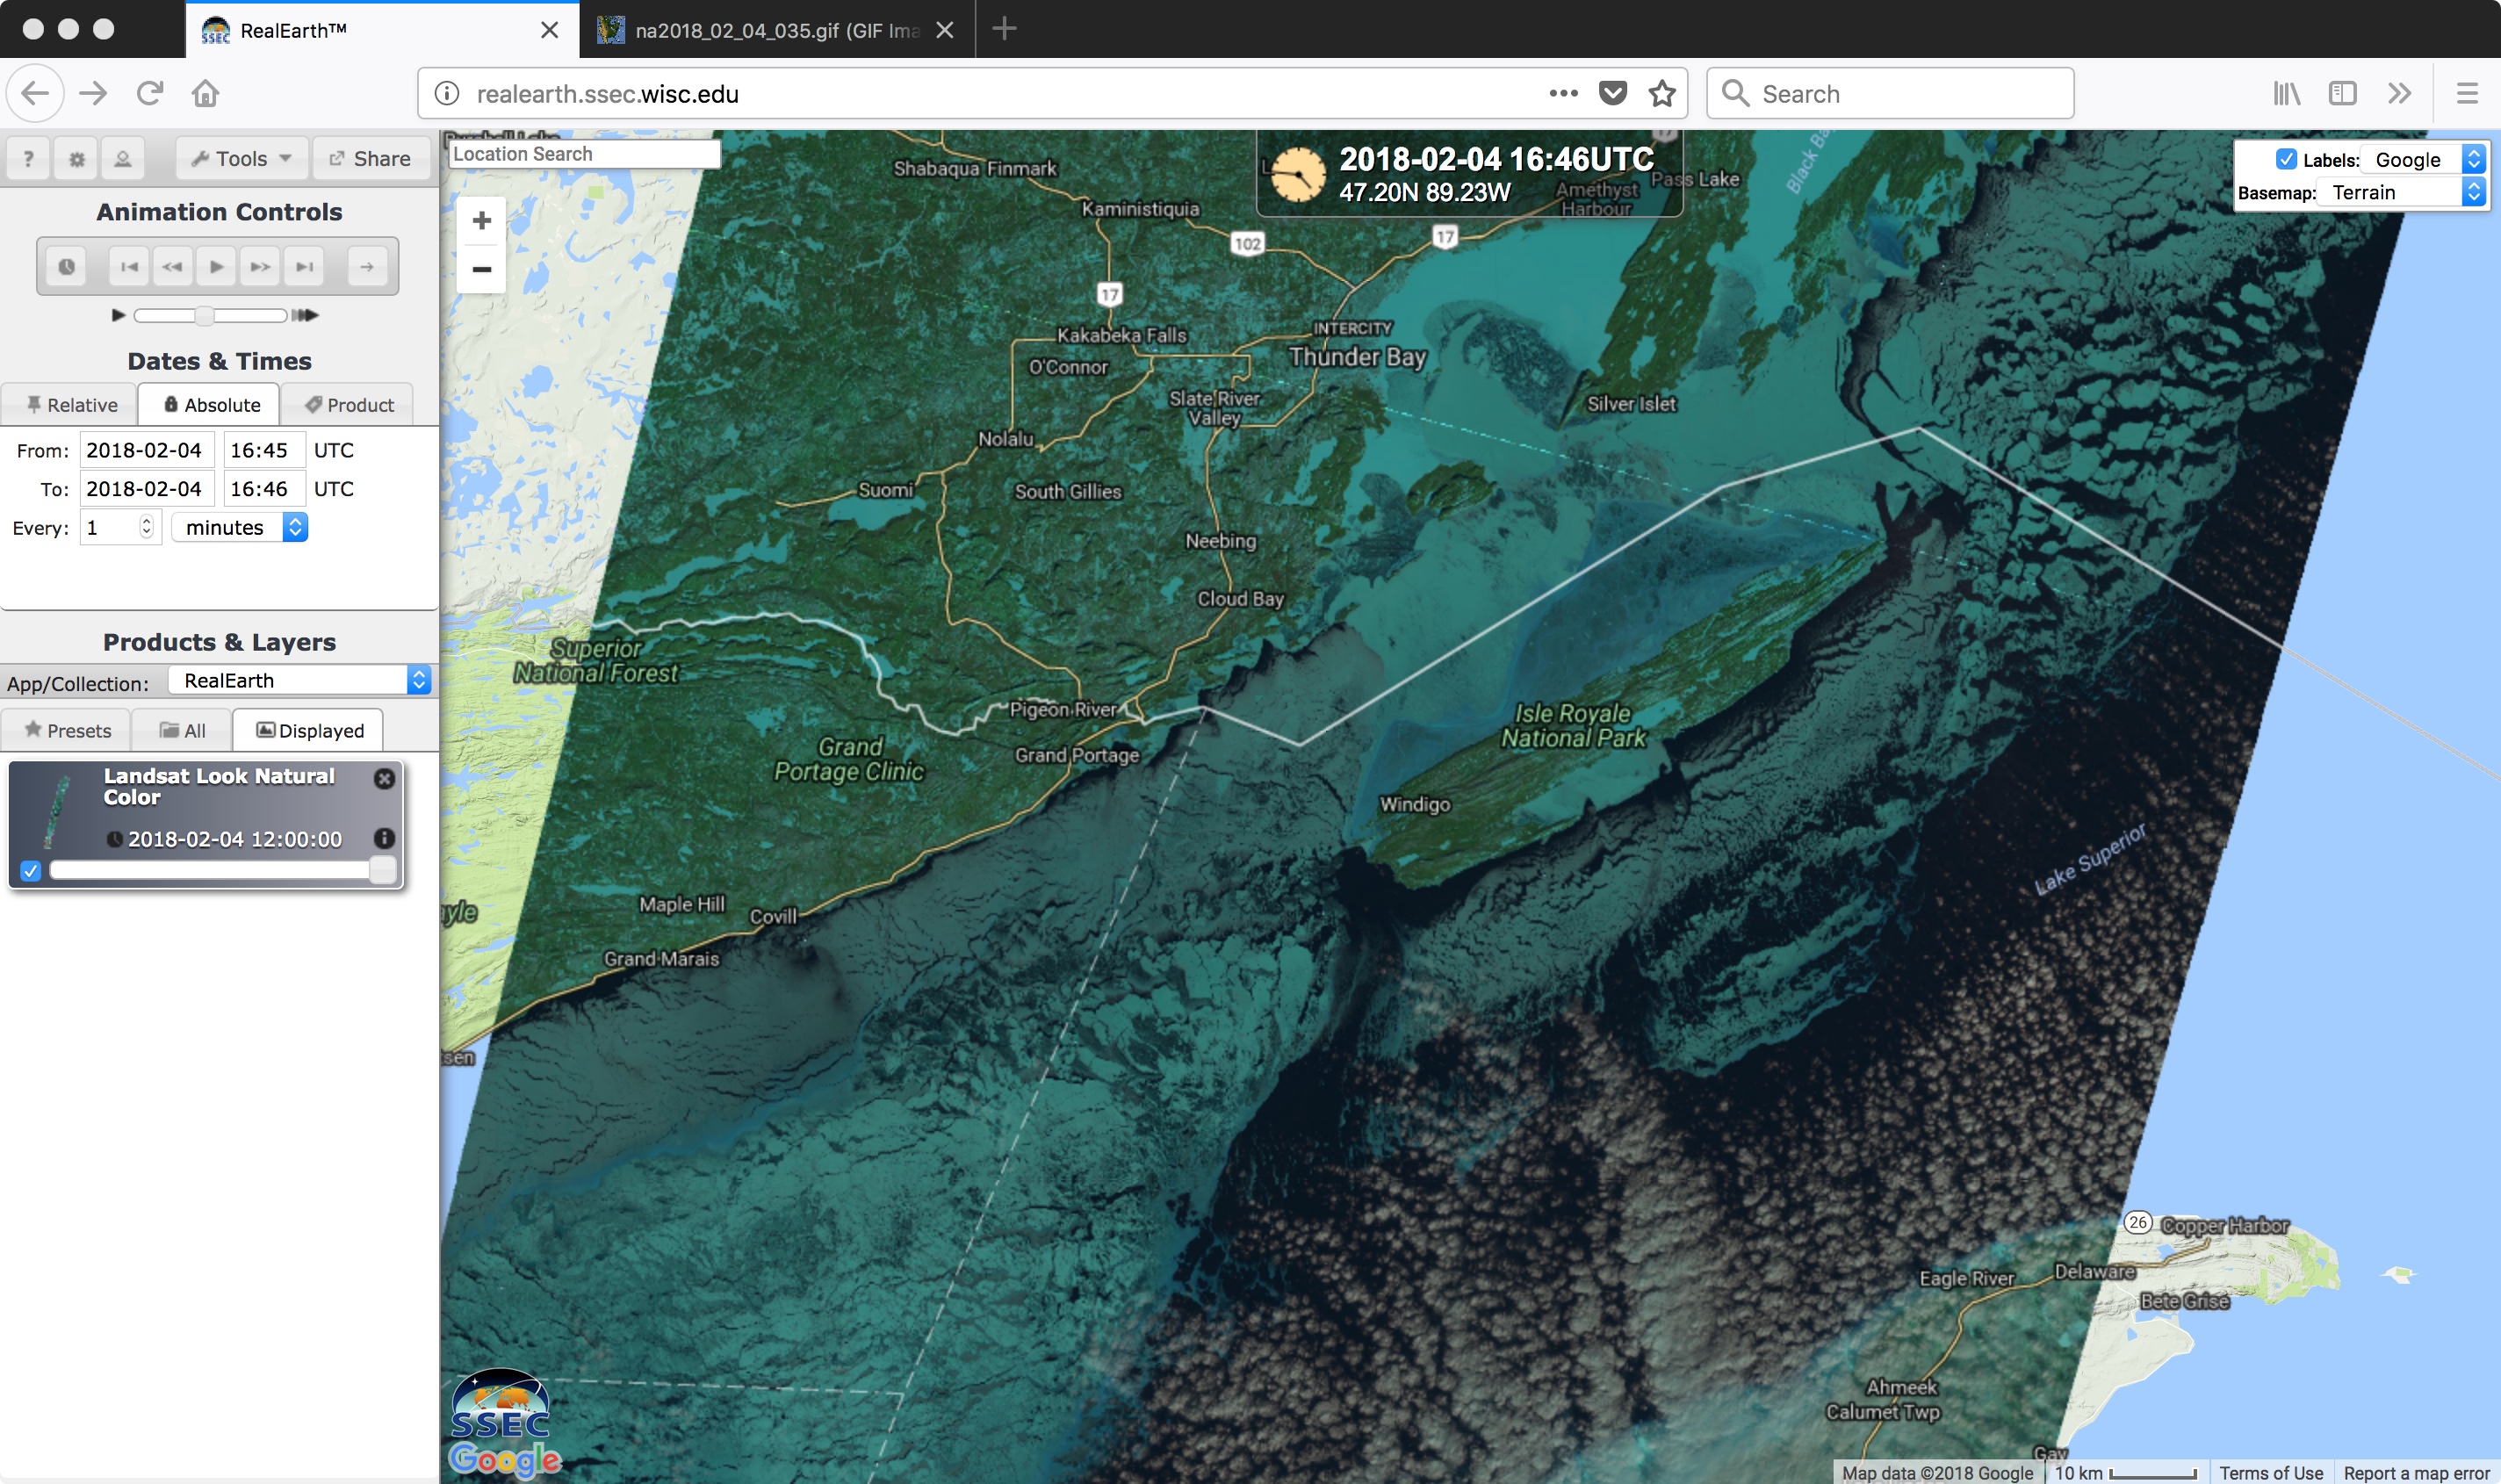
![Landsat-8 False-color RGB image [click to enlarge]](https://cimss.ssec.wisc.edu/satellite-blog/wp-content/uploads/sites/5/2018/02/180204_1646utc_landsat8_falsecolor_Lake_Superior_ice.jpeg)
![Landsat-8 False-color RGB image [click to enlarge]](https://cimss.ssec.wisc.edu/satellite-blog/wp-content/uploads/sites/5/2018/02/180204_landsat8_zoom_1.jpeg)
![Landsat-8 False-color RGB image [click to enlarge]](https://cimss.ssec.wisc.edu/satellite-blog/wp-content/uploads/sites/5/2018/02/180204_landsat8_zoom_2.jpeg)
![Landsat-8 False-color RGB image [click to enlarge]](https://cimss.ssec.wisc.edu/satellite-blog/wp-content/uploads/sites/5/2018/02/180204_landsat8_zoom_3.jpeg)
![Landsat-8 False-color RGB image [click to enlarge]](https://cimss.ssec.wisc.edu/satellite-blog/wp-content/uploads/sites/5/2018/02/180204_landsat8_zoom_4.jpeg)
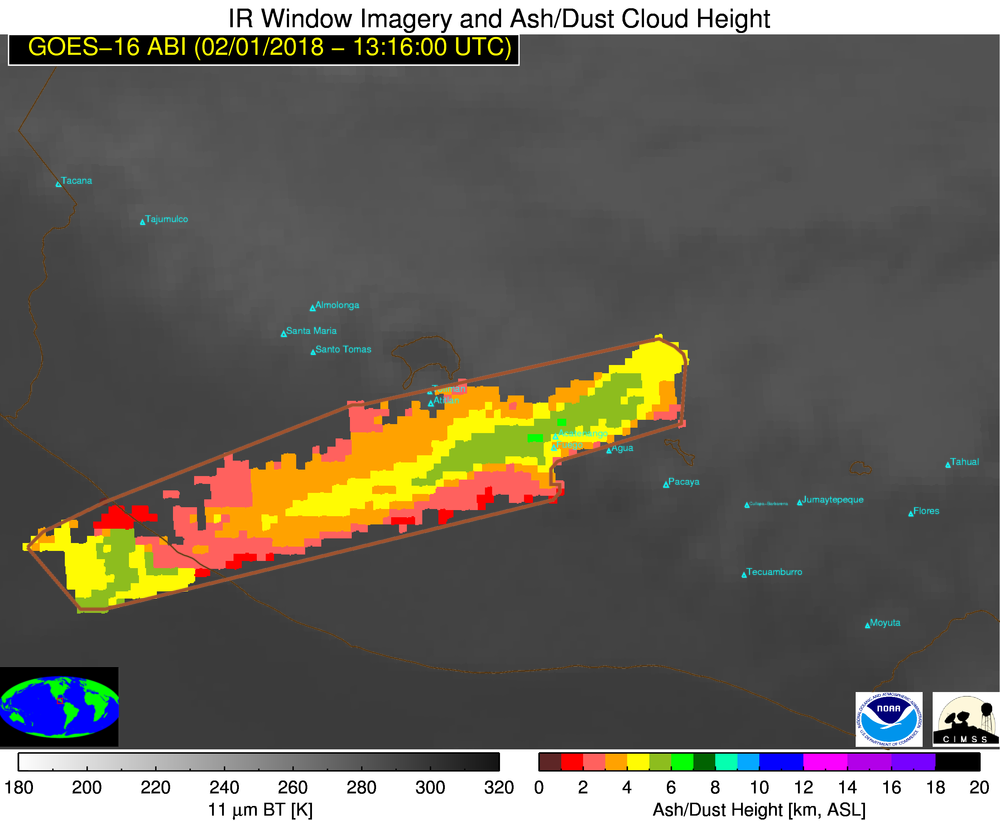
![GOES-16 Ash Height product [click to animate]](https://cimss.ssec.wisc.edu/satellite-blog/wp-content/uploads/sites/5/2018/02/180201_goes16_Fuego_ash_height_anim.gif)
![Landsat-8 False-color RGB image [click to enlarge]](https://cimss.ssec.wisc.edu/satellite-blog/wp-content/uploads/sites/5/2018/02/180201_1624utc_landsat8_falsecolor_anim.gif)

![GOES-16 Low-level (7.3 µm, left), Mid-level (6.9 µm, center) and Upper-level (6.2 µm) images [click to play MP4 animation]](https://cimss.ssec.wisc.edu/satellite-blog/wp-content/uploads/sites/5/2018/01/G16_WATER_VAPOR_ATL_LOW_29AN2018_EXP_960x427_B1098_2018029_150043_0003PANELS_00061.GIF)
![GOES-16 Deep-layer Wind Shear products [click to play animation]](https://cimss.ssec.wisc.edu/satellite-blog/wp-content/uploads/sites/5/2018/01/180129_goes16_deep_layer_shear_anim.gif)
