This website works best with a newer web browser such as Chrome, Firefox, Safari or Microsoft Edge. Internet Explorer is not supported by this website.

Severe thunderstorms in Nebraska and Iowa

1-minute Mesoscale Domain Sector GOES-19 (GOES-East) “Red” Visible (0.64 µm) images (above) showed 2 supercell thunderstorms that produced numerous tornadoes, hail to 4.00″ in diameter and wind gusts to 86 mph (SPC Storm Reports | NWS Omaha event summary) across parts of eastern Nebraska and western Iowa on 17 April 2025. Pulses of overshooting tops in addition... Read More

1-minute GOES-19 “Red” Visible (0.64 µm) images with time-matched (+/- 3 minutes) SPC Storm Reports plotted in red, from 2200 UTC on 17 April to 0056 UTC on 18 April [click to play animated GIF | MP4]

1-minute Mesoscale Domain Sector GOES-19 (GOES-East) “Red” Visible (0.64 µm) images (above) showed 2 supercell thunderstorms that produced numerous tornadoes, hail to 4.00″ in diameter and wind gusts to 86 mph (SPC Storm Reports | NWS Omaha event summary) across parts of eastern Nebraska and western Iowa on 17 April 2025. Pulses of overshooting tops in addition to Above-Anvil Cirrus Plumes were apparent with these thunderstorms.

In the corresponding 1-minute GOES-19 “Clean” Infrared Window (10.3 µm) images (below), the coldest cloud-top infrared brightness temperatures associated with some of the pulsing overshooting tops were in the -75 to -78ºC range.

1-minute GOES-19 “Clean” Infrared Window (10.3 µm) images with time-matched (+/- 3 minutes) SPC Storm Reports plotted in white, from 2200 UTC on 17 April to 0211 UTC on 18 April [click to play animated GIF | MP4]

In a toggle between GOES-19 Visible and Infrared images at 2322 UTC (below), there was a pronounced “warm trench” immediately downwind (east) of the cold overshooting top associated with the northernmost supercell thunderstorm. Hail of 2.75″ in diameter and a wind gust of 82 mph were reported near the overshooting top/warm trench around the time of these two GOES-19 images (note: the SPC Storm Reports are plotted at their surface location, and are not corrected for storm-top parallax).

GOES-19 Visible and Infrared images at 2322 UTC on 17 April [click to enlarge]

The 2322 UTC GOES-19 Infrared image with labels of cloud-top infrared brightness temperatures of the cold overshooting top (-74.1 ºC) and adjacent downwind warm trench (-51.1 ºC) is shown below.

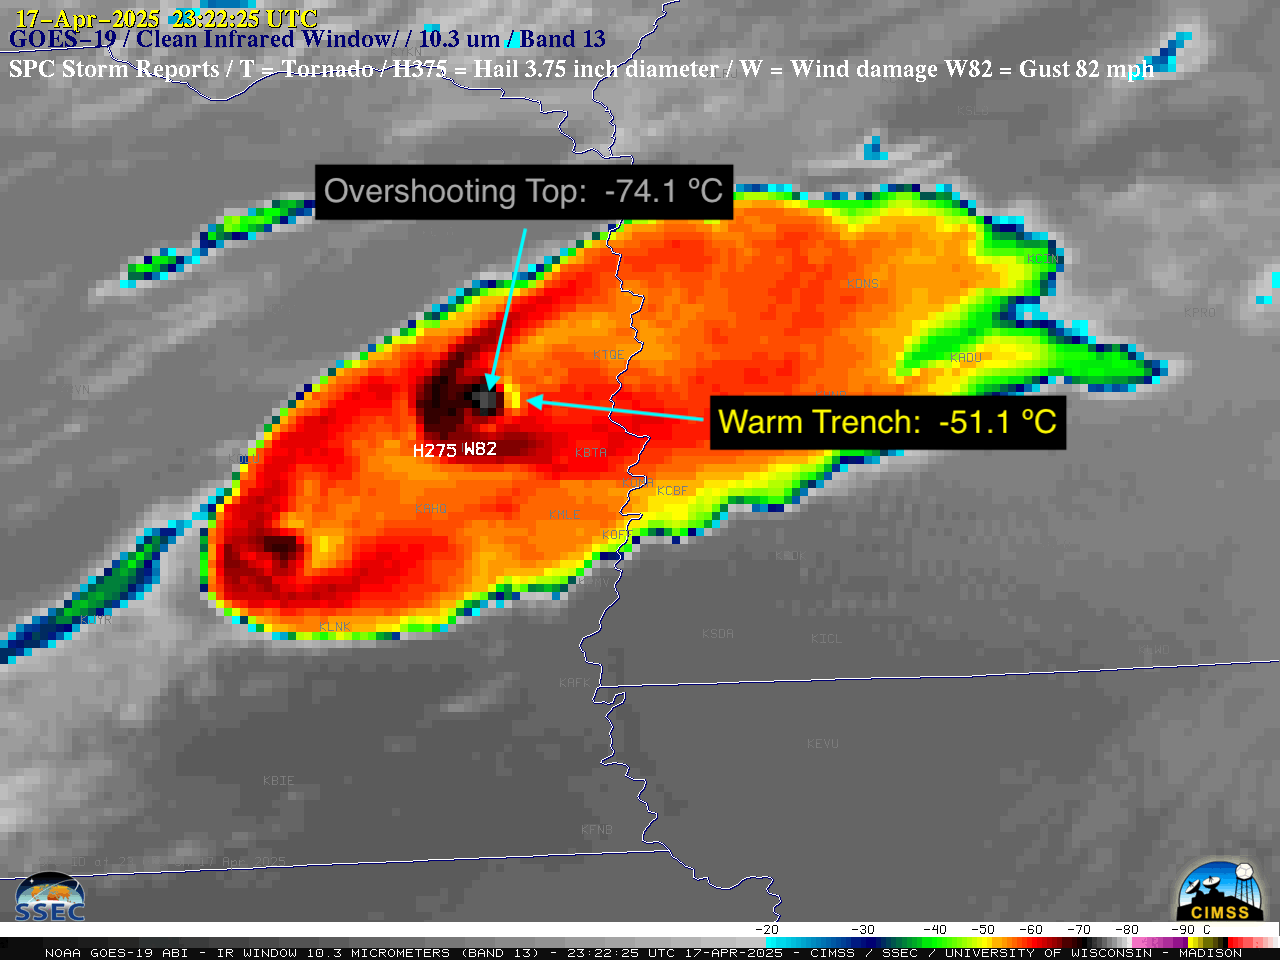
GOES-19 Infrared image at 2322 UTC on 17 April, with labels of cloud-top infrared brightness temperatures of the overshooting top and adjacent downwind warm trench [click to enlarge]

According to a plot of 2000 UTC rawinsonde data from Omaha, Nebraska (below), the coldest cloud-top infrared brightness temperatures of -78ºC represented a ~2 km overshoot of the Most Unstable air parcel Equilibrium Level (MU EL).

Plot of Omaha, Nebraska rawinsonde data at 2000 UTC on 17 April [click to enlarge]

View only this post Read Less

Blowing dust across New Mexico and Texas

5-minute CONUS Sector GOES-19 (GOES-East) daytime True Color RGB images created using Geo2Grid (above) provided a distinct view of widespread blowing dust that spread northeastward across much of New Mexico during the day on 17 April 2025 — eventually reaching the Texas/Oklahoma Panhandles (and even southeast Colorado and southwest Kansas). After sunset,... Read More

5-minute GOES-19 daytime True Color RGB + nighttime Dust RGB images, from 1801 UTC on 17 April to 0601 UTC on 18 April [click to play animated GIF | MP4]

5-minute CONUS Sector GOES-19 (GOES-East) daytime True Color RGB images created using Geo2Grid (above) provided a distinct view of widespread blowing dust that spread northeastward across much of New Mexico during the day on 17 April 2025 — eventually reaching the Texas/Oklahoma Panhandles (and even southeast Colorado and southwest Kansas). After sunset, Dust RGB images highlighted the airborne dust as brighter shades of magenta.

1-minute Mesoscale Domain Sector GOES-19 Visible images (below) included plots showing the strong winds which produced blowing dust. In southwestern New Mexico this blowing dust caused marked reductions in visibility, leading to the closure of several highways — including Interstate 10 near Deming KDMN (where a fatal vehicular accident occurred).

1-minute GOES-19 Red Visible (0.64 µm) images with plots of 30-minute Peak Wind gusts (yellow/red) and hourly Ceiling/Visibility/Weather (cyan) from 1931 UTC on 17 April to 0030 UTC on 18 April; Interstate highways are plotted in violet [click to play MP4 animation]

View only this post Read Less

Ice clings to life in the lower Great Lakes

True-color imagery over Lakes Erie/Ontario shows a white patch backed into extreme eastern Lake Erie, and also in Lake Ontario at the mouth of the Niagara River. White patches also exist over inland portions of New York, between Fredonia and Houghton. Are these white regions clouds or snow? Visible imagery,... Read More

VIIRS True-Color imagery, 1639 UTC on 17 April 2025 (Click to enlarge)

True-color imagery over Lakes Erie/Ontario shows a white patch backed into extreme eastern Lake Erie, and also in Lake Ontario at the mouth of the Niagara River. White patches also exist over inland portions of New York, between Fredonia and Houghton. Are these white regions clouds or snow? Visible imagery, (I01 imagery at 0.64 µm) shown below in a toggle with near-infrared imagery at 1.61 (I03 VIIRS data), shows highly reflective regions in the visible that are absorbing (rather than reflecting) energy at 1.61 µm. The snow over western New York between Fredonia and Houghton is dark in the I03 imagery — and the reflective signal over Lakes Erie and Ontario south of Buffalo and at the mouth of the Niagara River is much diminished or missing altogether. This is likely ice, or snow on top of ice.

I01 (0.64 µm) and I03 (1.61 µm) over western New York and adjacent Great Lakes, 1638 UTC on 17 April 2025 (Click to enlarge)

VIIRS False-Color imagery (in reality, the Day Land Cloud RGB), shows the cyan color expected with ice features in that small corner of Lake Erie, over the remnant snow over western New York and also in the outflow from the Niagara River.

VIIRS “False-Color” imagery, 1639 UTC on 17 April 2025 (Click to enlarge)

A screengrab from the webcam at Fort Niagara on Lake Ontario (here) shows the near-shore ice (revealed by the webcam to be drifting to the east).

Screencapture of the Fort Niagara webcam from 1826 UTC on 17 April 2025 (Click to enlarge)

True Color imagery from the 1755 UTC overpass over all the Great Lakes, below, shows that ice is confined to the small patch over eastern Lake Erie, over parts of the North Channel of Lake Huron, extreme eastern Lake Superior where that lake drains into the St Mary’s River, and some of the bays along the western Lake Superior shore, such as Black Bay.

VIIRS True Color imagery, 1755 UTC on 17 April 2025 (Click to enlarge)

One of the reasons ice is flowing down the Niagara River: The Buffalo Ice Boom has been removed (press release). A screen capture from a Buffalo webcam showing the Niagara River is below, and I thank Michael Fries, MIC at WFO BUF for this information.

Webcam imagery at Exit 14 of I-190 showing the ice-clogged Niagara River

Thanks to Rick DiMaio for initially alerting us to this feature.

View only this post Read Less

Timely VIIRS imagery at the CIMSS DBPS website

The Direct Broadcast Processing System (DBPS) at SSEC/CIMSS now has a website (http://erb-dbps.ssec.wisc.edu/browser/MADISON/) that serves up VIIRS imagery and products that become available very quickly. As I type this at 2011 UTC, for example, NOAA-21 data from the 1937 UTC overpass is available. The animation below shows 3 different true-color... Read More

The Direct Broadcast Processing System (DBPS) at SSEC/CIMSS now has a website (http://erb-dbps.ssec.wisc.edu/browser/MADISON/) that serves up VIIRS imagery and products that become available very quickly. As I type this at 2011 UTC, for example, NOAA-21 data from the 1937 UTC overpass is available. The animation below shows 3 different true-color scenes (produced with polar2grid) over the midwestern United States. The greening of Spring has reached into southern Illinois, but snow-cover is still widespread over the Upper Peninsula of Michigan and much of Canada. Lakes in Minnesota still have ice cover, but those in Wisconsin are clear of ice.

True-color imagery over the midwestern United States, 1756-1844 UTC on 16 April 2025 (Click to enlarge)

Imagery from a variety of VIIRS channels, including the Day Night Band, are routinely produced. Satellites providing imagery also include Metop-B and Metop-C, NOAA-18 and NOAA-19, GCOM-W1 and Aqua. Microwave imagery is available, at 36.5 and 89 GHz (both horizontal and vertical polarities) as shown in the toggle below. In addition, level 2 products from MIRS can be accessed (Total Precipitable Water, Rain Rate, and microwave brightness temperatures at 31, 89, 157, 165, 183 and 191 GHz!)

GCOM-W1 AMSR-2 observations at 36.5 and 89.0 GHz, 1902 UTC on 16 April 2025 (Click to enlarge)

Perhaps you noticed the clear skies over the Great Lakes above and asked yourself: “I fancy a swim; I wonder what the Lake Surface Temperatures are?” AWIPS-ready tiles produced at CIMSS (by polar2grid) and displayed in AWIPS, below, show the answer. Lake Superior and most of Lake Huron have surface temperatures in the mid-30s (oF); Lake Michigan is a bit warmer, closer to 40oF, except along the far southern shore, where waters are just a bit warmer. Only western Lake Erie is uniformly “warm” with temperatures in the upper-40s to around 50. Enjoy your swim there. Lake Surface Temperatures are not yet at the DBPS site, but their implementation is planned.

VIIRS True Color imagery and derived Lake Surface Temperatures, 1816 UTC on 16 April 2025 (Click to enlarge)

VIIRS imagery is also available at the eosdb url: https://ftp.ssec.wisc.edu/pub/eosdb/; the latency at that site is not as quick as at the DBPS site because the DBPS site incorporates only data from the Direct Broadcast antenna at CIMSS, whereas the eosdb site incorporates data from other Direct Broadcast sites, and it waits (typically up to 30 minutes) until those data are present before processing. Imagery at the eosdb site covers larger regions at the expense of latency. The NOAA-20 true-color imagery below, for example, includes information over South America that did not originate from the Madison downlink. This image of NOAA-20 orbits over North American on 16 April (source) includes a (very large) circle from which the CIMSS Direct Broadcast antenna can acquire data, but you’ll note it does not extend into South America.

NOAA-20 True Color Imagery, 1856 UTC on 16 April 2025 (Click to enlarge)

DBPS websites are available for other Direct Broadcast antennas as well, as noted in this blog post.

View only this post Read Less