Timely VIIRS imagery at the CIMSS DBPS website
The Direct Broadcast Processing System (DBPS) at SSEC/CIMSS now has a website (http://erb-dbps.ssec.wisc.edu/browser/MADISON/) that serves up VIIRS imagery and products that become available very quickly. As I type this at 2011 UTC, for example, NOAA-21 data from the 1937 UTC overpass is available. The animation below shows 3 different true-color scenes (produced with polar2grid) over the midwestern United States. The greening of Spring has reached into southern Illinois, but snow-cover is still widespread over the Upper Peninsula of Michigan and much of Canada. Lakes in Minnesota still have ice cover, but those in Wisconsin are clear of ice.
Imagery from a variety of VIIRS channels, including the Day Night Band, are routinely produced. Satellites providing imagery also include Metop-B and Metop-C, NOAA-18 and NOAA-19, GCOM-W1 and Aqua. Microwave imagery is available, at 36.5 and 89 GHz (both horizontal and vertical polarities) as shown in the toggle below. In addition, level 2 products from MIRS can be accessed (Total Precipitable Water, Rain Rate, and microwave brightness temperatures at 31, 89, 157, 165, 183 and 191 GHz!)
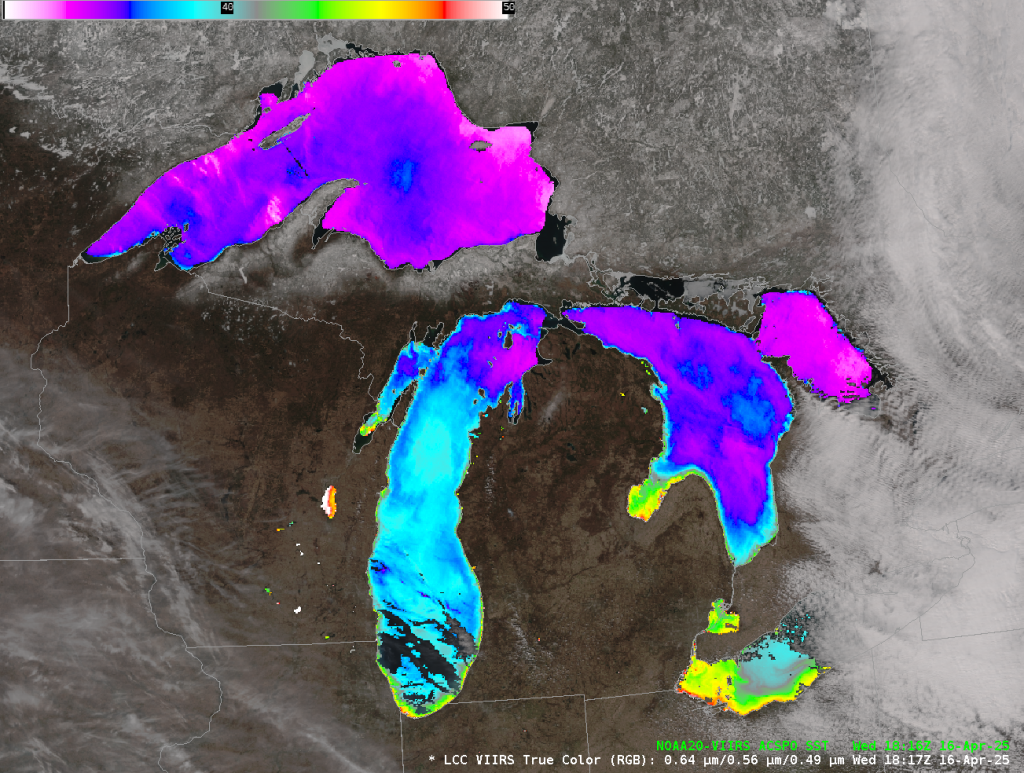
Perhaps you noticed the clear skies over the Great Lakes above and asked yourself: “I fancy a swim; I wonder what the Lake Surface Temperatures are?” AWIPS-ready tiles produced at CIMSS (by polar2grid) and displayed in AWIPS, below, show the answer. Lake Superior and most of Lake Huron have surface temperatures in the mid-30s (oF); Lake Michigan is a bit warmer, closer to 40oF, except along the far southern shore, where waters are just a bit warmer. Only western Lake Erie is uniformly “warm” with temperatures in the upper-40s to around 50. Enjoy your swim there. Lake Surface Temperatures are not yet at the DBPS site, but their implementation is planned.
VIIRS imagery is also available at the eosdb url: https://ftp.ssec.wisc.edu/pub/eosdb/; the latency at that site is not as quick as at the DBPS site because the DBPS site incorporates only data from the Direct Broadcast antenna at CIMSS, whereas the eosdb site incorporates data from other Direct Broadcast sites, and it waits (typically up to 30 minutes) until those data are present before processing. Imagery at the eosdb site covers larger regions at the expense of latency. The NOAA-20 true-color imagery below, for example, includes information over South America that did not originate from the Madison downlink. This image of NOAA-20 orbits over North American on 16 April (source) includes a (very large) circle from which the CIMSS Direct Broadcast antenna can acquire data, but you’ll note it does not extend into South America.

DBPS websites are available for other Direct Broadcast antennas as well, as noted in this blog post.