This blog post contains information on GOES-17 and its transition to the operational GOES-West satellite at 137º W Longitude (a link is here). Much as the Advanced Baseline Imager (ABI) imagery from GOES-17 is preliminary and non-operational, the information in this blog post is also preliminary, and it will be... Read More
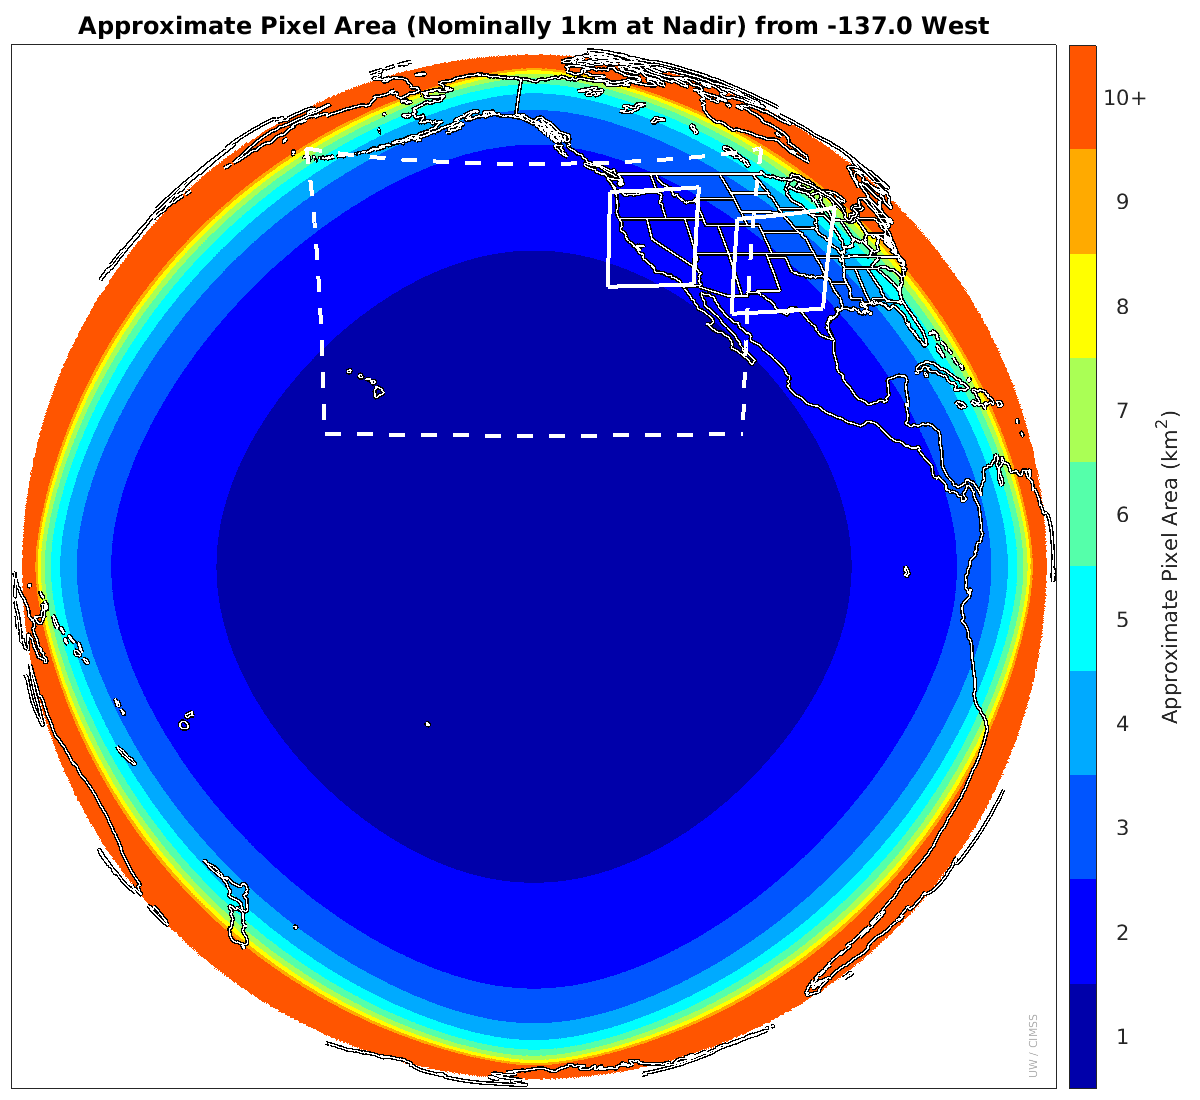
Graphic showing Pixel sizes for Bands 1, 3 and 5 (0.47 µm, 0.86 µm, and 1.61 µm) when GOES-17 is on station at 137º W Longitude. The GOES-West CONUS domain (where 5-minute scanning is routine) is shown in dashed white; GOES-West default Mesoscale Sectors (where 1-minute scanning is routine) are shown in solid white.
This blog post contains information on GOES-17 and its transition to the operational GOES-West satellite at 137º W Longitude (a link is here). Much as the Advanced Baseline Imager (ABI) imagery from GOES-17 is preliminary and non-operational, the information in this blog post is also preliminary, and it will be updated as needed.
The 16 ABI Channels all passed beta status in August. (At that point, GOES-17 data started flowing over the GOES Re-Broadcast [GRB]). Beta Provisional means that there are issues remaining in the individual channels, but they have been identified and are being addressed. Provisional status is expected to occur on 28 November 2018 this year — when the satellite is on station at 137 W. When that provisional status occurs, GOES-17 data will start flowing into NOAA’s CLASS archive (link).
NOAA/NESDIS announced on 26 September that the GOES-17 Drift from the test position at 89.5º W will start on 24 October 2018 at 1740 UTC, reaching its location as GOES-West (137º W) on 13 November 2018. Because ABI data are not transmitted when GOES-17 is moving, this means GOES-17 data will not be available for those 3 weeks. (When GOES-16 transitioned from the test position at 89.5º to its present GOES-East location at 75.2º, the data were missing for 14 days, from 30 November 2017 to 14 December 2017. GOES-17 will move at 2.5º per day, faster than GOES-16 did during its transition.
At about the same time that GOES-17 moves, GOES-15 will be shifted eastward from 135º W to 128º W. This shift starts 23 October 2018 at 2015 UTC and is predicted to end on 1 November 2018 at 1900 UTC. In contrast to GOES-R, however, GOES-15 can continue to transmit data as it moves. When GOES-15 is at its new location, the GOES-15 GVAR stream will be bounced off of GOES-14 (located at 105º W).
All 16 ABI Channels from 00:07 to 23:57 UTC on 30 August 2018 (Click to view mp4 animation)
The GOES-17 Advanced Baseline Imagery (ABI) is affected by malfunctioning Loop Heat Pipes (LHPs) on the spacecraft. Loop Heat Pipes dissipate heat, and because heat around the ABI is not dissipated, the energy emitted by the warmed satellite contaminates the ABI sensors: the ABI will measure energy coming from the Earth but also from the satellite itself. The bottom line is that during the night hours, the sun warms the satellite faster than it can cool.
The animation above (courtesy Tim Schmit, NOAA/NESDIS and CIMSS) shows the effects of the malfunctioning LHP on the worst day. During the night time, longwave infrared imagery (that is, longer than 3.9 µm) deteriorates in quality for several hours around local midnight. (The animation also includes a solar exclusion zone before that deterioration) Before sunrise, as the ABI is shaded more and more by the GOES-17 spacecraft, the imagery becomes useable again.
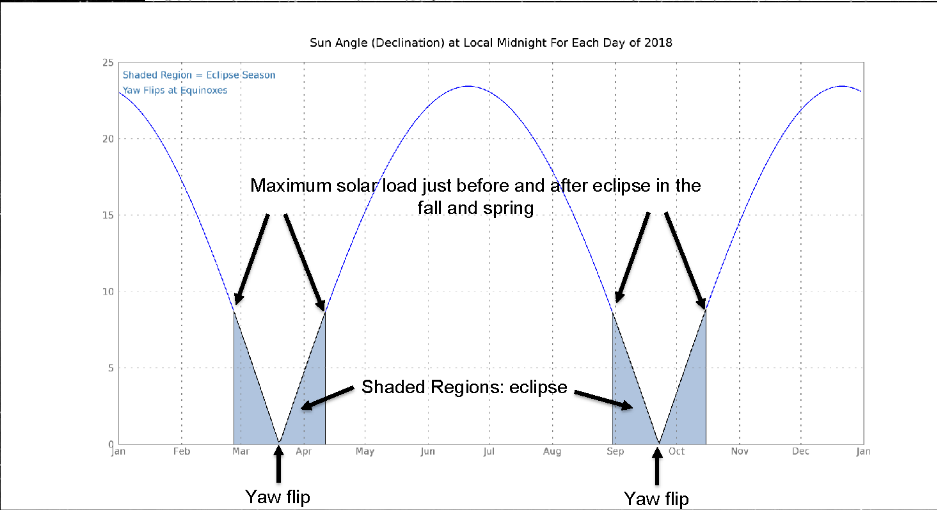
This effect varies with season. The plot below (from Dan Lindsey, NOAA/NESDIS at CIRA), shows the solar declination with respect to the satellite. As the value gets smaller, solar forcing on the ABI increases. The minimum value would occur at Equinoxes, but the time around the Equinoxes is also Eclipse Season for the satellite: it moves through the Earth’s shadow around local midnight, and that passage through the shadow mitigates heating effects. Thus, the maximum solar forcing on the ABI occurs about 3.5 weeks before the Equinox, and again about 3.5 weeks after.
Sun angle at local midnight for GOES-17. Heating of the ABI is stronger as the angle decreases. Blue shading indicates Eclipse Seasons when solar forcing at satellite midnight is mitigated by the spacecraft’s passage through the Earth’s shadow. (Click to enlarge)
The plot below (courtesy Mat Gunshor, CIMSS) shows how the Focal Plane Module (FPM) Temperature changes as a function of time. Without solar forcing (that is, during the day when the ABI is in GOES-17’s shadow), the FPM temperature is around 80 K. At night, when sunlight hits ABI, FPM temperatures increase, and the peak value, around 105 K, happened at the end of August. A similar value will occur in October when Eclipse season is over.
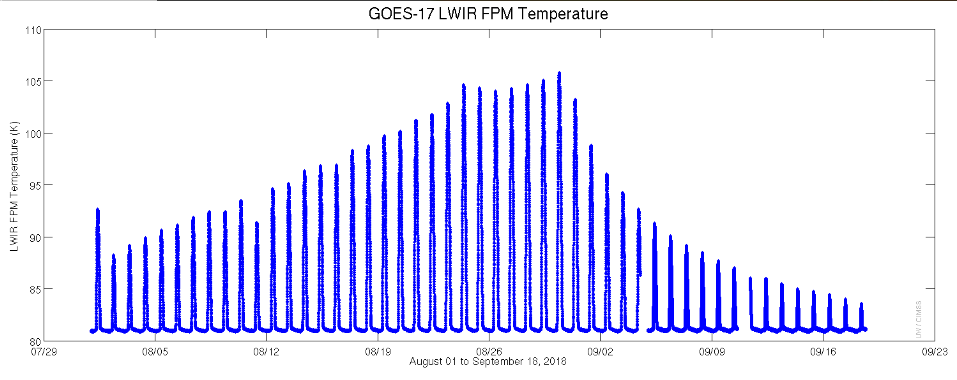
Focal Plane Module Temperature for Longwave IR (Band 14), August through mid-September 2018 (Click to enlarge)
The reported effect of this extra heat on ABI data availability has evolved since May (when reports of data availability for only 12 hours were common), as a team of Scientists and Engineers from NOAA, NASA and Harris Company have gained a better understanding of the problem and how the effects of the heat can be mitigated. The current best estimates are that ABI Channels 7 (3.9 µm) and below (visible and near-infrared) will operate within design specifications throughout the year. The majority of the time will be when all channels provide good data throughout the day, but there will also be times, when solar forcing warms the ABI, that causes ABI data to be contaminated and likely unusable for a period around local satellite midnight (that is, midnight at 137 W Longitude). The water vapor channels (8, 9 and 10 at 6.19 µm, 6.95 µm, 7.34 µm), Ozone Channel (12, at 9.6 µm) and CO2 Channel (16, at 13.3 µm) will have 4-6 hours of bad or missing data; the infrared cloud phase/SO2 channel (11, at 8.46 µm) and the Dirty Window Channel (15, at 12.3 µm) will have around 3 hours of missing data; Window channels 13 and 14 (10.3 µm and 11.2 µm, respectively) will likely transmit useable data even during the warm season. However, data from those two window channels may be biased. This is all still under investigation, and these estimates are valid as of mid-September 2018. Scientists and engineers are still working to mitigate the problem and to adjust the way ABI is calibrated given the non-optimal operating temperature. The times of the year when data is most likely to be affected by LHP problems will be as the satellite approaches and exits Eclipse Seasons.
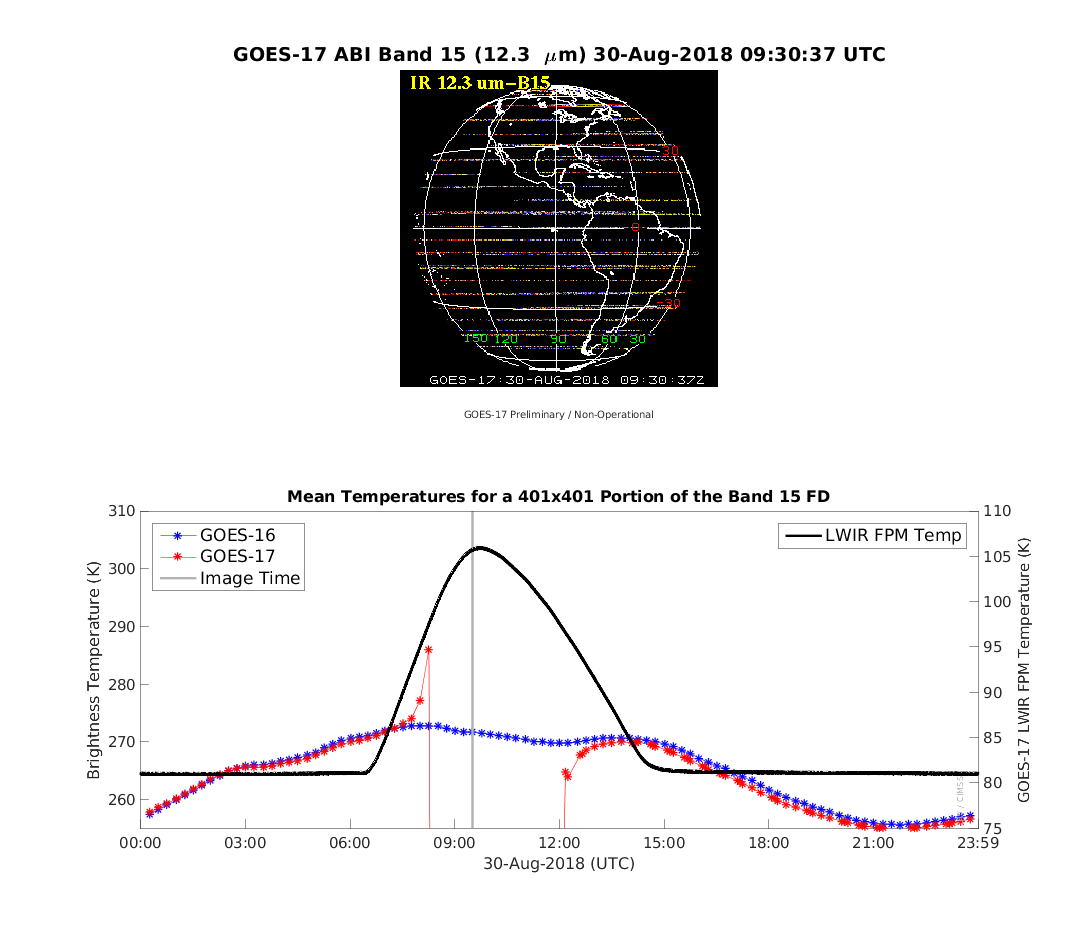
Top: GOES-17 Full Disk 12.3 µm Infrared Brightness Temperatures; Bottom: Time series of GOES-16 and GOES-17 Band 15 (12.3 µm) Brightness Temperatures averaged over a region (of size 401×401) centered over Florida from 00:02 UTC to 23:57 UTC on 30 August 2018 (Click to play mp4 animation)
The animation compares GOES-16 and GOES-17 “Dirty Window” 12.3 µm infrared brightness temperatures averaged in a 401×401-sized box centered over Florida. There is excellent agreement before and after the issues associated with extra heating because of faulty LHPs.
Note that GOES-15 data may be used to supplement GOES-17 data during the times of data outage, although no decision has been made to operate GOES-15 long term.
Animations that show the evolution of the 16 channels through satellite midnight are available in PowerPoints here and here.
View only this post
Read Less
![DMSP-18 SSMIS Microwave (85 GHz) and GOES-15 Infrared Window (10.7 µm) images [click to enlarge]](https://cimss.ssec.wisc.edu/satellite-blog/wp-content/uploads/sites/5/2018/09/180928_1330utc_dmsp18_microwave_goes15_infrared_Rosa_anim.gif)
![GOES-15 Visible (0.63 µm, left) and GOES-17 "Red" Visible (0.64 µm, right) images [click to play animation | MP4]](https://cimss.ssec.wisc.edu/satellite-blog/wp-content/uploads/sites/5/2018/09/180928_goes15_goes17_visible_Rosa_anim.gif)
![MIMIC-TC morphed microwave product, 0000-1545 UTC [click to enlarge]](https://cimss.ssec.wisc.edu/satellite-blog/wp-content/uploads/sites/5/2018/09/180928_0000_1545utc_mimic_tc_Rosa_anim.gif)
![GOES-16 Low-level (7.3 µm, left), Mid-level (6.9 µm, center) and Upper-level (6.2 µm, right) Water Vapor images [click to play animation | MP4]](https://cimss.ssec.wisc.edu/satellite-blog/wp-content/uploads/sites/5/2018/09/180925_180926_goes16_water_vapor_Leslie_anim.gif)
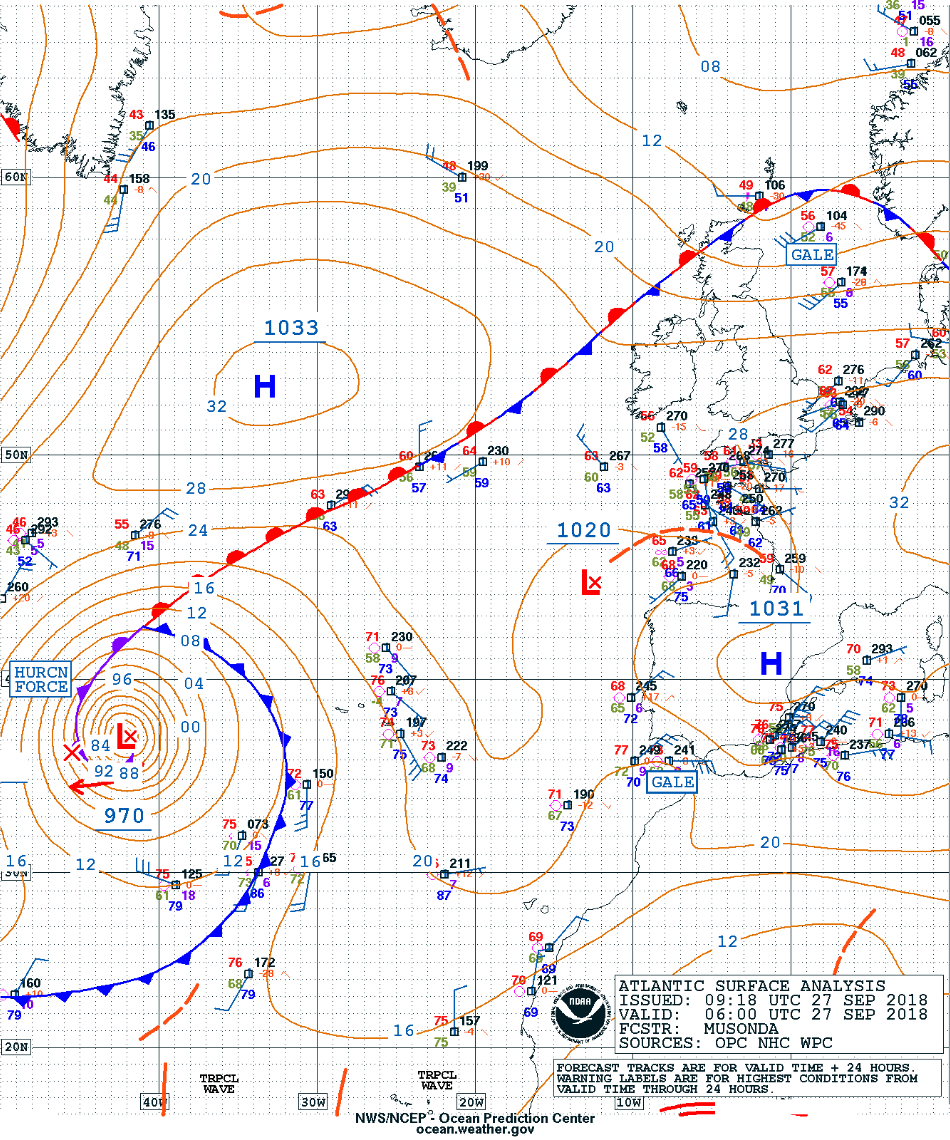
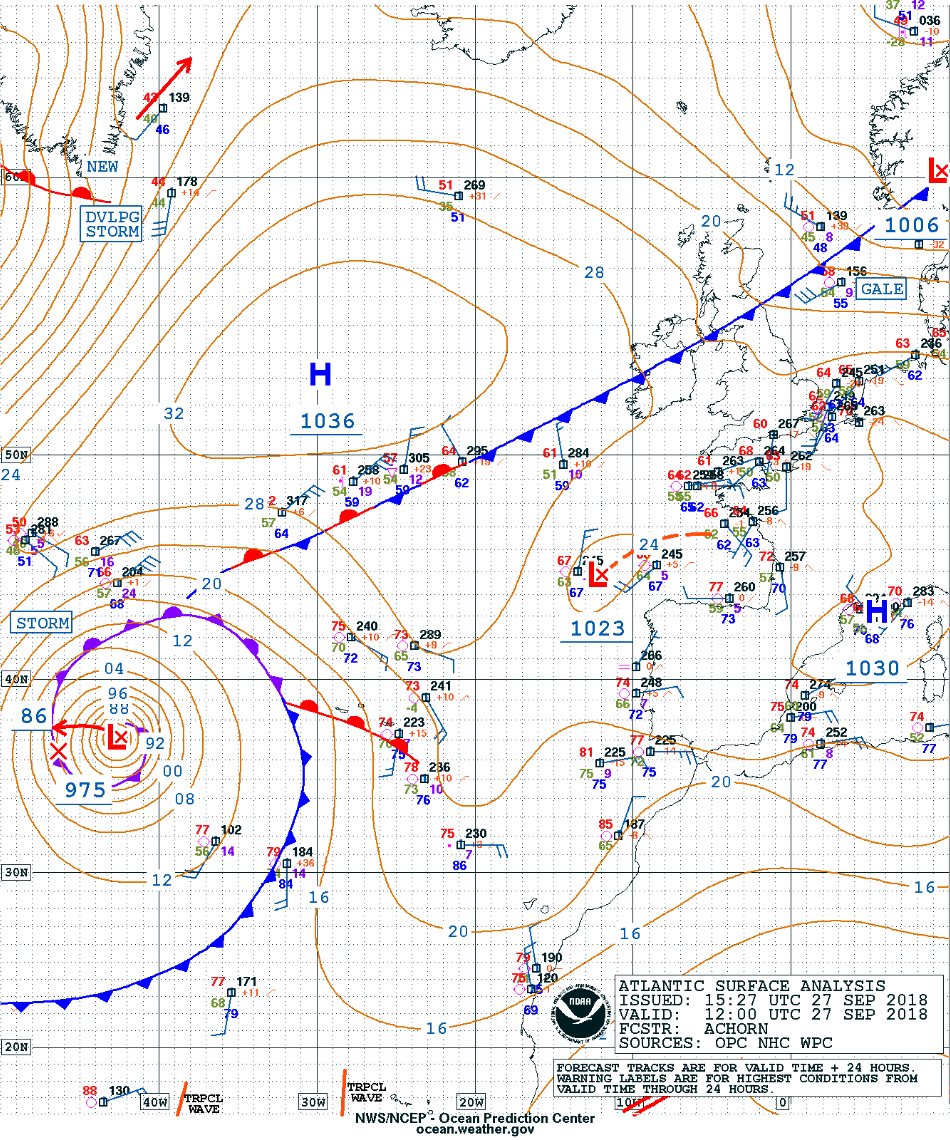
![Surface analyses at 6-hour intervals [click to play animation | MP4]](https://cimss.ssec.wisc.edu/satellite-blog/wp-content/uploads/sites/5/2018/09/180925_180926_surface_analyses_Lesie_anim.gif)
![GOES-16 Upper-level (6.2 µm) Water Vapor images, with contours of the PV1.5 pressure surface plotted in red [click to play animation | MP4]](https://cimss.ssec.wisc.edu/satellite-blog/wp-content/uploads/sites/5/2018/09/180926_goes16_water_vapor_pv1.5_band8_Leslie_anim.gif)
![GOES-16 Mid-level (6.9 µm) Water Vapor images, with contours of the PV1.5 pressure surface plotted in red [click to play animation | MP4]](https://cimss.ssec.wisc.edu/satellite-blog/wp-content/uploads/sites/5/2018/09/180926_goes16_water_vapor_pv1.5_band9_Leslie_anim.gif)
![GOES-16 Low-level (7.3 µm) Water Vapor images, with contours of the PV1.5 pressure surface plotted in red [click to play animation | MP4]](https://cimss.ssec.wisc.edu/satellite-blog/wp-content/uploads/sites/5/2018/09/180926_goes16_water_vapor_pv1.5_band10_Leslie_anim.gif)
![GOES-16 Air Mass RGB images, with contours of PV1.5 pressure [click to play animation | MP4]](https://cimss.ssec.wisc.edu/satellite-blog/wp-content/uploads/sites/5/2018/09/AirMassRGB_with_PatPV1.5_1000_to_2215_26Sep2018.gif)
![GOES-16 Air Mass RGB images, with and without contours of GFS PV1.5 pressure [click to play animation | MP4]](https://cimss.ssec.wisc.edu/satellite-blog/wp-content/uploads/sites/5/2018/09/180925_180927_goes16_airmassRGB_pv1.5_Leslie_anim.gif)
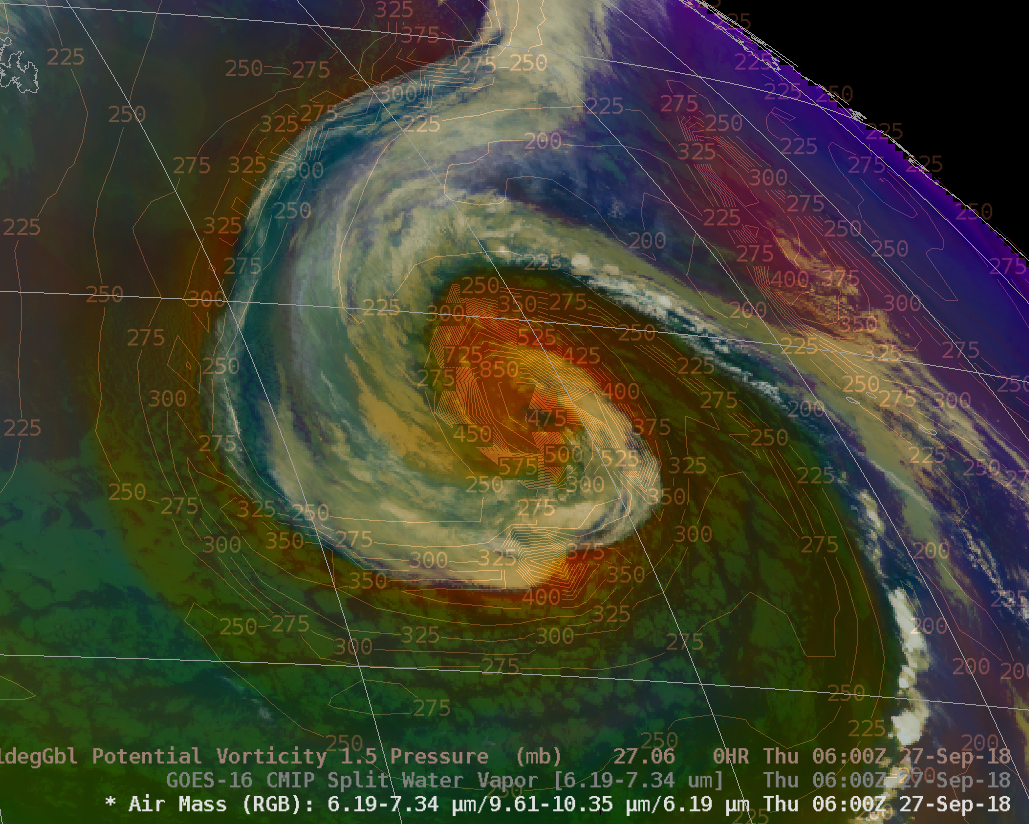
![GOES-16 Split Water Vapor Difference (6.2 µm - 7.3 µm) images, with and without contours of PV1.5 pressure [click to play animation | MP4]](https://cimss.ssec.wisc.edu/satellite-blog/wp-content/uploads/sites/5/2018/09/180925_180927_goes16_waterVaporDifference_pv1.5_Leslie_anim.gif)
![Sequence of GOES-16 Low-level (7.3 µm), Mid-level (6.9 µm) and Upper-level (6.2 µm) Water Vapor images from 09 UTC on 27 September to 00 UTC on 28 September [click to play animation | MP4]](https://cimss.ssec.wisc.edu/satellite-blog/wp-content/uploads/sites/5/2018/09/180927_goes16_water_vapor_Post_Tropical_Cyclone_Leslie_anim.gif)

