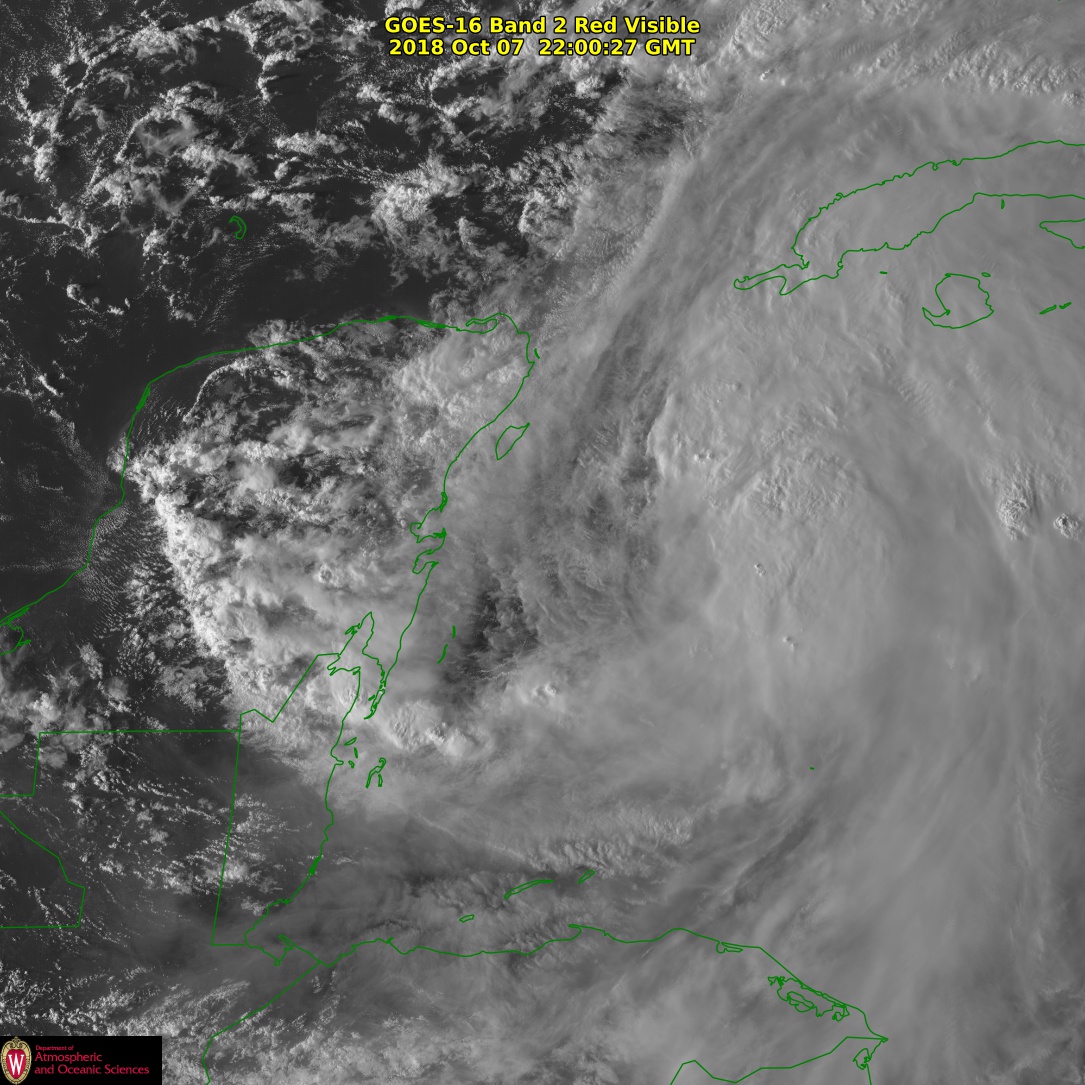
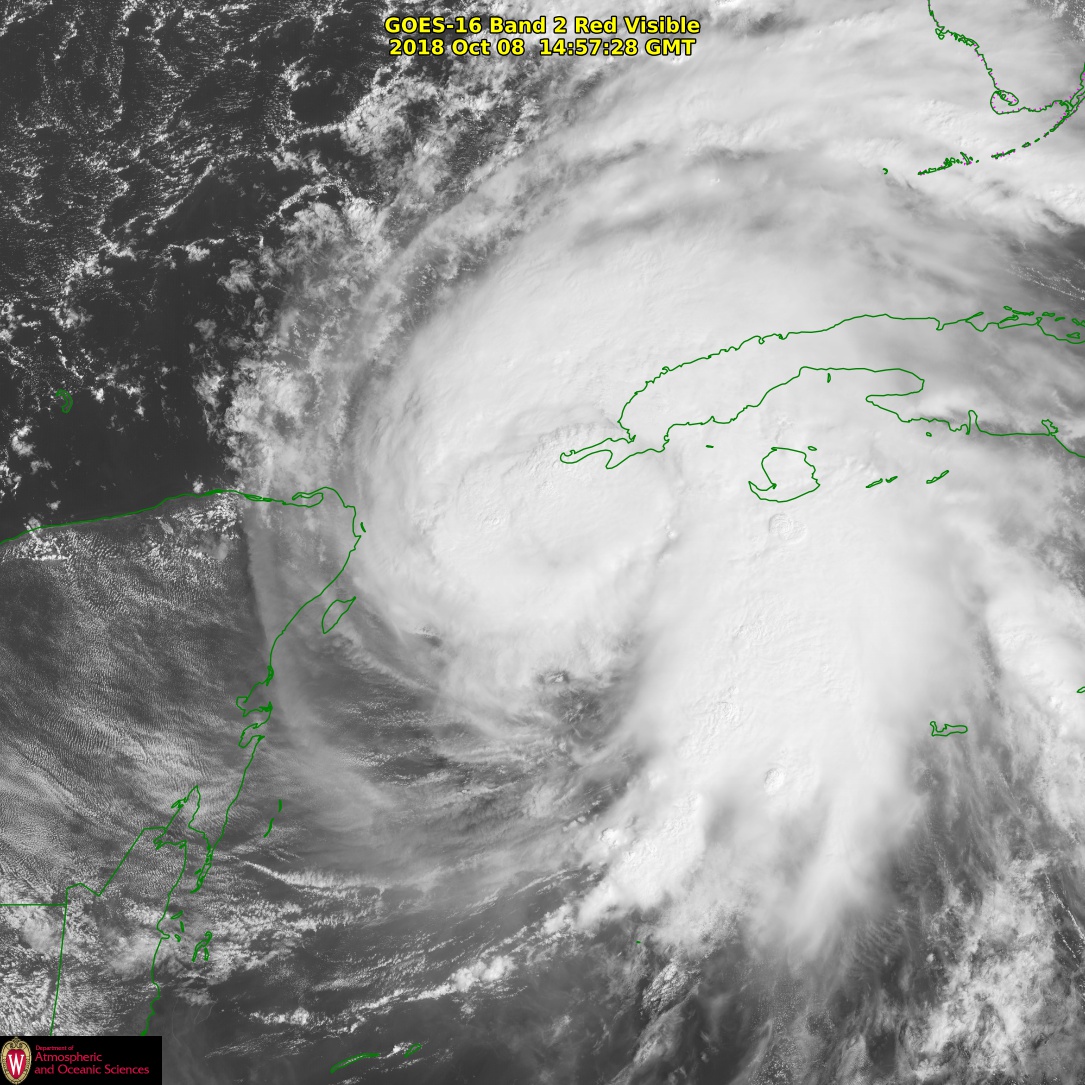
GOES-16 (left) and GOES-17 (right) visible (0.64 µm) imagery of Michael starting at 1147 UTC on 8 October 2018 (Click to play mp4 animation)
GOES-17 data in this post are preliminary and non-operational
CONUS (Contiguous United States) imagery at 5-minute intervals from GOES-16 at 75.2 W Longitude and GOES-17 at 89.5 W Longitude allows for Hurricane Michael to be viewed stereroscopically from space. The animation above, starting at 1142 UTC and extending to sunset, (click here for an animated gif) shows an intensifying Michael with strong convection developing over the center. To view in three dimensions, cross you eyes until 3 images are present, and focus on the image in the center. Very strong shear is also apparent northeast of Michael. Low-level winds and upper-level winds do not align, and convection there is strongly tilted. (This graphic of shear is from the CIMSS Tropical Weather Website)
Sea-surface Temperatures over the Gulf (Source), below, show abundant warm water between Michael and its project landfall location along the northeast Gulf Coast (See the National Hurricane Center for latest information).
Blended SST over the Gulf of Mexico, 7 OCtober 2018 (Click to enlarge)
The animation shows the stereoscopic view on 9 October 2018. An animated gif is available here.
GOES-16 (left) and GOES-17 (right) visible (0.64 µm) imagery of Michael starting at 1147 UTC on 9 October 2018 (Click to play mp4 animation)
The animation below is shows Michael’s eye at full GOES-16/GOES-17 resolution starting at 1402 UTC on 9 October.
GOES-16 (left) and GOES-17 (right) full-resolution visible (0.64 µm) imagery of Michael’s on 9 October 2018 (Click to play animated gif)
A full-resolution of Michael’s well-developed eye on 10 October is shown below.
GOES-16 (left) and GOES-17 (right) visible (0.64 µm) imagery of Michael starting at 1147 UTC on 10 October 2018 (Click to play animated gif)
View only this post Read Less
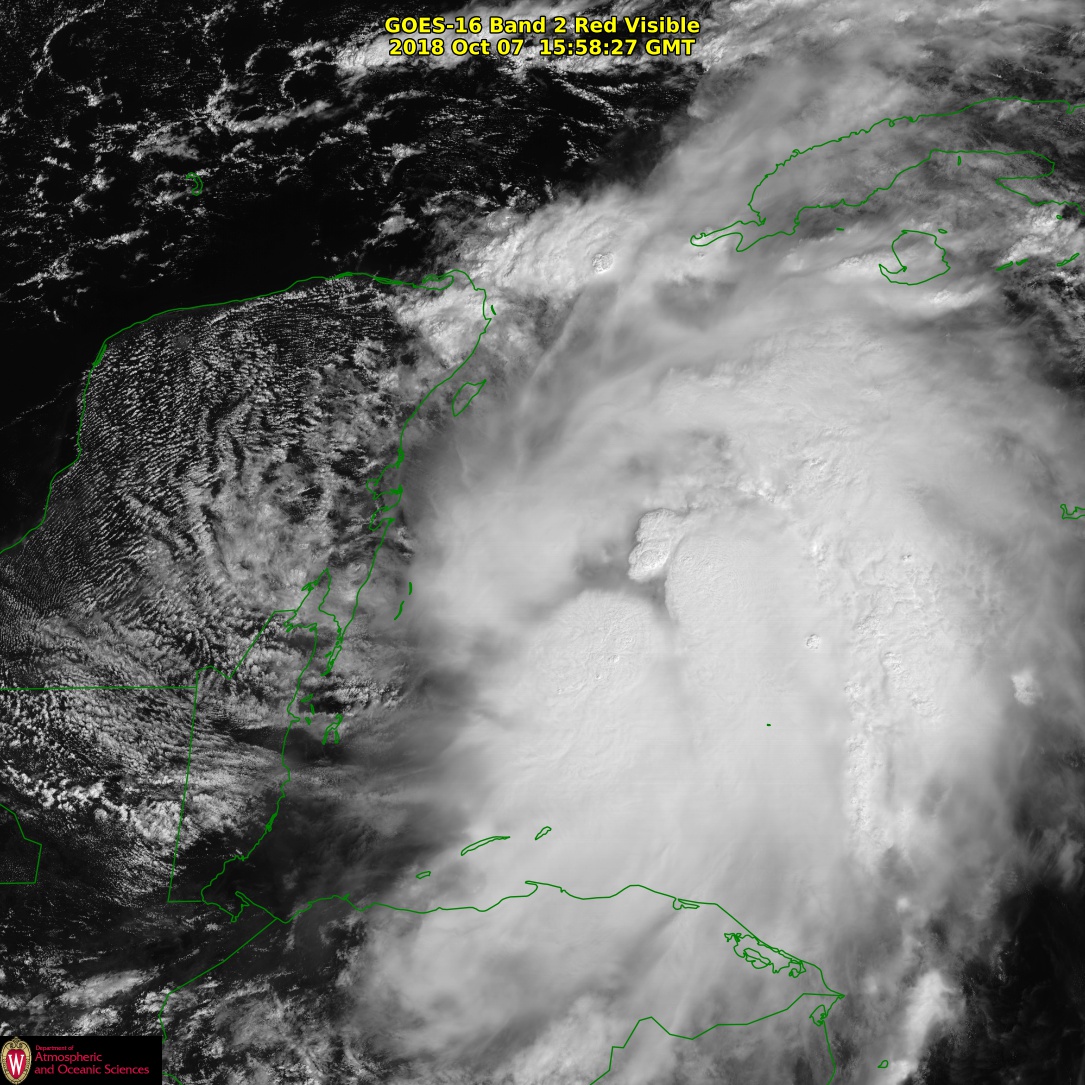
![GOES-16 "Clean" Infrared Window (10.3 µm) images [click to play MP4 animation]](https://cimss.ssec.wisc.edu/satellite-blog/wp-content/uploads/sites/5/2018/10/G16_IR_TD14_07OCT2018_2018280_131127_GOES-16_0001PANEL.GIF)

![NOAA-20 VIIRS Day/Night Band (0.7 µm), Infrared Window (11.45 µm) and ATMS Microwave (88 GHz) images [click to enlarge]](https://cimss.ssec.wisc.edu/satellite-blog/wp-content/uploads/sites/5/2018/10/181008_0721utc_noaa20_DayNightBand_InfraredWindow_Microwave_TS_Michael_anim.gif)
![DMSP-18 SSMIS Microwave (86 GHz) and GOES-16 Infrared Window (10.3 µm) images [click to enlarge]](https://cimss.ssec.wisc.edu/satellite-blog/wp-content/uploads/sites/5/2018/10/181008_1115utc_goes16_infrared_1126utc_dmsp18_microwave_Hurricane_Michael_anim.gif)
![Ocean Heat Content and Sea Surface Temperature analyses, with past and forecast tracks of Michael [click to enlarge]](https://cimss.ssec.wisc.edu/satellite-blog/wp-content/uploads/sites/5/2018/10/181007_ohc_sst_Michael_anim.gif)
![Terra MODIS Sea Surface Temperature product (0343 UTC on 06 October) with Hurricane Michael forecast positions issued at 2100 UTC on 08 October [click to enlarge]](https://cimss.ssec.wisc.edu/satellite-blog/wp-content/uploads/sites/5/2018/10/MODIS_SST_20181006_0343.png)
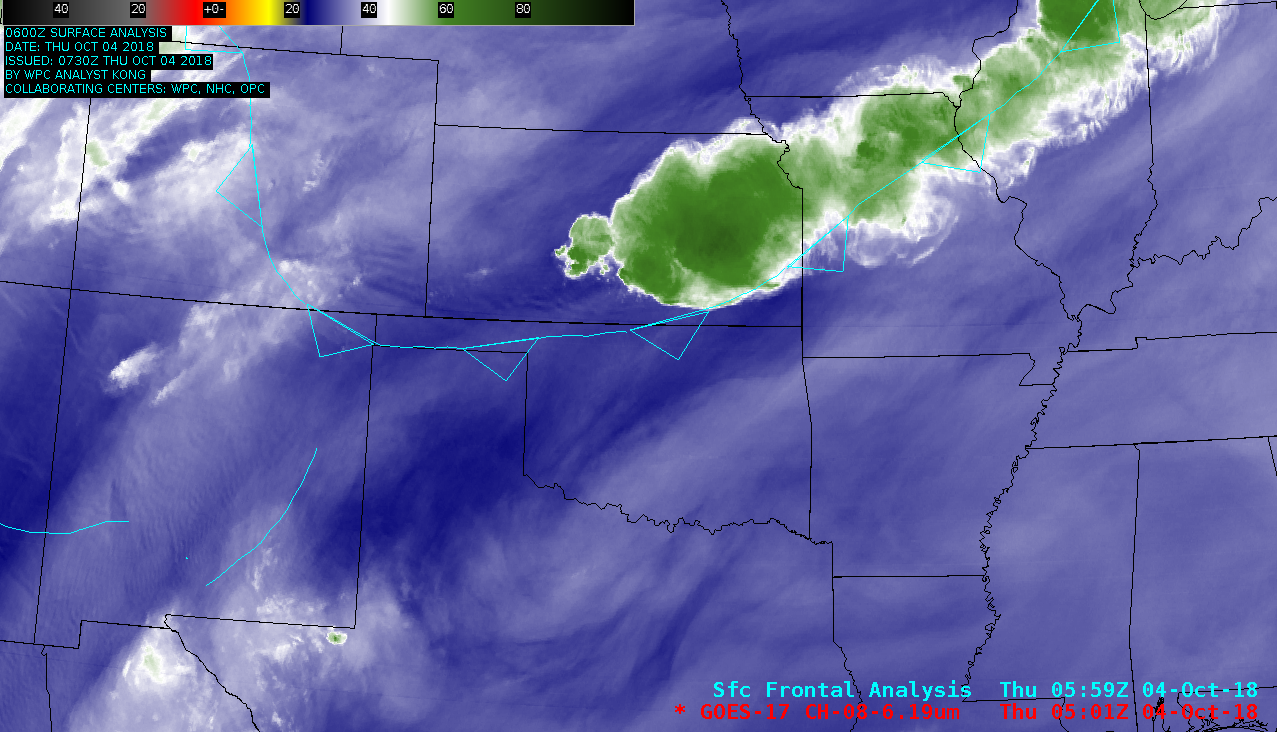
![GOES-17 Upper-level Water Vapor (6.2 µm) images, with surface frontal analyses [click to play MP4 animation]](https://cimss.ssec.wisc.edu/satellite-blog/wp-content/uploads/sites/5/2018/10/g17_wv_frontal_gravity_wave-20181004_050119.png)
![GOES-17 Upper-level Water Vapor (6.2 µm) images, with pilot reports of turbulence [click to enlarge]](https://cimss.ssec.wisc.edu/satellite-blog/wp-content/uploads/sites/5/2018/10/181004_goes17_water_vapor_pilot_reports_anim.gif)
![Aqua MODIS Water Vapor (6.7 µm) image [click to enlarge]](https://cimss.ssec.wisc.edu/satellite-blog/wp-content/uploads/sites/5/2018/10/modis_wv_frontal_wave-20181004_080619.png)
![GOES-17 Low-level (7.3 µm, left), Mid-level (6.9 µm, center) and Upper-level (6.2 µm, right) Water Vapor images, with plots of surface wind barbs [click to play MP4 animation]](https://cimss.ssec.wisc.edu/satellite-blog/wp-content/uploads/sites/5/2018/10/G17_WATER_VAPOR_PLAINS_CDFNT_04OCT2018_960x490_B1098_2018276_210119_0003PANELS_00001.GIF)

