
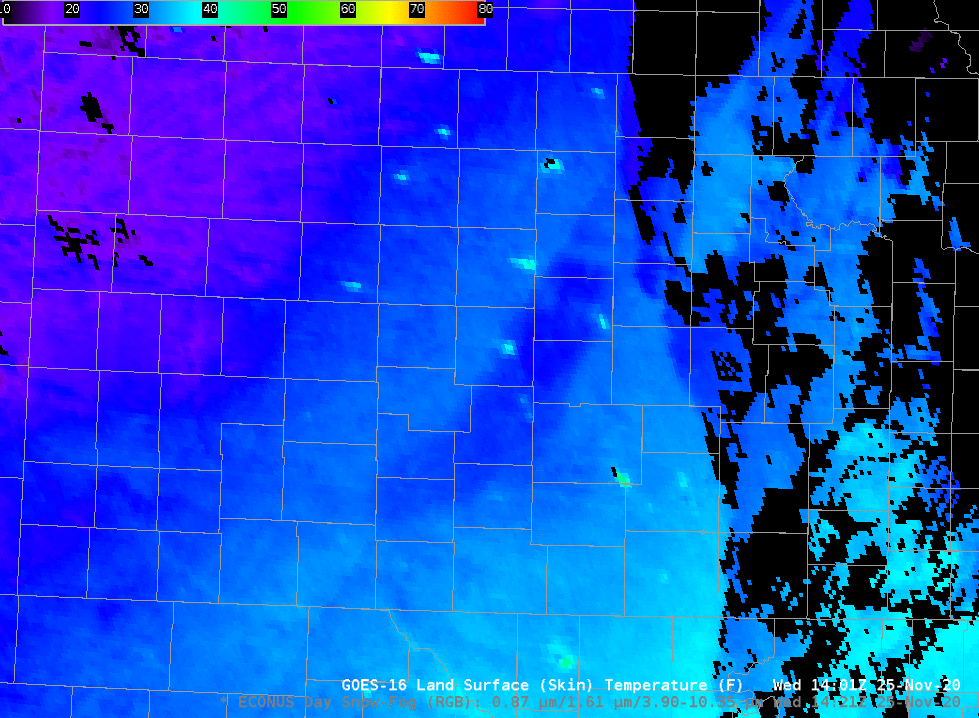
An extratropical cyclone deposited a mesoscale snowband — a few counties wide — in south-central Kansas late in the day on 24 November 2020 (Click here to see the storm at 0300 UTC on 25 November). As is often the case, such bands have profound impacts on surface temperatures. It... Read More
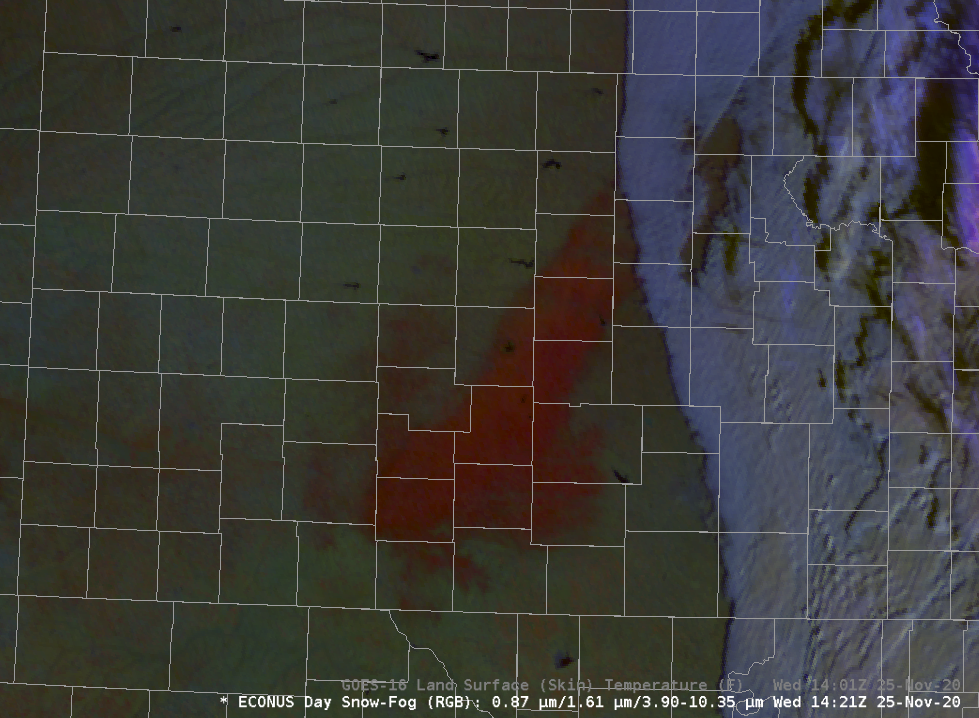
Day Snow Fog RGB, 1421 – 1926 UTC on 25 November 2020 (Click to animate)
An extratropical cyclone deposited a mesoscale snowband — a few counties wide — in south-central Kansas late in the day on 24 November 2020 (Click here to see the storm at 0300 UTC on 25 November). As is often the case, such bands have profound impacts on surface temperatures. It is therefore important to monitor their precise location. The animation above shows the Day Snow Cloud RGB; its use of the 1.61 µm band allows the RGB to distinguish easily between snow and clouds, both of which are bright in the visible, as shown in the image below, courtesy Mike Umscheid, NWS ICT, that shows the snow band and the similarly reflective clouds to the east. (Imagery created at this nifty website!)
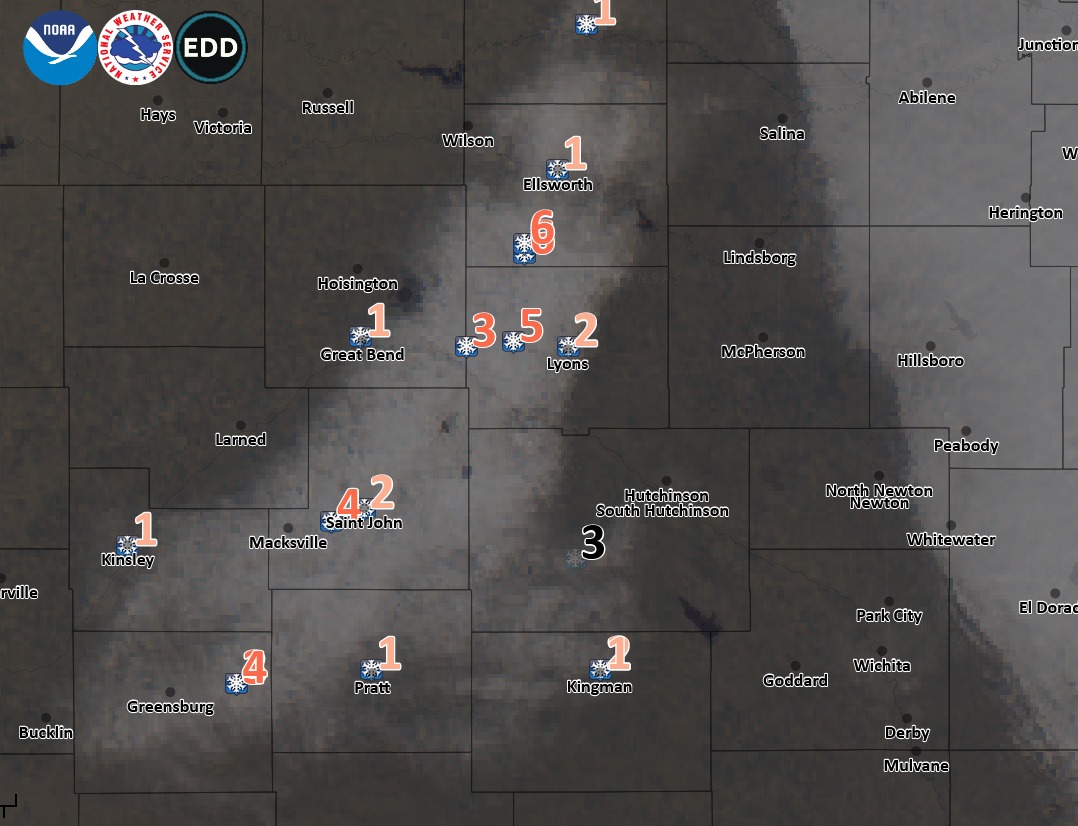
GOES-16 Visible imagery, 25 November 2020, and morning snow depths over central Kansas (Click to enlarge; imagery courtesy Mike Umscheid, NWS ICT)
GOES-16 Land Surface Temperatures (a baseline level 2 product) shows the effect of the snow on skin temperature, below. Shortly after sunrise, temperatures over the snowband are several degrees (Fahrenheit) cooler, as expected with clear skies and a fresh snowpack. (Warm lakes also shine through!) Bare land in Kansas warms quickly, with Skin Temperatures reaching into the upper 60s and 70s by 1900 UTC, whereas the snow band remains in the 30s!

GOES-16 Land Surface (skin) Temperature, 1421 – 1916 UTC, 25 November 2020 (Click to animate)
A comparison of GOES-R Land Surface Temperatures with METAR observations, below, underscores the notion that the skin temperature can be much warmer than the temperature 1.5 m above the ground, where METAR thermometers (or thermistors) measure the air temperature. The warmest METAR temperature at 2000 UTC is 57º F at Scott City, KS. Land Surface Temperatures there are in the mid-60s, with 70 just to the northeast.
GOES-16 Land Surface Skin Temperatures with surface METAR plots, 2000 UTC (Click to enlarge)
Note that the default bounds of the colorbar range in Land Surface Temperature have been changed. Default values range from -10º to 110º F; values shown above range from 10º to 80º F. The toggle below compares the two, at 1501 UTC.

GOES-16 Land Surface Temperature with default color bounds (-10 to 100 F) and more useful bounds for this day (10 to 80 F) (Click to enlarge)
Towards sunset, the Day Snow Fog RGB (or any RGB that relies on reflectances from visible, near-Infrared or infrared channels) can become dim. In that event, an AWIPS user can edit the Composite Options, reducing the upper bounds of all three RGB channels o that the image retains brightness and utility (in this case upper bounds were reduced for Red from 100 to 60; for Green from 70 to 40; for Blue from 30 to 19).
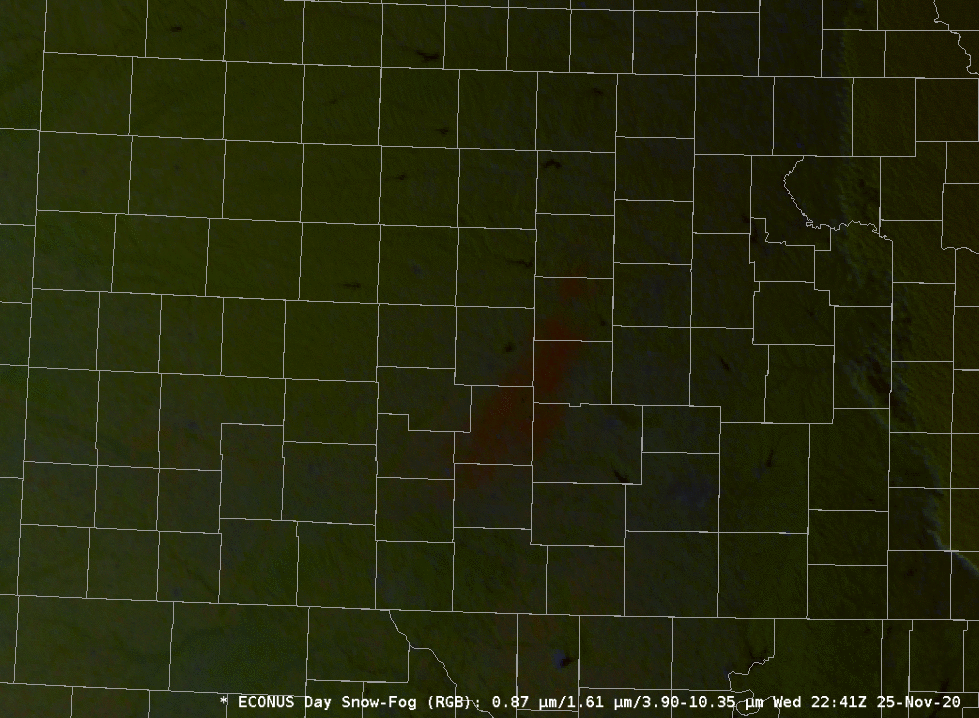
GOES-16 Day Snow Fog RGB at 2241 UTC, 25 November 2020, with default bounds (dimmer image: Red 0-100; Green 0-70; Blue 0-30) and adjusted bounds (brighter image: Red 0-70; Green 0-40; Blue 0-19) (Click to enlarge)
View only this post
Read Less
![Himawari-8 True Color RGB images [click to play animation | MP4]](https://cimss.ssec.wisc.edu/satellite-blog/images/2020/11/201129_himawari_trueColorRGB_Lewotolok_eruption_anim.gif)
![Plot of rawinsonde data from Kupang, Indonesia [click to enlarge]](https://cimss.ssec.wisc.edu/satellite-blog/images/2020/11/201129_00UTC_WRKK_RAOB.GIF)
![Himawari-8 Ash RGB images [click to play animation | MP4]](https://cimss.ssec.wisc.edu/satellite-blog/images/2020/11/201129_himawari_ashRGB_Lewotolok_eruption_anim.gif)
![Himawari-8 Ash Height [click to play animation | MP4]](https://cimss.ssec.wisc.edu/satellite-blog/images/2020/11/201129_himawari8_ashHeight_Lewotolok_anim.gif)
![Himawari-8 False Color images [click to play animation | MP4]](https://cimss.ssec.wisc.edu/satellite-blog/images/2020/11/201129_himawari8_so2RGB_Lewotolok_anim.gif)

![Suomi NPP VIIRS Visible (0.64 µm) and Infrared Window (11.45 µm) images [click to enlarge]](https://cimss.ssec.wisc.edu/satellite-blog/images/2020/11/201126_2228utc_suomiNPP_viirs_visible_infrared_Gulf_of_Alaska_anim.gif)

