GOES-16 (GOES-East) “Red” Visible (0.64 µm) images (above) showed that most of Antarctica experienced 24 hours of full solar illumination during the Southern Hemisphere’s Summer Solstice on 21 December 2019. Through breaks in the cloud cover, a few bright areas of sun glint were also evident, moving from west to... Read More

GOES-16 “Red” Visible (0.64 µm) images [click to play animation | MP4]
GOES-16
(GOES-East) “Red” Visible (0.64 µm) images
(above) showed that most of Antarctica experienced 24 hours of full solar illumination during the Southern Hemisphere’s Summer Solstice on 21 December 2019. Through breaks in the cloud cover, a few bright areas of sun glint were also evident, moving from west to east, due to the reflection of sunlight off ice-free water.
In spite of receiving 24 hours of sunlight, interior areas of the continent remained quite cold — due to high elevation and deep snow cover. For example, surface air temperatures at station 8927 near the center of Antarctica remained within the -25 to -35ºF range on 21 December (source).
![Surface air temperatures (ºF) at automated weather stations across Antarctica [click to enlarge]](https://cimss.ssec.wisc.edu/satellite-blog/images/2019/12/191221_antarctica_temperatures_anim.gif)
Surface air temperatures (ºF) at automatic weather stations across Antarctica [click to enlarge]
In the Northern Hemisphere, GOES-17
(GOES-West) Visible images
(below) revealed a few hours of illumination of the southern summits of Denali and nearby portions of the Alaska Range. Note the presence of much colder surface air temperatures (-20s and -30s F) north of the Alaska Range.
![GOES-17 "Red" Visible (0.64 µm) images [click to play animation | MP4]](https://cimss.ssec.wisc.edu/satellite-blog/images/2019/12/G17_VIS_ALASKA_21DEC2019_B2_2019355_221356_GOES-17_0001PANEL_FRAME00134.GIF)
GOES-17 “Red” Visible (0.64 µm) images [click to play animation | MP4]
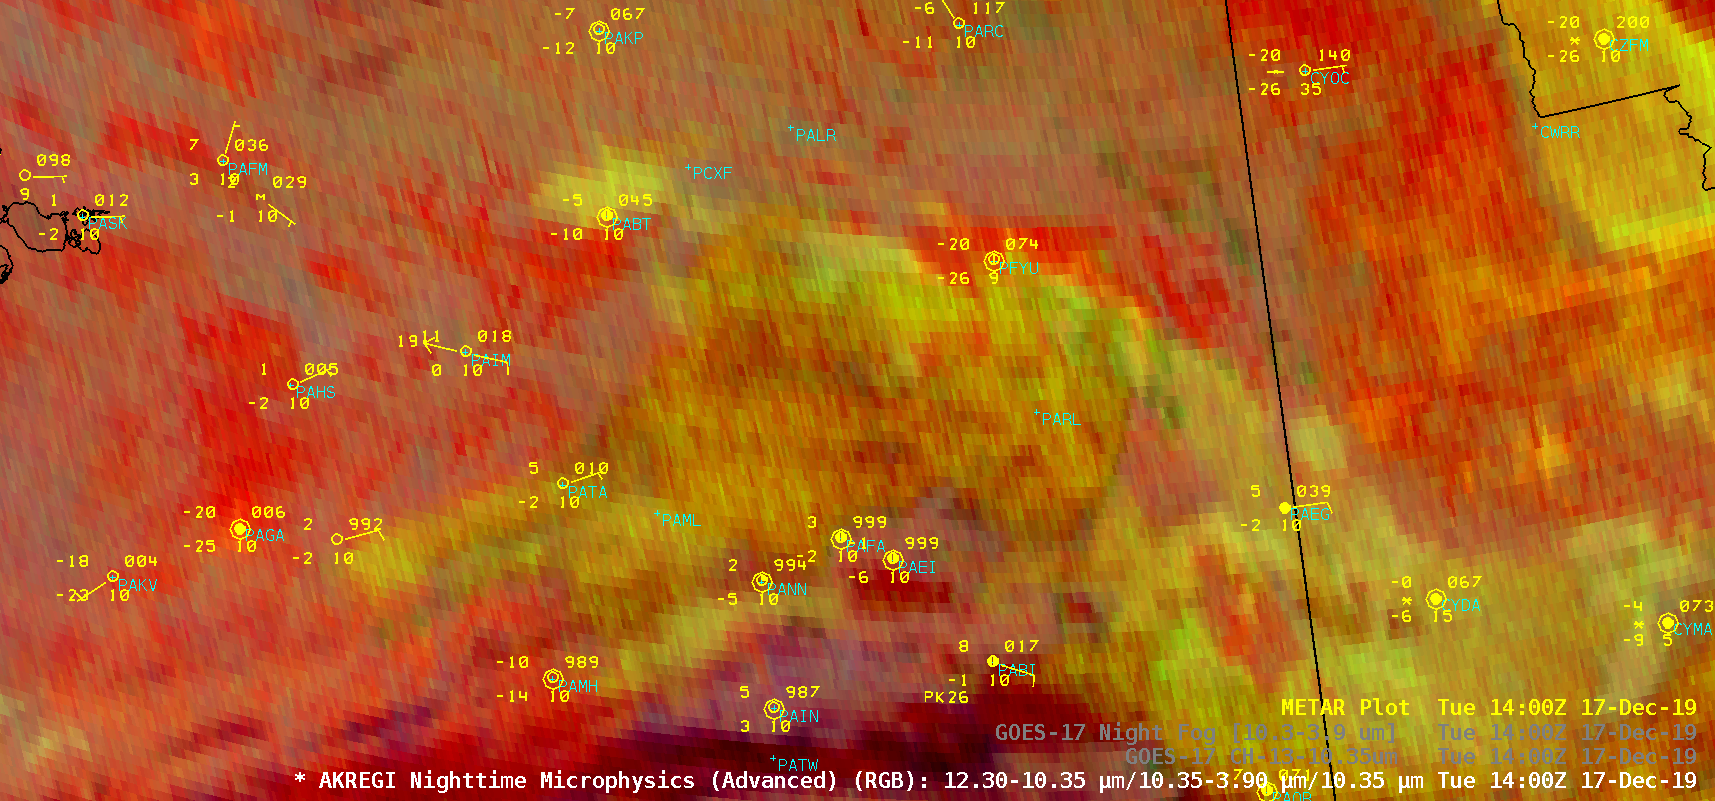
Farther to the north across Interior Alaska, some locations reported
minimum air temperatures in the -40s to -50s F. A Suomi NPP VIIRS Infrared image
(below) showed surface brightness temperatures as cold as -50ºC or -58ºF
(brighter yellow enhancement) in the Yukon Flats area around Fort Yukon (PFYU).
![NOAA-20 VIIRS Infrared Window (11.45 µm) image at 2220 UTC [click to enlarge]](https://cimss.ssec.wisc.edu/satellite-blog/images/2019/12/ak_viirs_ir-20191221_222059.png)
Suomi NPP VIIRS Infrared Window (11.45 µm) image at 2220 UTC [click to enlarge]
View only this post
Read Less
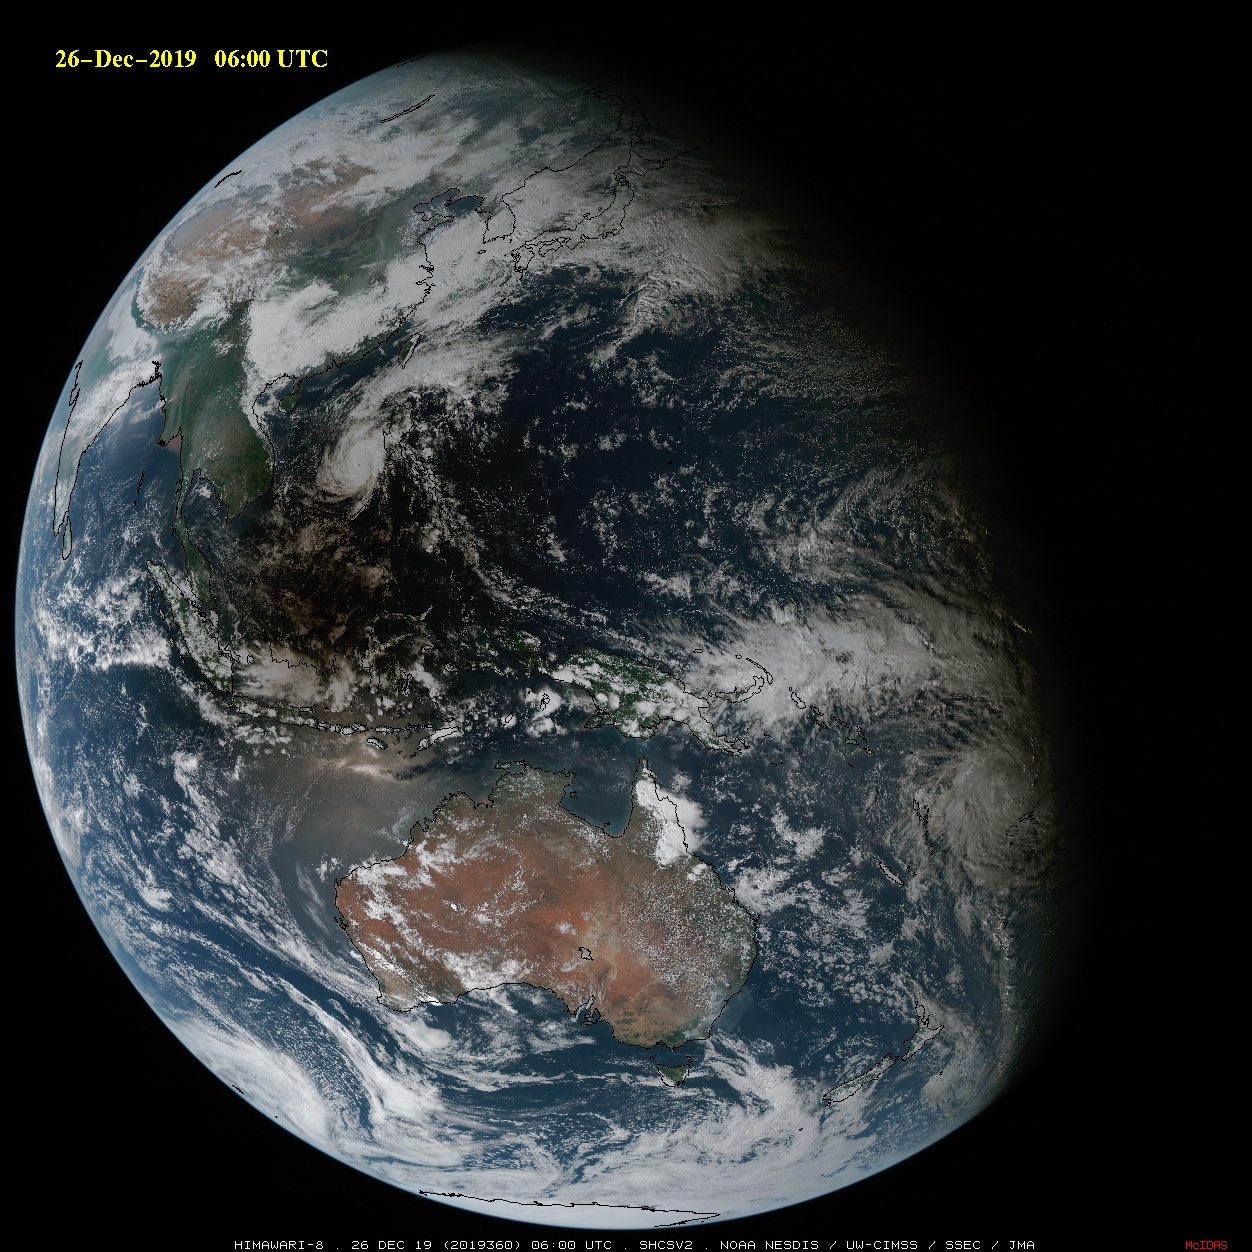
![Full Disk Himawari-8 True Color images [click to play animation | MP4]](https://cimss.ssec.wisc.edu/satellite-blog/images/2019/12/1252x1252_AHIM08_B1_SHCS_V2_FD_shadow_animated_2019360_020000_86_2019360_070000_86_X.gif)
![Himawari-8 True Color images centered over Indonesia [click to play animation | MP4]](https://cimss.ssec.wisc.edu/satellite-blog/images/2019/12/1000x1400_AHIM08_B1_SHCS_V2_m2_shadow_animated_2019360_040000_86_2019360_070000_86_X.gif)
![CMA FY-2G Visible (0.73 µm) images [click to play animation | MP4]](https://cimss.ssec.wisc.edu/satellite-blog/images/2019/12/191226_fy2g_visible_Solar_Eclipse_shadow_anim.gif)

![12 UTC rawinsonde data from Vandenberg, California [click to enlarge]](https://cimss.ssec.wisc.edu/satellite-blog/images/2019/12/191222_12utc_kvbg_raob.png)
![GOES-17 "Red" Visible (0.64 µm) images [click to play animation | MP4]](https://cimss.ssec.wisc.edu/satellite-blog/images/2019/12/191221_goes17_visible_AK_solstice_anim.gif)

![Plot of surface data from Bettles, Alaska [click to enlarge]](https://cimss.ssec.wisc.edu/satellite-blog/images/2019/12/191217_PABT_SFCMG.GIF)
![Plot of surface data from Fort Yukon, Alaska [click to enlarge]](https://cimss.ssec.wisc.edu/satellite-blog/images/2019/12/191217_PFYU_SFCMG.GIF)
