JMA Himawari-8 Shortwave Infrared (3.9 µm) and Longwave Infrared Window (10.4 µm) images (above) showed a large bushfire (dark black to red pixels in the 3.9 µm imagery) in far southeastern Victoria, Australia — which quickly burned its way to the coast and produced 3 distinct pulses of pyrocumulonimbus (pyroCb)... Read More
![Himawari-8 Shortwave Infrared (3.9 µm, top) and Longwave Infrared Window (10.4 µm, bottom) images [click to play animation | MP4]](https://cimss.ssec.wisc.edu/satellite-blog/images/2019/12/HIM08_SWIR_IR_AUSTRALIA_PYROCB_29DEC2019_B713_2019363_165000_0002PANELS_FRAME00065.GIF)
Himawari-8 Shortwave Infrared (3.9 µm, top) and Longwave Infrared Window (10.4 µm, bottom) images [click to play animation | MP4]
Himawari-8 Shortwave Infrared (3.9 µm) and Longwave Infrared Window (10.4 µm) images
(above) showed a large bushfire
(dark black to red pixels in the 3.9 µm imagery) in far southeastern Victoria, Australia — which quickly burned its way to the coast and produced 3 distinct pulses of
pyrocumulonimbus (pyroCb) clouds on 29 December 2019. To be classified as a pyroCb, the deep convective cloud must be generated by a large/hot fire (in this case, the Cann River fire complex), and eventually exhibit cloud-top 10.4 µm infrared brightness temperatures of -40ºC and colder (assuring the heterogeneous nucleation of all supercooled water droplets to ice crystals).
The coldest cloud-top 10.4 µm infrared brightness temperature was -62.6ºC (darker green pixels) at 1650 UTC. According to rawinsonde data from Melbourne (below), this corresponded to an altitude near 13 km.
![Plots of rawinsonde data from Melbourne, Australia [click to enlarge]](https://cimss.ssec.wisc.edu/satellite-blog/images/2019/12/191229_YMML_RAOBS.GIF)
Plots of rawinsonde data from Melbourne, Australia [click to enlarge]
The long/narrow thermal anomaly of the hot bushfire — which burned southwestward all the way to the coast — was outlined in dark black pixels on VIIRS Infrared Window (11.45 µm) images from NOAA-20 and Suomi NPP, as viewed using
RealEarth (below).
![w (11.45 µm) images from NOAA-20 and Suomi NPP [click to enlarge]](https://cimss.ssec.wisc.edu/satellite-blog/images/2019/12/191229_noaa20_suomiNPP_viirs_infrared_Australia_pyroCb_anim.gif)
VIIRS Infrared Window (11.45 µm) images from NOAA-20 and Suomi NPP [click to enlarge]
===== 30 December Update =====
![Himawari-8 Shortwave Infrared (3.9 µm, top) and Longwave Infrared Window (10.4 µm, bottom) images [click to play animation | MP4]](https://cimss.ssec.wisc.edu/satellite-blog/images/2019/12/HIM08_SWIR_IR_TARGET_AUSTRALIA_PYROCB_29_30DEC2019_B713_2019364_030215_0002PANELS_FRAME00093.GIF)
Himawari-8 Shortwave Infrared (3.9 µm, top) and Longwave Infrared Window (10.4 µm, bottom) images [click to play animation | MP4]
A Himawari-8 Target Sector was positioned over southeastern Australia beginning at 2312 UTC on 29 December, providing images at 2.5-minute intervals — a comparison of Shortwave Infrared and Longwave Infrared Window imagery
(above) revealed the formation of several additional pyroCb clouds as southeastern Victoria bushfires continued to grow in number and size. During the daytime, pyroCb cloud tops will appear warmer
(darker gray) than those of conventional thunderstorms in the 3.9 µm imagery, due to enhanced reflection of solar radiation off the smaller ice crystals found in the pyroCb anvil. Development of the multiple deep convective pyroCb clouds on this day may have been aided by forcing for ascent provided by an approaching
cold front and
mid-tropospheric trough, along with favorable
upper-tropospheric jet streak dynamics.
The coldest Himawari-8 cloud-top 10.4 µm brightness temperature on 30 December was -73.15ºC at 13:24:41 UTC (violet pixel near the coast); this was 5ºC colder than the coldest temperature of -68.1ºC — at an altitude of 15 km — on 12 UTC rawinsonde data from Melbourne (below). During the 12-hour period between the 2 soundings, the coded tropopause ascended from a height of 13.1 km (-63.7ºC) at 00 UTC to 14.2 km (-67.5ºC) at 12 UTC.
![Plots of rawinsonde data from Melbourne, Australia at 00 UTC (yellow) and 12 UTC (cyan) [click to enlarge]](https://cimss.ssec.wisc.edu/satellite-blog/images/2019/12/191230_00UTC_12UTC_YMML_RAOBS.GIF)
Plots of rawinsonde data from Melbourne, Australia at 00 UTC (yellow) and 12 UTC (cyan) [click to enlarge]
In a toggle between VIIRS Infrared Window (11.45 µm) images from NOAA-20 and Suomi NPP is shown
(below), a large pyroCb cloud was seen moving eastward away from the bushfires.
![VIIRS Infrared Window (11.45 µm) images from NOAA-20 and Suomi NPP [click to enlarge]](https://cimss.ssec.wisc.edu/satellite-blog/images/2019/12/191230_14utc_noaa20_15utc_suomiNPP_viirs_infrared_Australia_pyroCb_anim.gif)
VIIRS Infrared Window (11.45 µm) images from NOAA-20 and Suomi NPP [click to enlarge]
===== 31 December Update =====
![Suomi NPP VIIRS Day/Night Band, Shortwave Infrared, Near-Infrared & Active Fire Product images at 1455 UTC on 31 December (credit: William Straka, CIMSS) [click to enlarge]](https://cimss.ssec.wisc.edu/satellite-blog/images/2019/12/191231_1455utc_suomiNPP_viirs_dayNightBand_shortwaveInfrared_nearInfrared_activeFireProduct_Australia_anim.gif)
Suomi NPP VIIRS Day/Night Band (0.7 µm), Shortwave Infrared (3.75 µm and 4.05 µm), Near-Infrared (1.61 µm and 2.25 µm) & Active Fire Product images at 1455 UTC on 31 December (credit: William Straka, CIMSS) [click to enlarge]
Suomi NPP VIIRS Day/Night Band, Shortwave Infrared, Near-Infrared & Active Fire Product images
(above) showed nighttime signatures of the widespread bushfires across Victoria and New South Wales at 1455 UTC on 31 December (or 1:55 am local time on 01 January). In the town of Mallacoota, about 4000 people were forced to evacuate their homes and take shelter along the coast (
media report). The surface air temperature at Mallacoota Airport briefly increased to 49ºC (120ºF) at 8:00 am local time as the fires approached
(below).
A sequence of daily Aqua MODIS True Color RGB images with an overlay of VIIRS Fire Radiative Power showed the fires and smoke during the 29-31 December period (below).
![Aqua MODIS True Color RGB images with an overlay of VIIRS Fire Radiative Power [click to enlarge]](https://cimss.ssec.wisc.edu/satellite-blog/images/2019/12/191229_191231_aqua_modis_trueColorRGB_viirs_fireRadiativePower_Australia_anim.gif)
Aqua MODIS True Color RGB images with an overlay of VIIRS Fire Radiative Power [click to enlarge]
A multi-day Himawari-8 GeoColor animation covering the period 28 December – 01 January is available here.
View only this post
Read Less
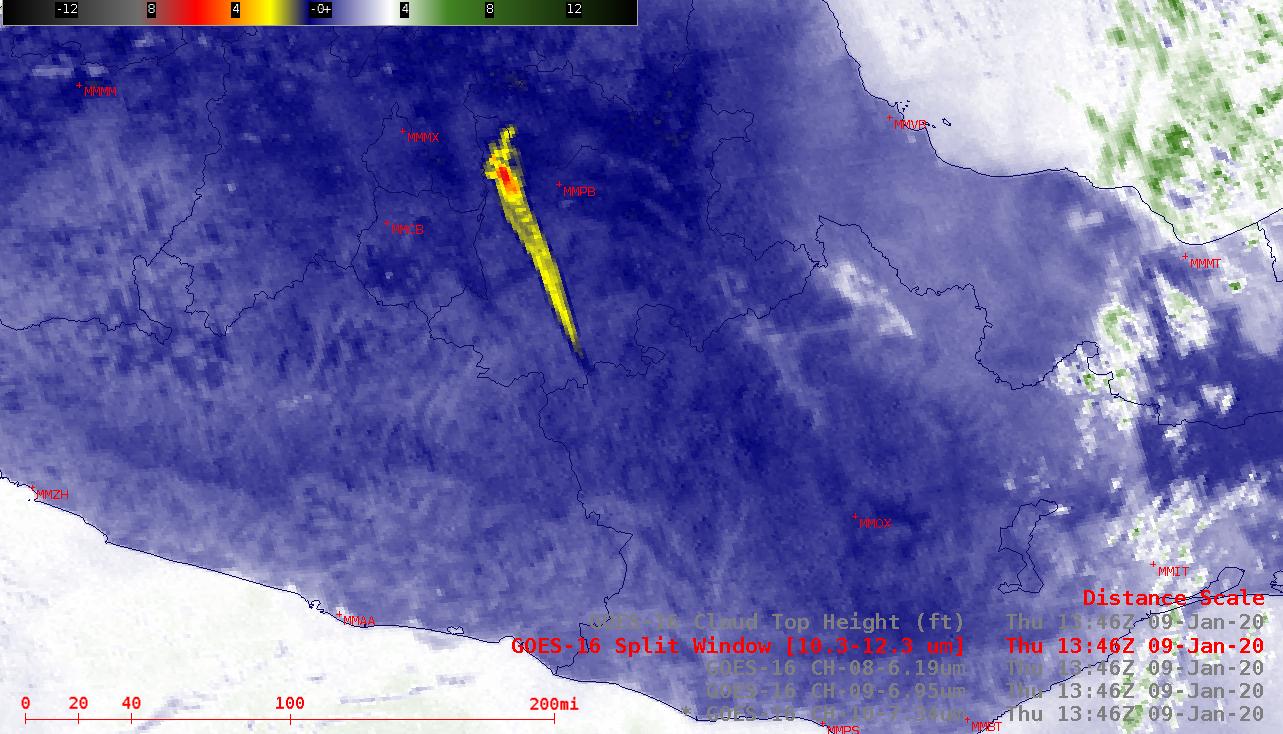
![GOES-16 Low-, Mid- and Upper-level Water Vapor (7.3 µm, 6.9 µm and 6.2 µm), Split Window Difference (10.3-12.3 µm) and Cloud Top Height product [click to play animation | MP4]](https://cimss.ssec.wisc.edu/satellite-blog/images/2020/01/200109_goes16_waterVapor_splitWindowDifference_Popocatepetl_anim.gif)
![Plots of rawinsonde data from Mexico City and Acapulco at 12 UTC [click to enlarge]](https://cimss.ssec.wisc.edu/satellite-blog/images/2020/01/200109_12UTC_MMMX_MMAA_RAOBS.GIF)
![GOES-16 Ash RGB images {click to play animation | MP4]](https://cimss.ssec.wisc.edu/satellite-blog/images/2020/01/GOES-16_RadM2_ash_2020009_140200_2020009_163000.gif)
![GOES-16 Ash Height product [click to play animation MP4]](https://cimss.ssec.wisc.edu/satellite-blog/images/2020/01/200109_ashHeight_Popocatepetl_anim.gif)

![Himawari-8 Shortwave Infrared (3.9 µm, top) and "Clean" Infrared Window (10.4 µm, bottom) images [click to play animation | MP4]](https://cimss.ssec.wisc.edu/satellite-blog/images/2020/01/200104_himawari8_shortwaveInfrared_longwaveInfrared_Austrailia_pyroCbs_anim.gif)
![Himawari-8 Shortwave Infrared (3.9 µm, top) and "Clean" Infrared Window (10.4 µm, bottom) images [click to play animation | MP4]](https://cimss.ssec.wisc.edu/satellite-blog/images/2020/01/200104_himawari8_shortwaveInfrared_longwaveInfrared_YSNW_Austrailia_pyroCbs_anim.gif)
![Sequence of VIIRS True Color RGB and Infrared Window (11.45 um) images from NOAA-20 and Suomi NPP [click to enlarge]](https://cimss.ssec.wisc.edu/satellite-blog/images/2020/01/200104_03utc_04utc_noaa20_suomiNPP_truecolorRGB_infraredWindow_Australia_pyrocbs_anim.gif)
![GOES-16 Natural Color RGB images + Smoke Detection derived product [click to play animation | MP4]](https://cimss.ssec.wisc.edu/satellite-blog/images/2020/01/200106_goes16_naturalColorRGB_smokeDetection_Australian_smoke_over_South_America_anim.gif)
![GOES-17 True Color RGB images [click to play animation | MP4]](https://cimss.ssec.wisc.edu/satellite-blog/images/2020/01/GOES-17_RadF_true_color_2020006_170000_2020006_210000.gif)
![GOES-17 True Color RGB images, 05-08 January [click to play animation | MP4]](https://cimss.ssec.wisc.edu/satellite-blog/images/2020/01/200105_200107_goes17_truecolor_Australian_smoke_anim.gif)
![GOES-17 True Color images [click to play animation | MP4]](https://cimss.ssec.wisc.edu/satellite-blog/images/2020/01/200108_200109_goes17_trueColorRGB_Australian_smoke_Antarctica_anim.gif)
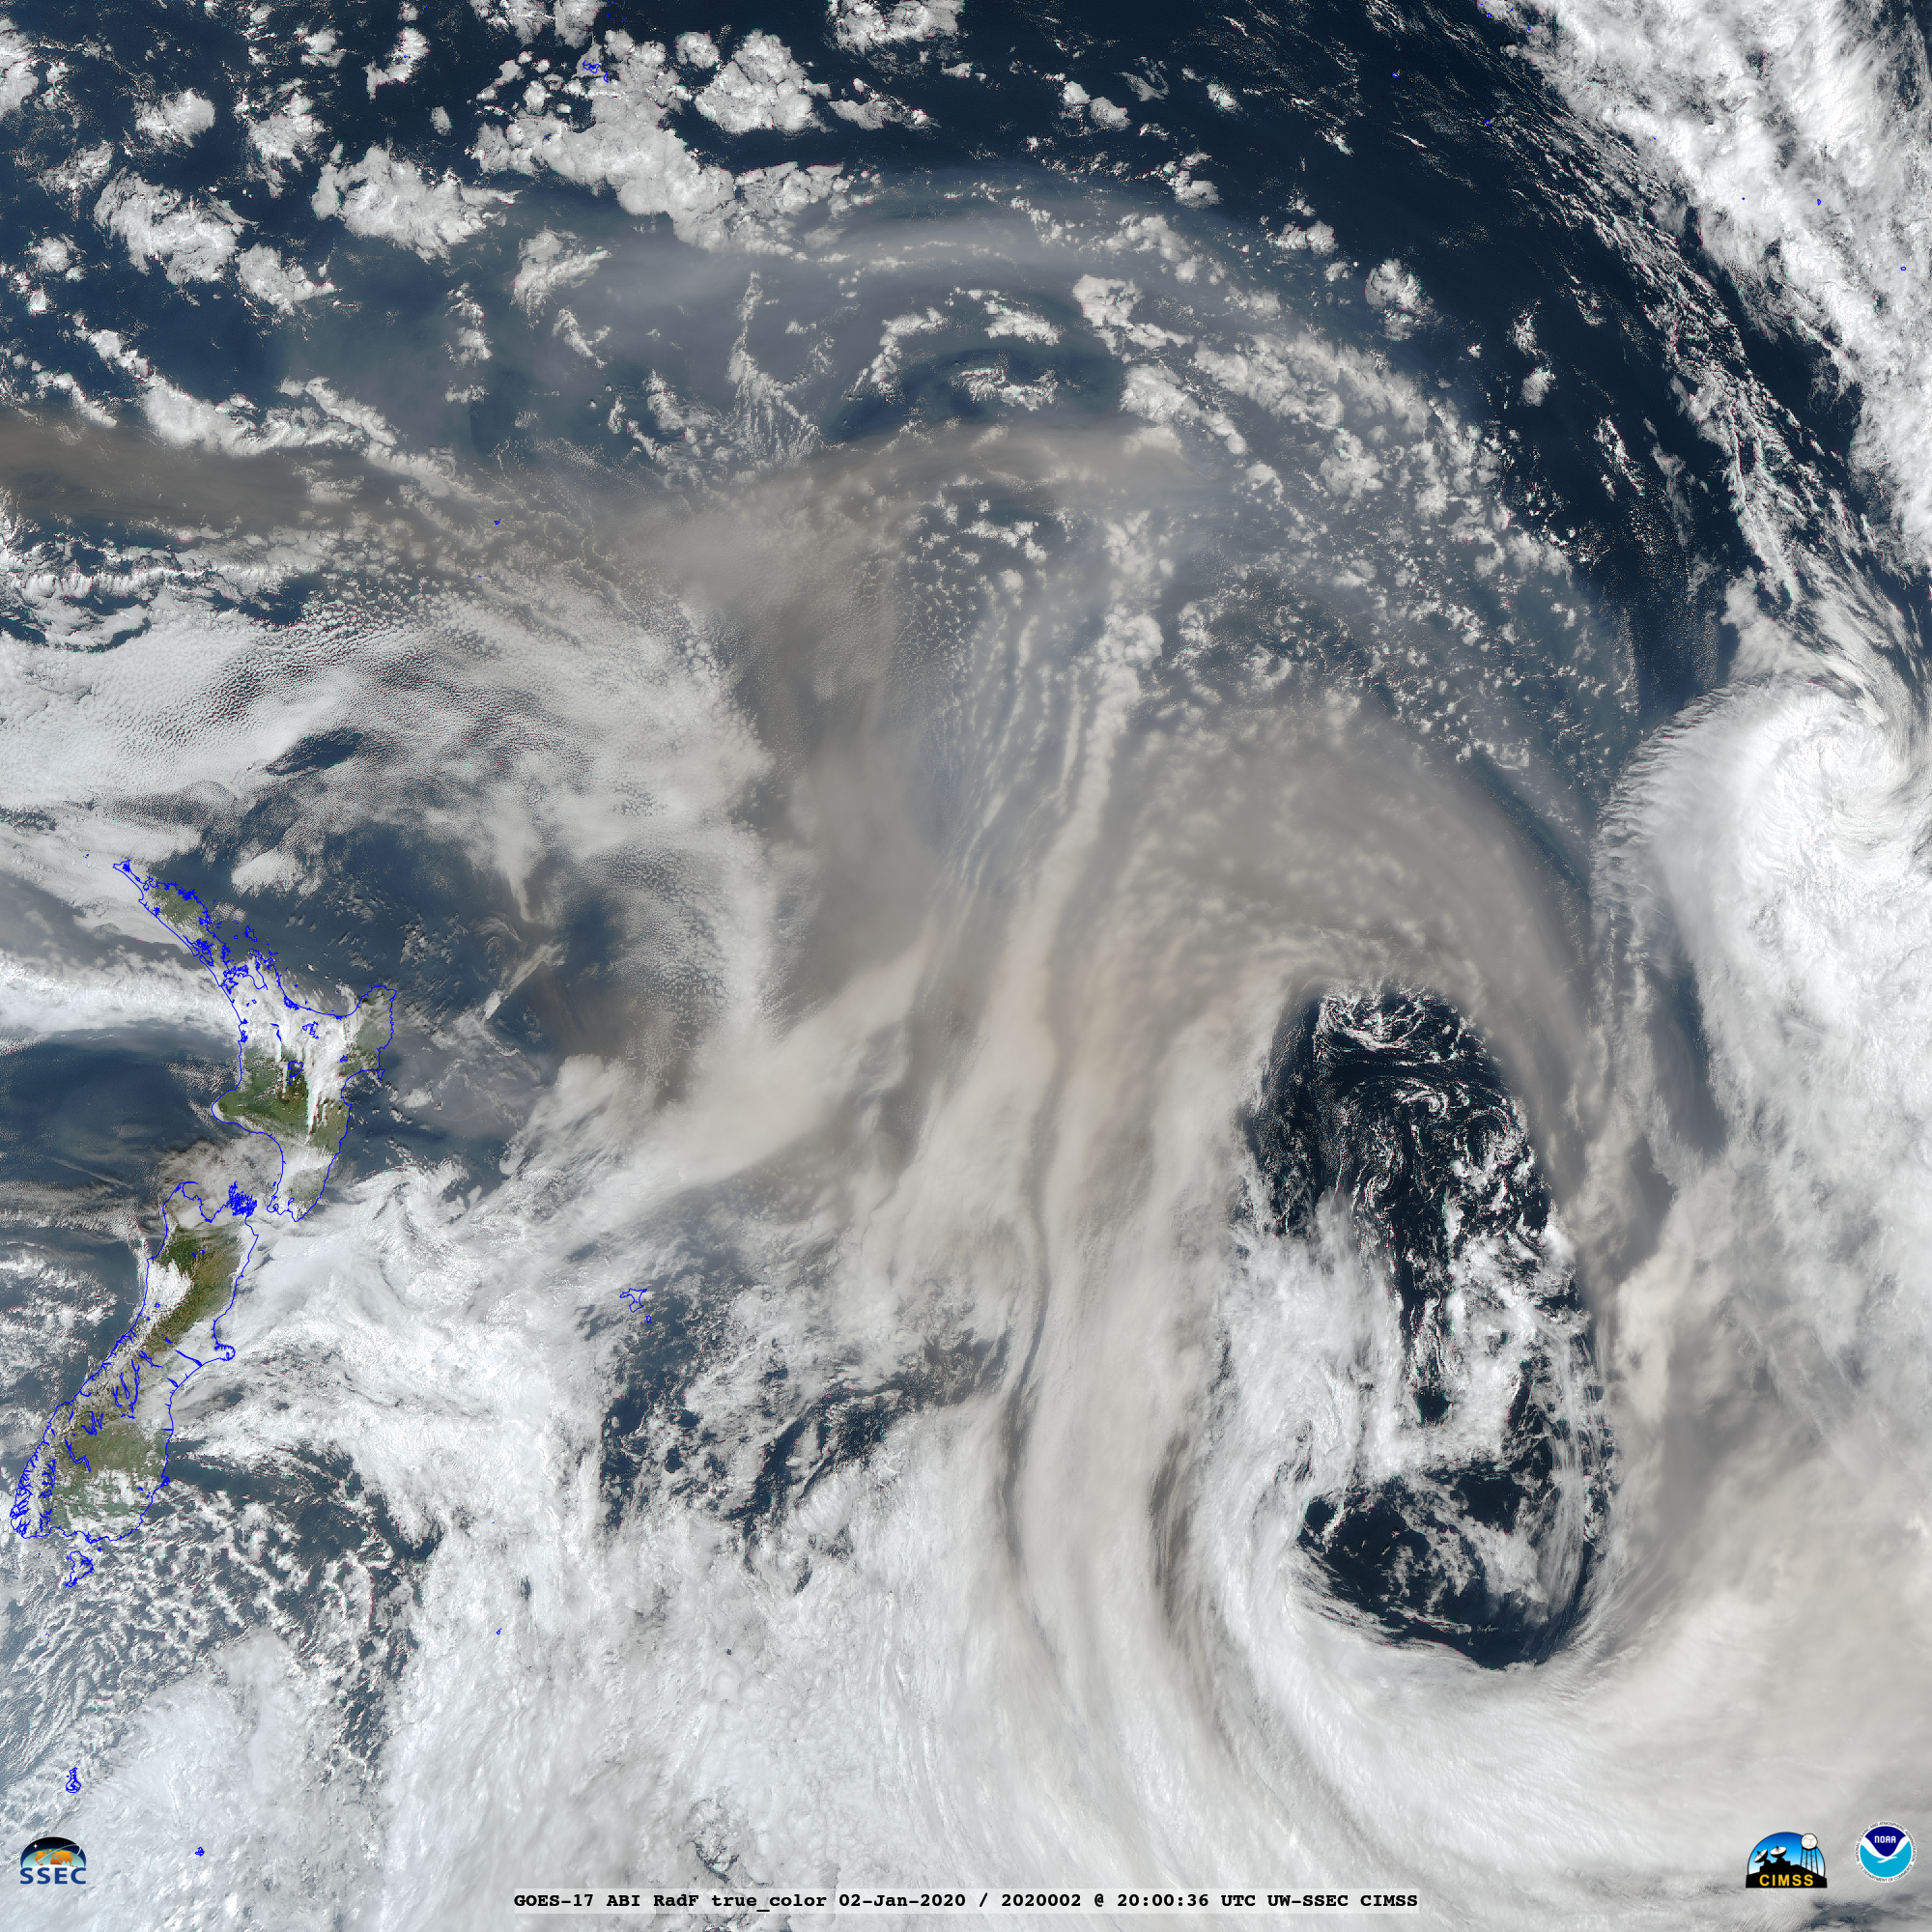
![GOES-17 True Color RGB images [click to play animation | MP4]](https://cimss.ssec.wisc.edu/satellite-blog/images/2020/01/200102_goes17_trueColorRGB_South_Pacific_Australian_smoke_anim.gif)
![GFS model Mean Sea Level Pressure anomalies [click to enlarge]](https://cimss.ssec.wisc.edu/satellite-blog/images/2020/01/200101_200102_meanSeaLevelPressure_anomaly_anim.gif)
![GFS model 500 hPa Geopotential Height anomalies [click to enlarge]](https://cimss.ssec.wisc.edu/satellite-blog/images/2020/01/200101_200102_500hpaGeopotentialHeight_anomaly_anim.gif)
![Himawari-8 Shortwave Infrared (3.9 µm, top) and Longwave Infrared Window (10.4 µm, bottom) images [click to play animation | MP4]](https://cimss.ssec.wisc.edu/satellite-blog/images/2019/12/191229_himawari8_shortwaveInfrared_longwaveInfrared_Australia_pyroCb_anim.gif)
![Himawari-8 Shortwave Infrared (3.9 µm, top) and Longwave Infrared Window (10.4 µm, bottom) images [click to play animation | MP4]](https://cimss.ssec.wisc.edu/satellite-blog/images/2019/12/191229_191230_himawari8_target_shortwaveInfrared_longwaveInfrared_Australia_pyroCbs_anim.gif)
