GOES-16 (GOES-East) Air Mass RGB images (above) displayed the characteristic pale yellow hues associated with cold arctic air that was moving southward behind a deep area of low pressure centered over Hudson Bay and northern Quebec, Canada on 12 February 2020.A sequence of GOES-16 “Red” Visible (0.64 µm), Near-Infrared “Snow/Ice” (1.61 µm) and Day Snow-Fog RGB images (below)... Read More
![GOES-16 Air Mass RGB images, with surface fronts plotted in cyan and NAM80 model 500 hPa geopotential height plotted in yellow [click to play animation | MP4]](https://cimss.ssec.wisc.edu/satellite-blog/images/2020/02/airmass-20200212_120004.png)
GOES-16 Air Mass RGB images, with surface fronts plotted in cyan and NAM80 model 500 hPa geopotential height plotted in yellow [click to play animation | MP4]
GOES-16
(GOES-East) Air Mass RGB images
(above) displayed the characteristic pale yellow hues associated with cold arctic air that was moving southward behind a deep area of low pressure centered over Hudson Bay and northern Quebec, Canada on
12 February 2020.
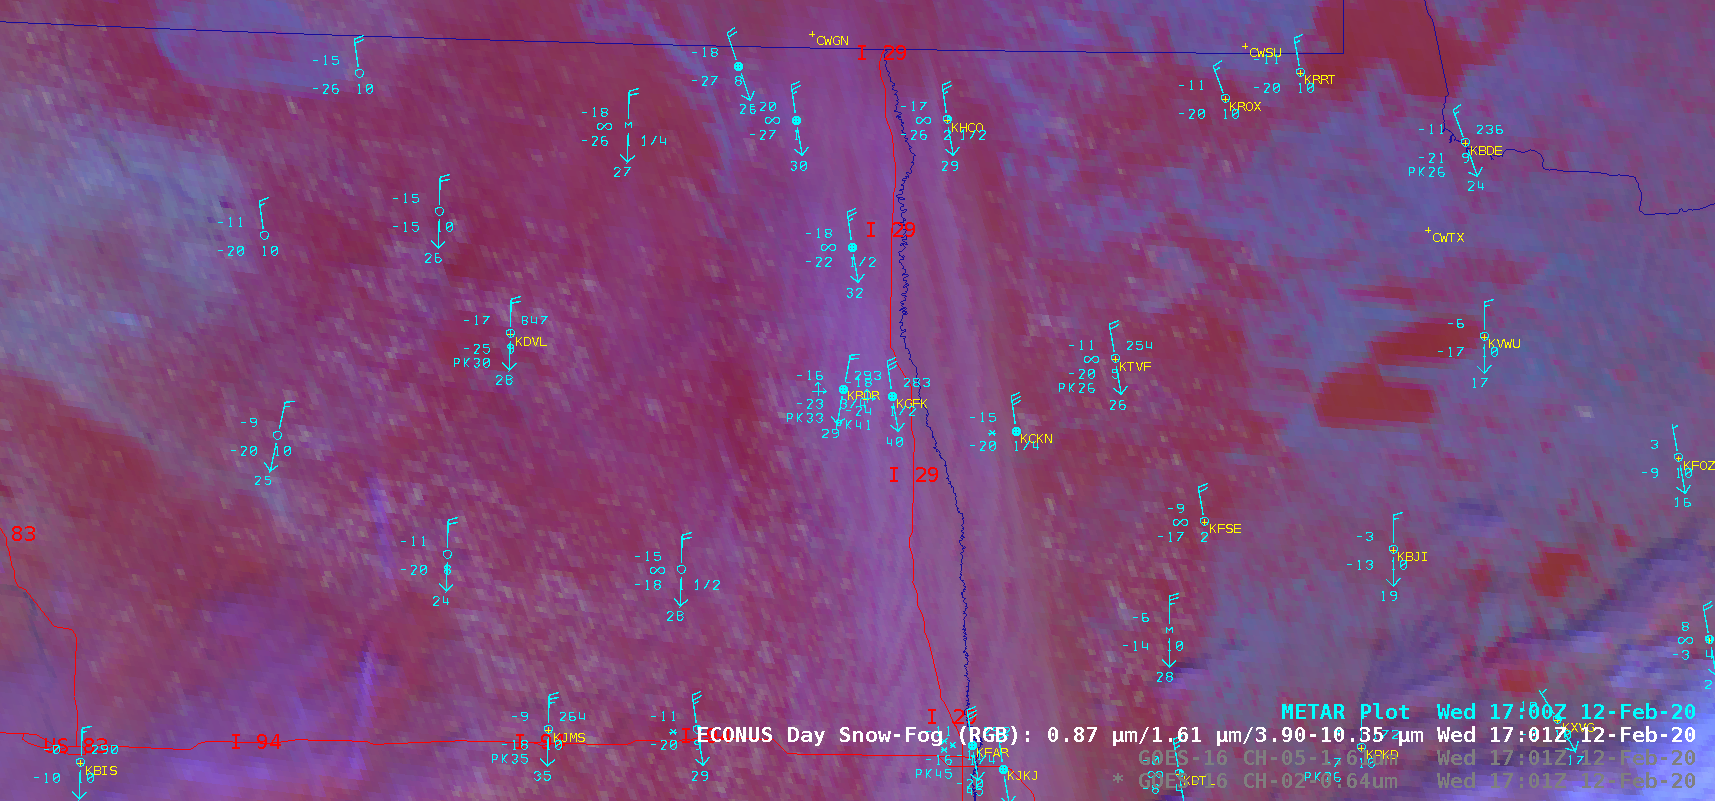
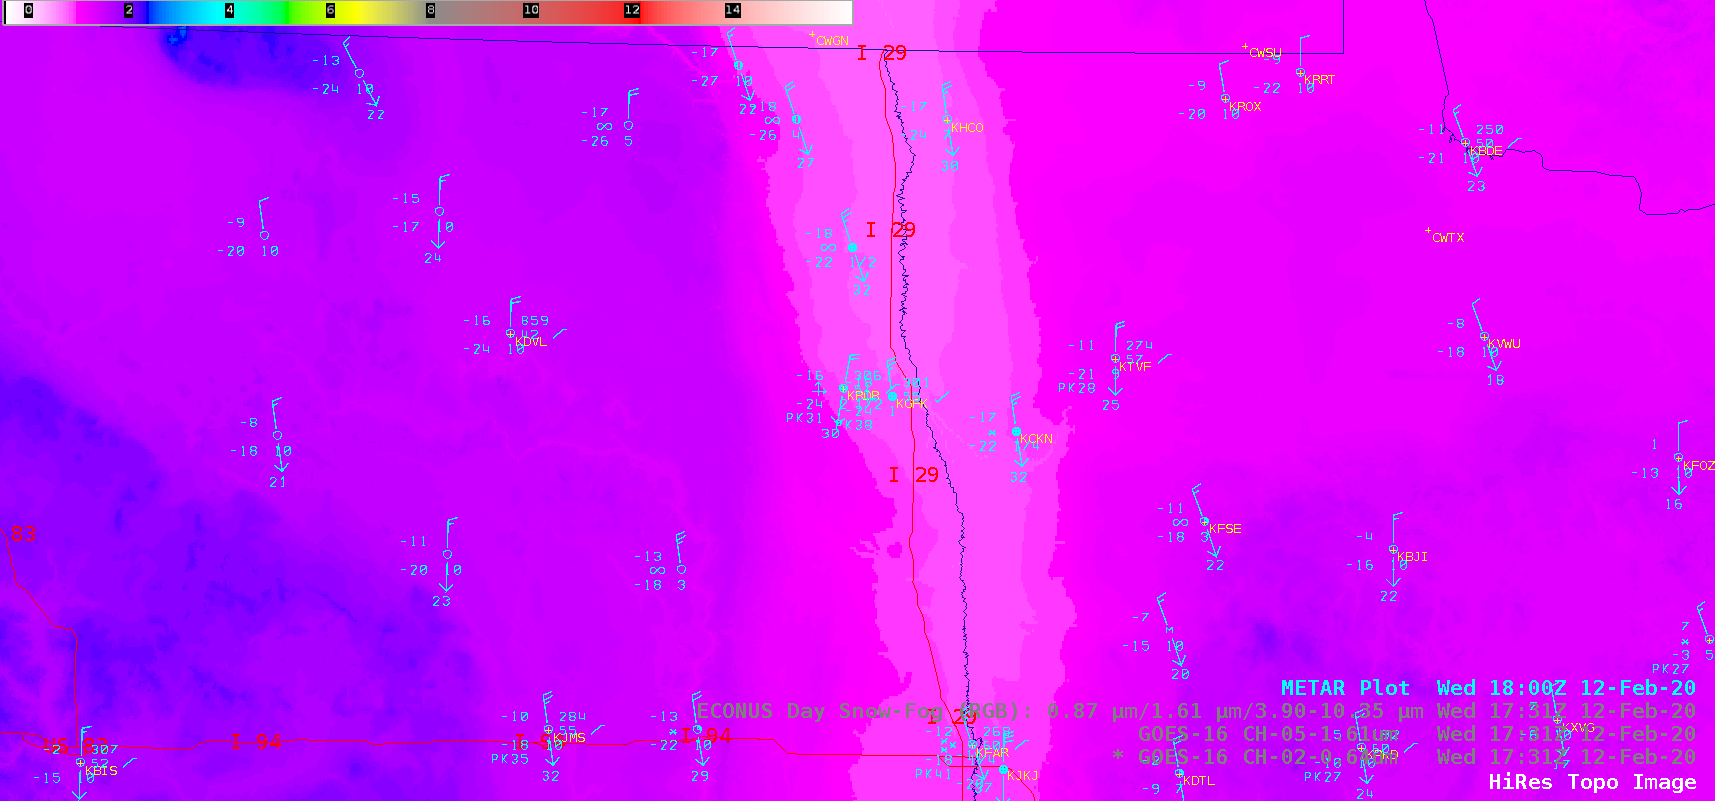
A sequence of GOES-16 “Red” Visible (0.64 µm), Near-Infrared “Snow/Ice” (1.61 µm) and Day Snow-Fog RGB images (below) revealed north-to-south oriented horizontal convective rolls that highlighted areas where blowing snow was creating ground blizzard conditions across the Red River Valley of North Dakota/Minnesota (the strongest winds were being channeled southward through the lower terrain of the RRV). The surface visibility was reduced to near zero in rural areas — and in eastern North Dakota, Interstate 29 was closed from the Canadian border to the South Dakota border. Toward the end of the day, conditions slowly began to improve in the northern portion of the Red River Valley — from Grand Forks (KGFK) northward — as surface winds decreased, horizontal convective rolls dissipated, and visibility started to increase. More information on this event is available from NWS Grand Forks and the Satellite Liaison Blog.

GOES-16 “Red” Visible (0.64 µm), Near-Infrared “Snow/Ice” (1.61 µm) and Day Snow-Fog RGB images, with plots of surface reports [click to play animation | MP4]
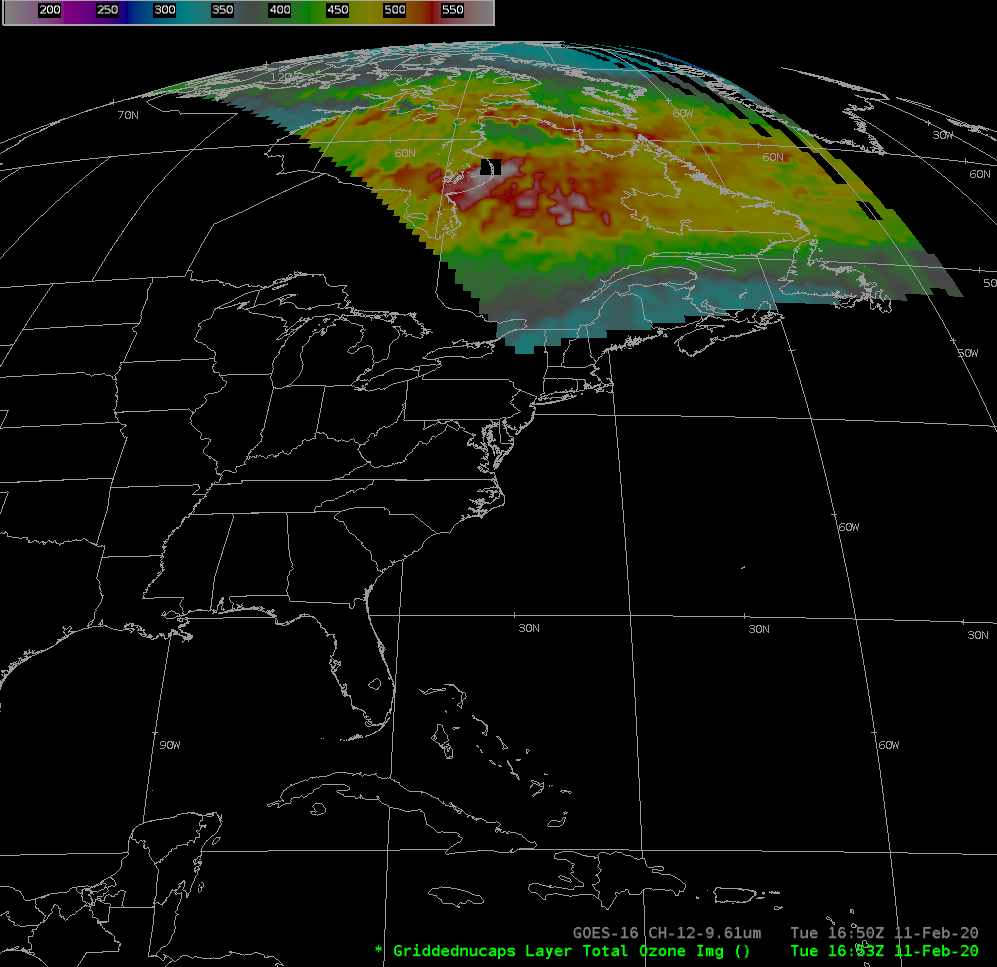
Another feature of interest was the rapidly intensifying Hurricane Force low pressure system just south of the Canadian Maritime Provinces (
surface analyses) — with a lowering tropopause along the western edge of the storm, a swath of the NOAA-20 Gridded NUCAPS Total Column Ozone product
(below) showed a lobe of higher ozone extending southward behind the surface low (and along the axis of its 500 hPa trough). That region of higher ozone was also apparent
the day before, on 11 February, as shown in
this blog post.
![NOAA-20 Gridded NUCAPS Total Column Ozone product [click to enlarge]](https://cimss.ssec.wisc.edu/satellite-blog/images/2020/02/ozone-20200212_163003.png)
NOAA-20 Gridded NUCAPS Total Column Ozone product [click to enlarge]
View only this post
Read Less
![GOES-16 Low-level Water Vapor (7.3 µm) images [click to play animation | MP4]](https://cimss.ssec.wisc.edu/satellite-blog/images/2020/02/200213_goes16_waterVapor_Upper_Midwest_anim.gif)
![13 February / 12 UTC TPW climatology and water vapor weighting functions for Bismarck, ND [click to enlarge]](https://cimss.ssec.wisc.edu/satellite-blog/images/2020/02/200213_12utc_kbis_tpw_climatology_waterVapor_weightingFunctions.png)
![13 February / 12 UTC TPW climatology and water vapor weighting functions for Aberdeen, SD [click to enlarge]](https://cimss.ssec.wisc.edu/satellite-blog/images/2020/02/200213_12utc_kabr_tpw_climatology_waterVapor_weightingFunctions.png)
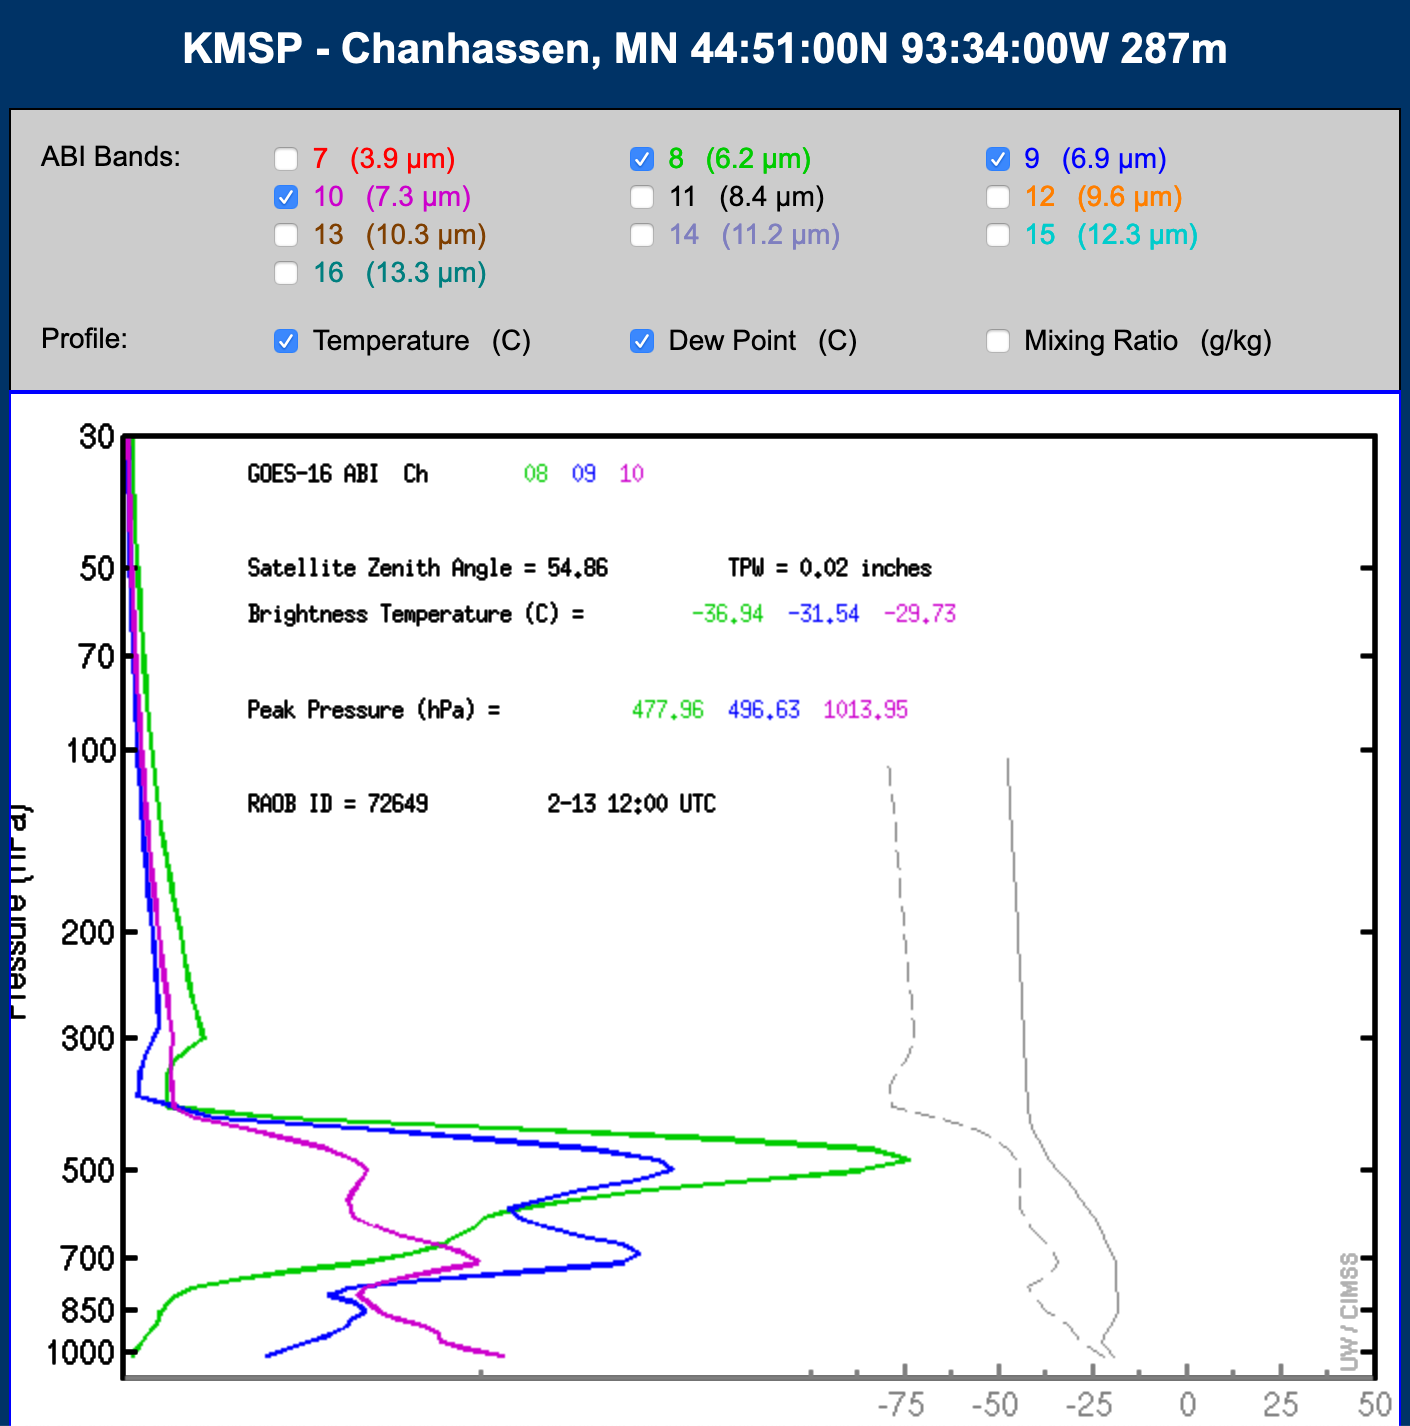
![13 February / 12 UTC TPW climatology and water vapor weighting functions for Minneapolis/Chanhassen, MN [click to enlarge]](https://cimss.ssec.wisc.edu/satellite-blog/images/2020/02/200213_12utc_kmpx_tpw_climatology_waterVapor_weightingFunctions.png)


![GOES-16 Air Mass RGB images, with surface fronts plotted in cyan and NAM80 model 500 hPa geopotential height plotted in yellow [click to play animation | MP4]](https://cimss.ssec.wisc.edu/satellite-blog/images/2020/02/200212_goes16_airMassRGB_anim.gif)

