Water Vapor imagery sensing the surface in a cold/dry air mass
![GOES-16 Low-level Water Vapor (7.3 µm) images [click to play animation | MP4]](https://cimss.ssec.wisc.edu/satellite-blog/images/2020/02/200213_goes16_waterVapor_Upper_Midwest_anim.gif)
GOES-16 Low-level Water Vapor (7.3 µm) images [click to play animation | MP4]
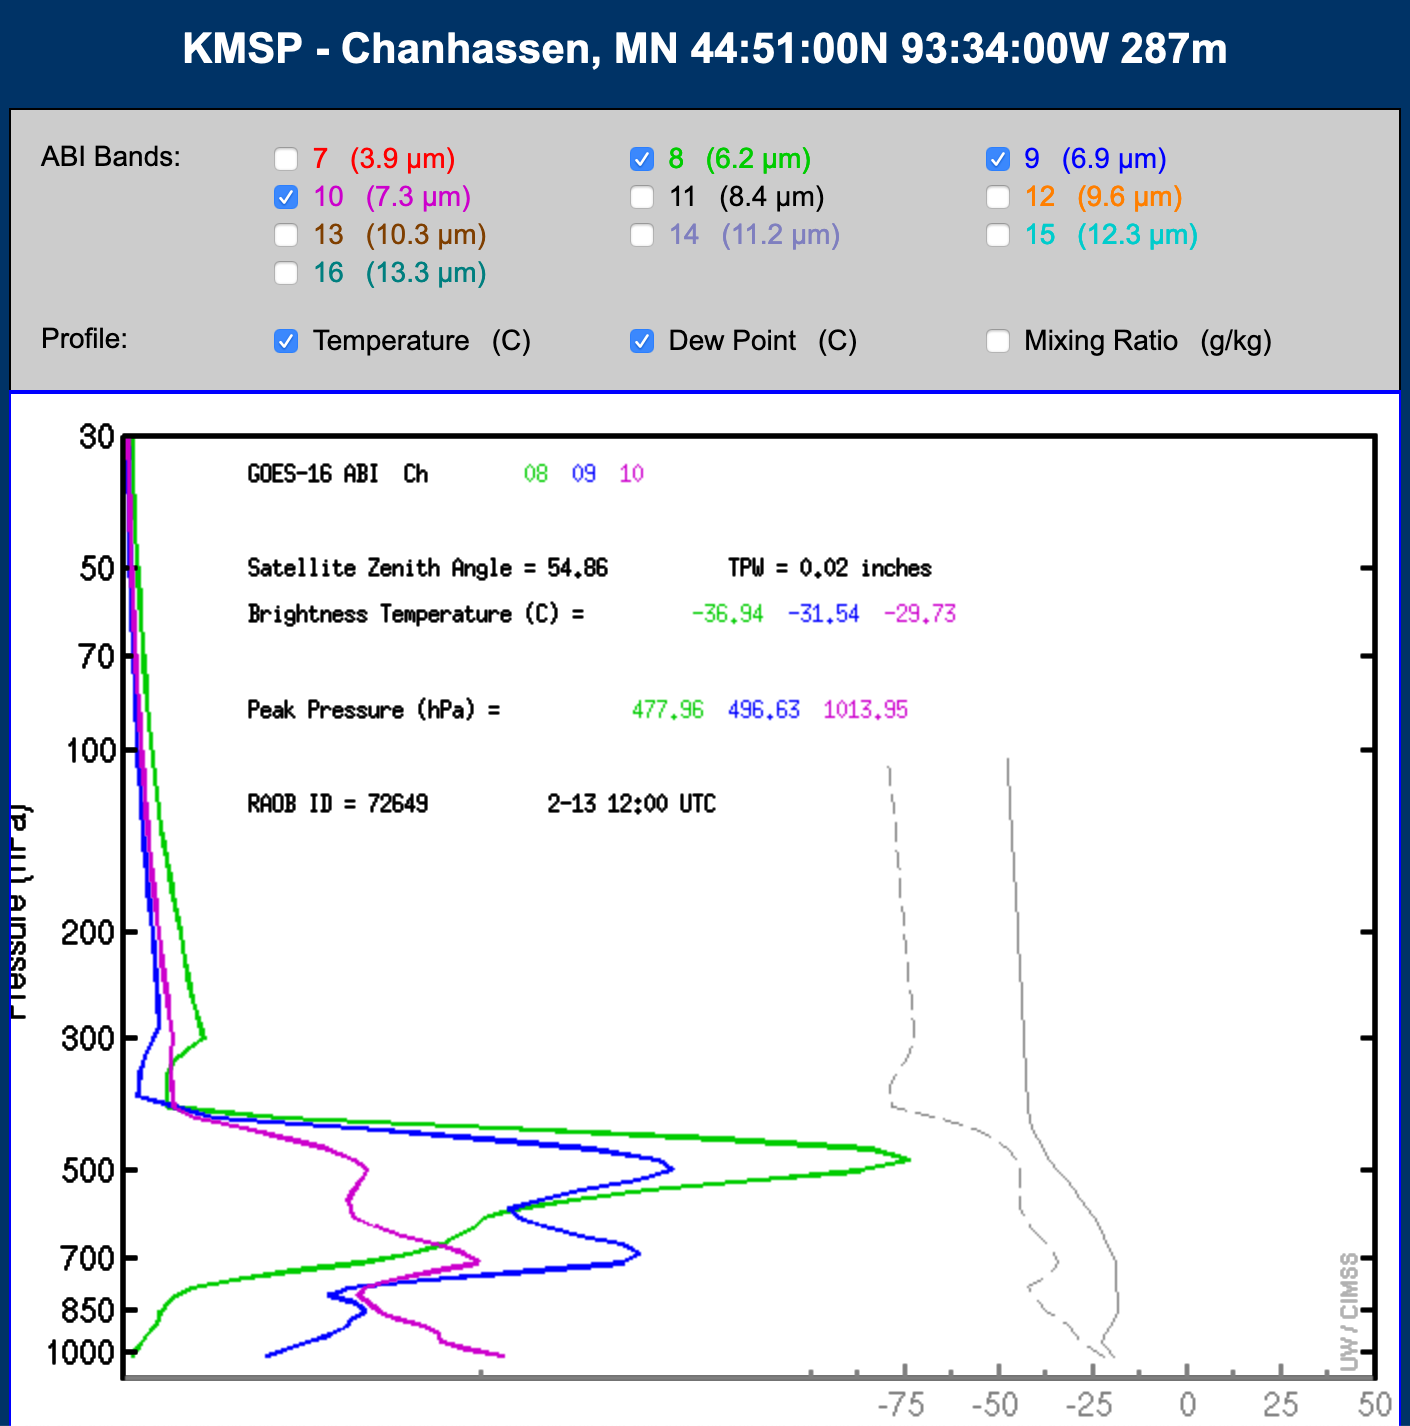
The arctic air mass was so dry that Total Precipitable Water derived from rawinsonde data set record low values for the date/time (source) at a few regional sounding sites such as Bismarck ND (KBIS), Aberdeen SD (KABR) and Minneapolis/Chanhassen MN (KMPX) — and this shifted the 7.3 µm water vapor weighting functions to altitudes low enough to sense a significant amount of upwelling surface radiation (below). In fact, at KMPX the 7.3 µm water vapor weighting function actually peaked at the surface!
![13 February / 12 UTC TPW climatology and water vapor weighting functions for Bismarck, ND [click to enlarge]](https://cimss.ssec.wisc.edu/satellite-blog/images/2020/02/200213_12utc_kbis_tpw_climatology_waterVapor_weightingFunctions.png)
13 February / 12 UTC TPW climatology and water vapor weighting functions for Bismarck, ND [click to enlarge]
![13 February / 12 UTC TPW climatology and water vapor weighting functions for Aberdeen, SD [click to enlarge]](https://cimss.ssec.wisc.edu/satellite-blog/images/2020/02/200213_12utc_kabr_tpw_climatology_waterVapor_weightingFunctions.png)
13 February / 12 UTC TPW climatology and water vapor weighting functions for Aberdeen, SD [click to enlarge]
![13 February / 12 UTC TPW climatology and water vapor weighting functions for Minneapolis/Chanhassen, MN [click to enlarge]](https://cimss.ssec.wisc.edu/satellite-blog/images/2020/02/200213_12utc_kmpx_tpw_climatology_waterVapor_weightingFunctions.png)
13 February / 12 UTC TPW climatology and water vapor weighting functions for Minneapolis/Chanhassen, MN [click to enlarge]