
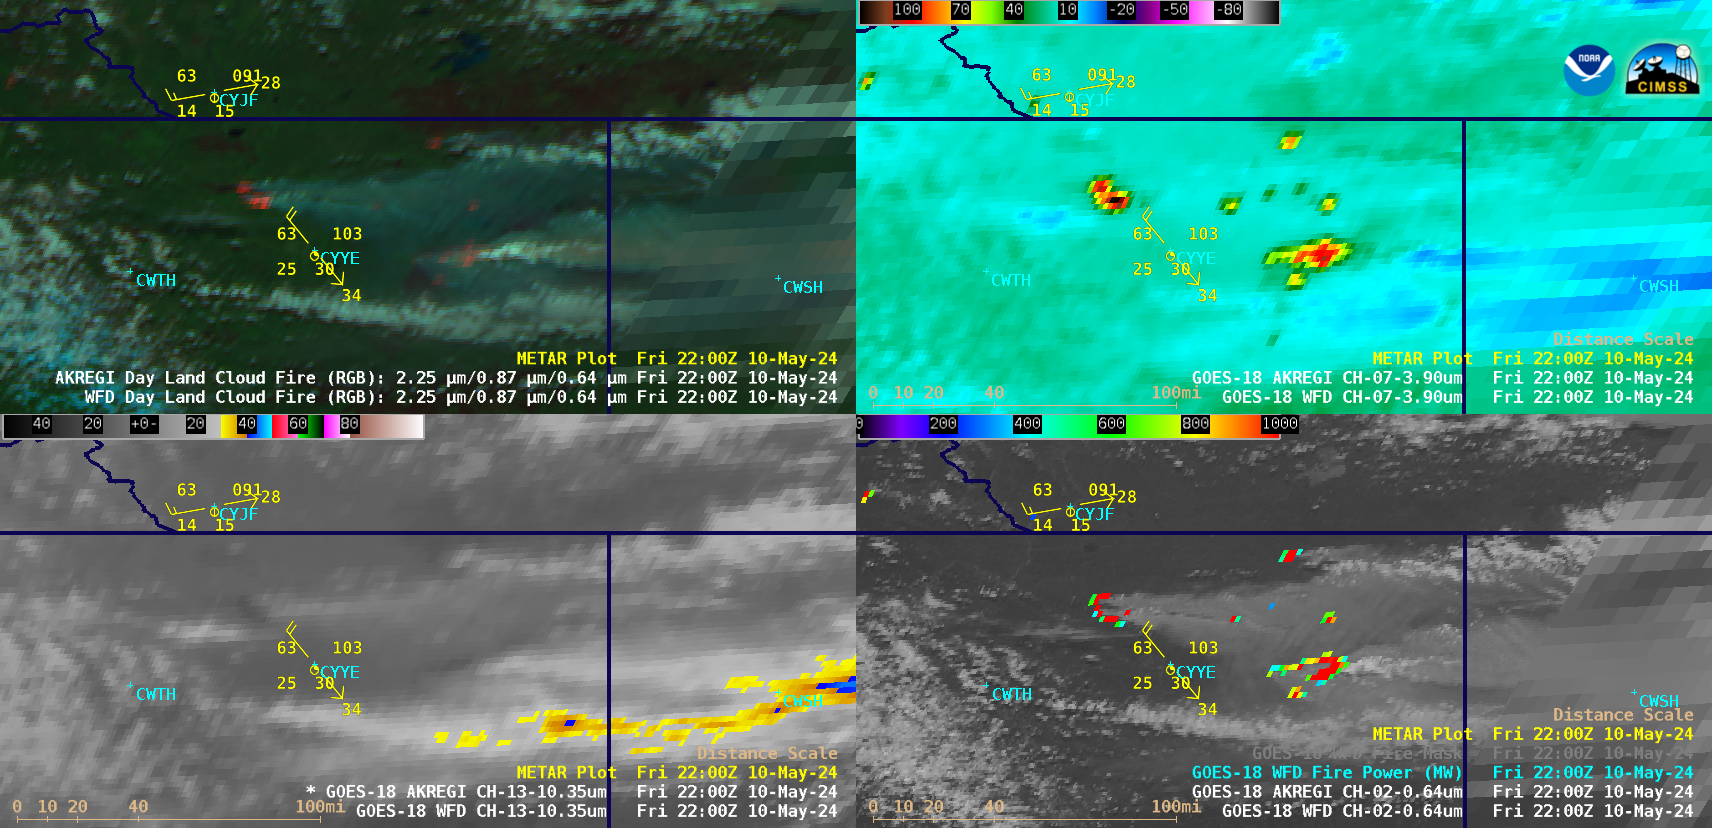
10-minute Full Disk sector GOES-18 (GOES-West) Day Land Cloud Fire RGB, Shortwave Infrared (3.9 µm), “Clean” Infrared Window (10.3 µm) and “Red” Visible (0.64 µm) + Fire Power derived product (a component of the GOES Fire Detection and Characterization Algorithm FDCA) images (above) showed signatures of multiple wildfires across northeastern British Columbia on 10 May 2024 — including the Parker Lake Fire... Read More
GOES-18 Day Land Cloud Fire RGB (top left), Shortwave Infrared (3.9 µm, top right), “Clean” Infrared Window (10.3 µm, bottom left) and “Red” Visible (0.64 µm) + Fire Power derived product (bottom right), from 1500 UTC on 10 May to 0120 UTC on 11 May [click to play animated GIF | MP4]
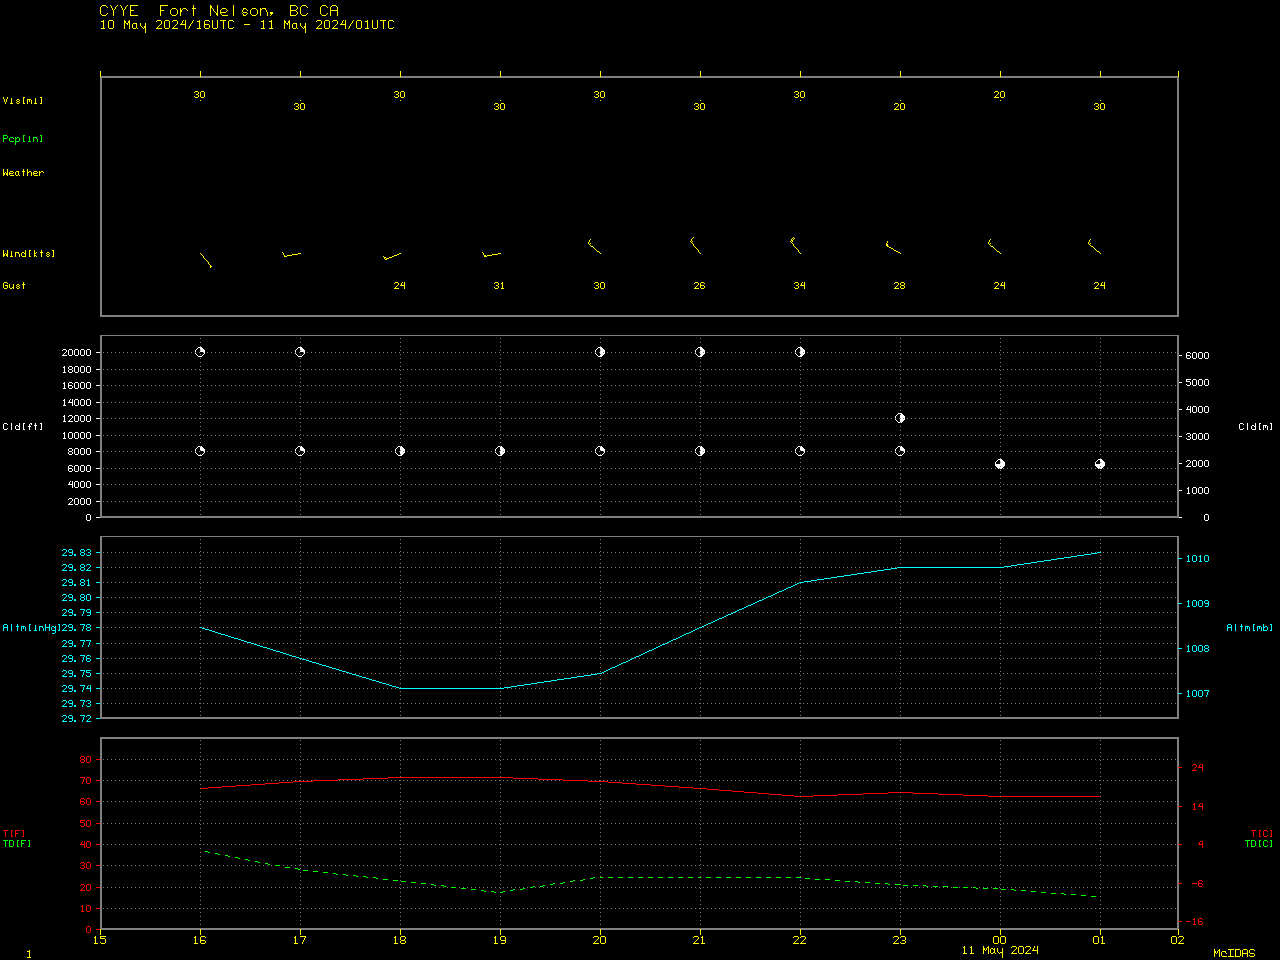
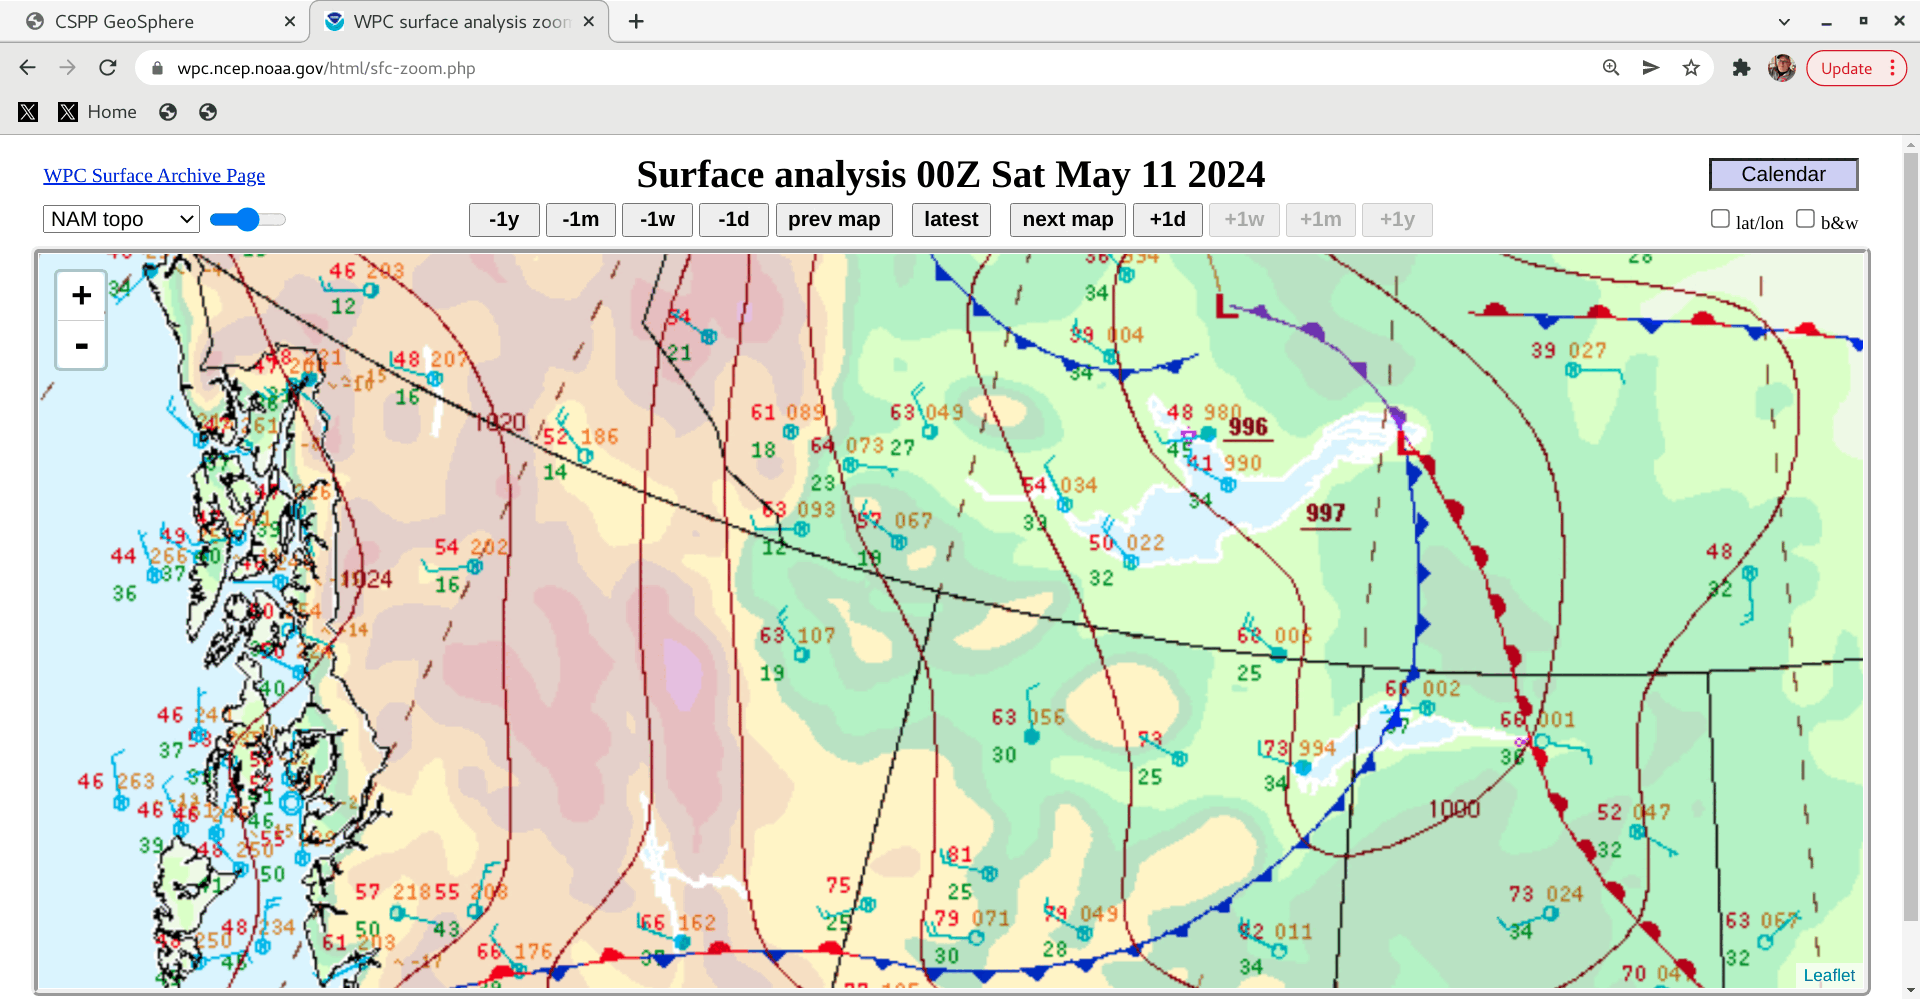
10-minute Full Disk sector GOES-18 (GOES-West) Day Land Cloud Fire RGB, Shortwave Infrared (3.9 µm), “Clean” Infrared Window (10.3 µm) and “Red” Visible (0.64 µm) + Fire Power derived product (a component of the GOES Fire Detection and Characterization Algorithm FDCA) images (above) showed signatures of multiple wildfires across northeastern British Columbia on 10 May 2024 — including the Parker Lake Fire located NW of Fort Nelson (CYYE), which forced the evacuation of 3200 residents as the head of the wind-driven fire approached the city.
A cursor sample of GOES-18 imagery at 2140 UTC on 10 May (below) indicated a Shortwave Infrared (3.9 µm) brightness temperature of 135.81ºC — which is only 2.7ºC less than the saturation temperature of GOES-18 ABI Band 7 detectors — and a rather high Fire Power derived product value of 5478..81 MW associated with the Parker Lake Fire.
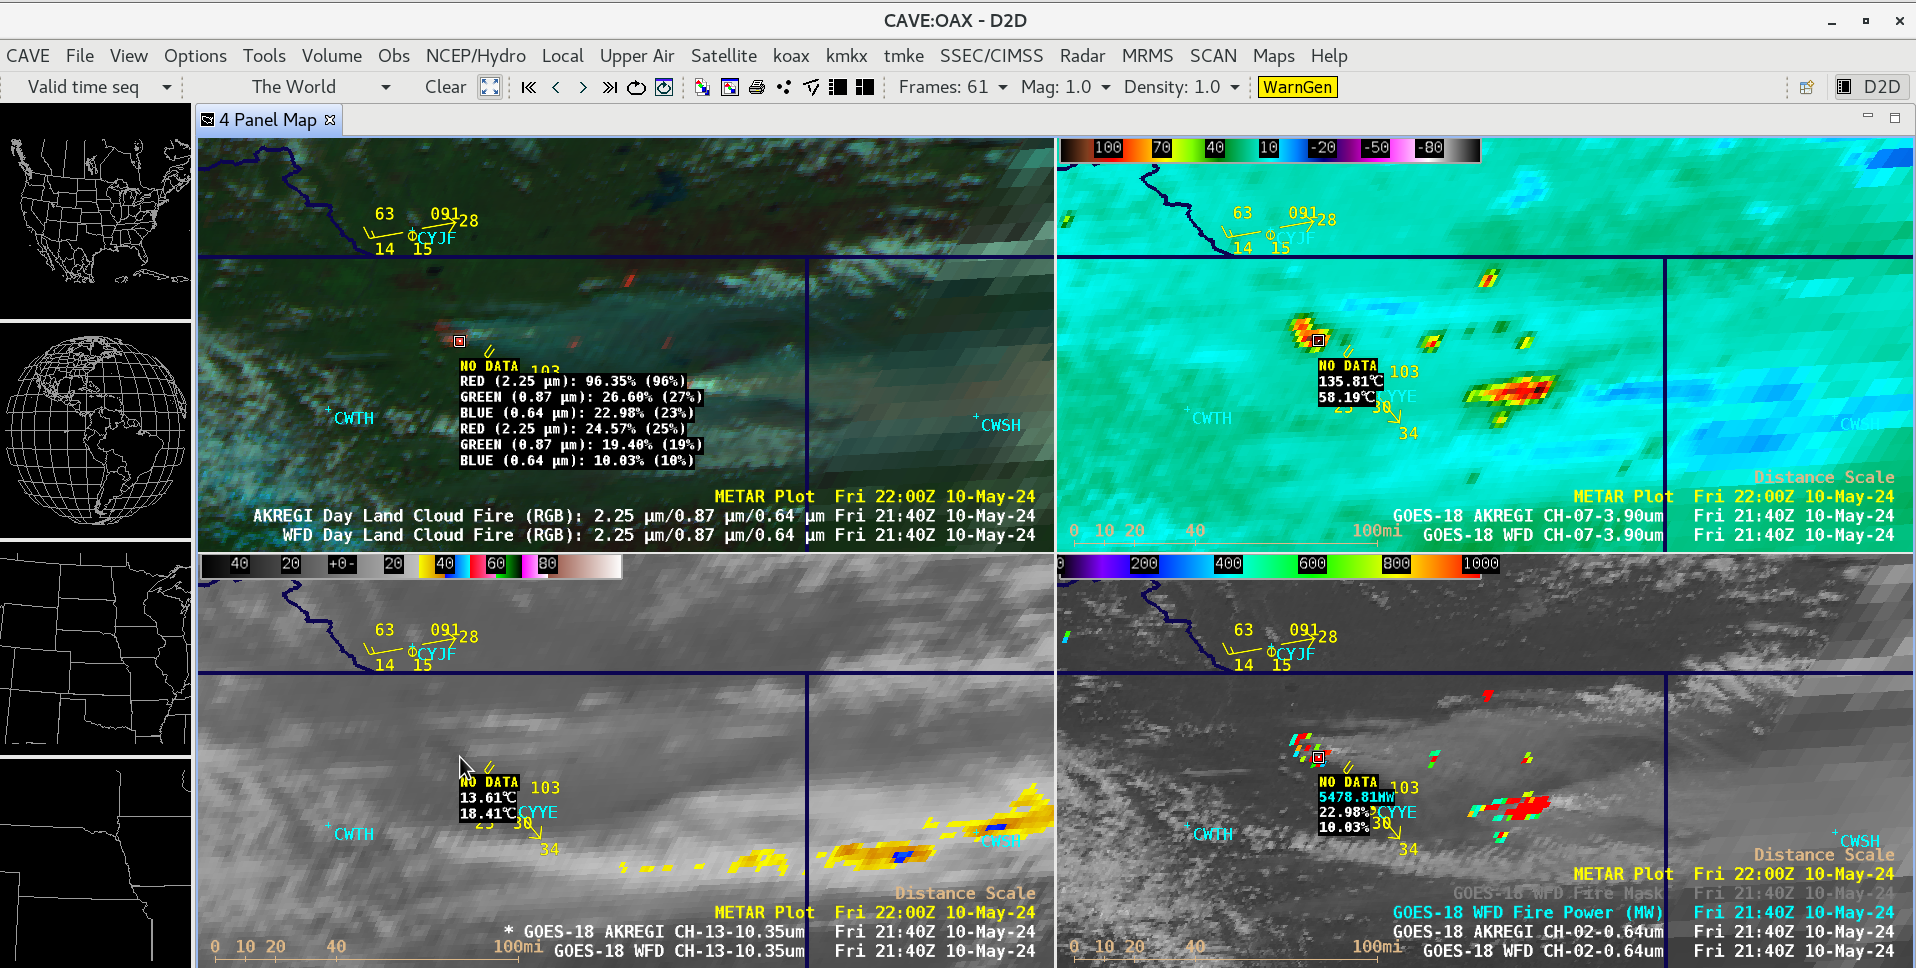
Cursor sample of GOES-18 Day Land Cloud Fire RGB (top left), Shortwave Infrared (3.9 µm, top right), “Clean” Infrared Window (10.3 µm, bottom left) and “Red” Visible (0.64 µm) + Fire Power derived product (bottom right) at 2140 UTC on 10 May [click to enlarge]
GOES-18 daytime True Color + Nighttime Microphysics RGB images from the CSPP GeoSphere site (below) displayed the dense plumes of wildfire smoke (after sunset, the fire thermal anomalies showed up as clusters of darker purple in Nighttime Microphysics RGB imagery). Intermittent pulses of brighter-white pyrocumulus clouds were evident over the larger, more intense wildfires.

GOES-18 daytime True Color + Nighttime Microphysics RGB images, from 1300 UTC on 10 May to 0410 UTC on 11 May [click to play MP4 animation]
A 30-meter resolution Landsat-8 Natural Color RGB image at 1917 UTC on 10 May, viewed using RealEarth (below) provided a detailed look at the Parker Lake Fire burn scar (shades of brown) and an area of active burning (brighter shades of pink to red), along with pyrocumulus clouds produced by the fire. The other large wildfire east of Fort Nelson was apparent.
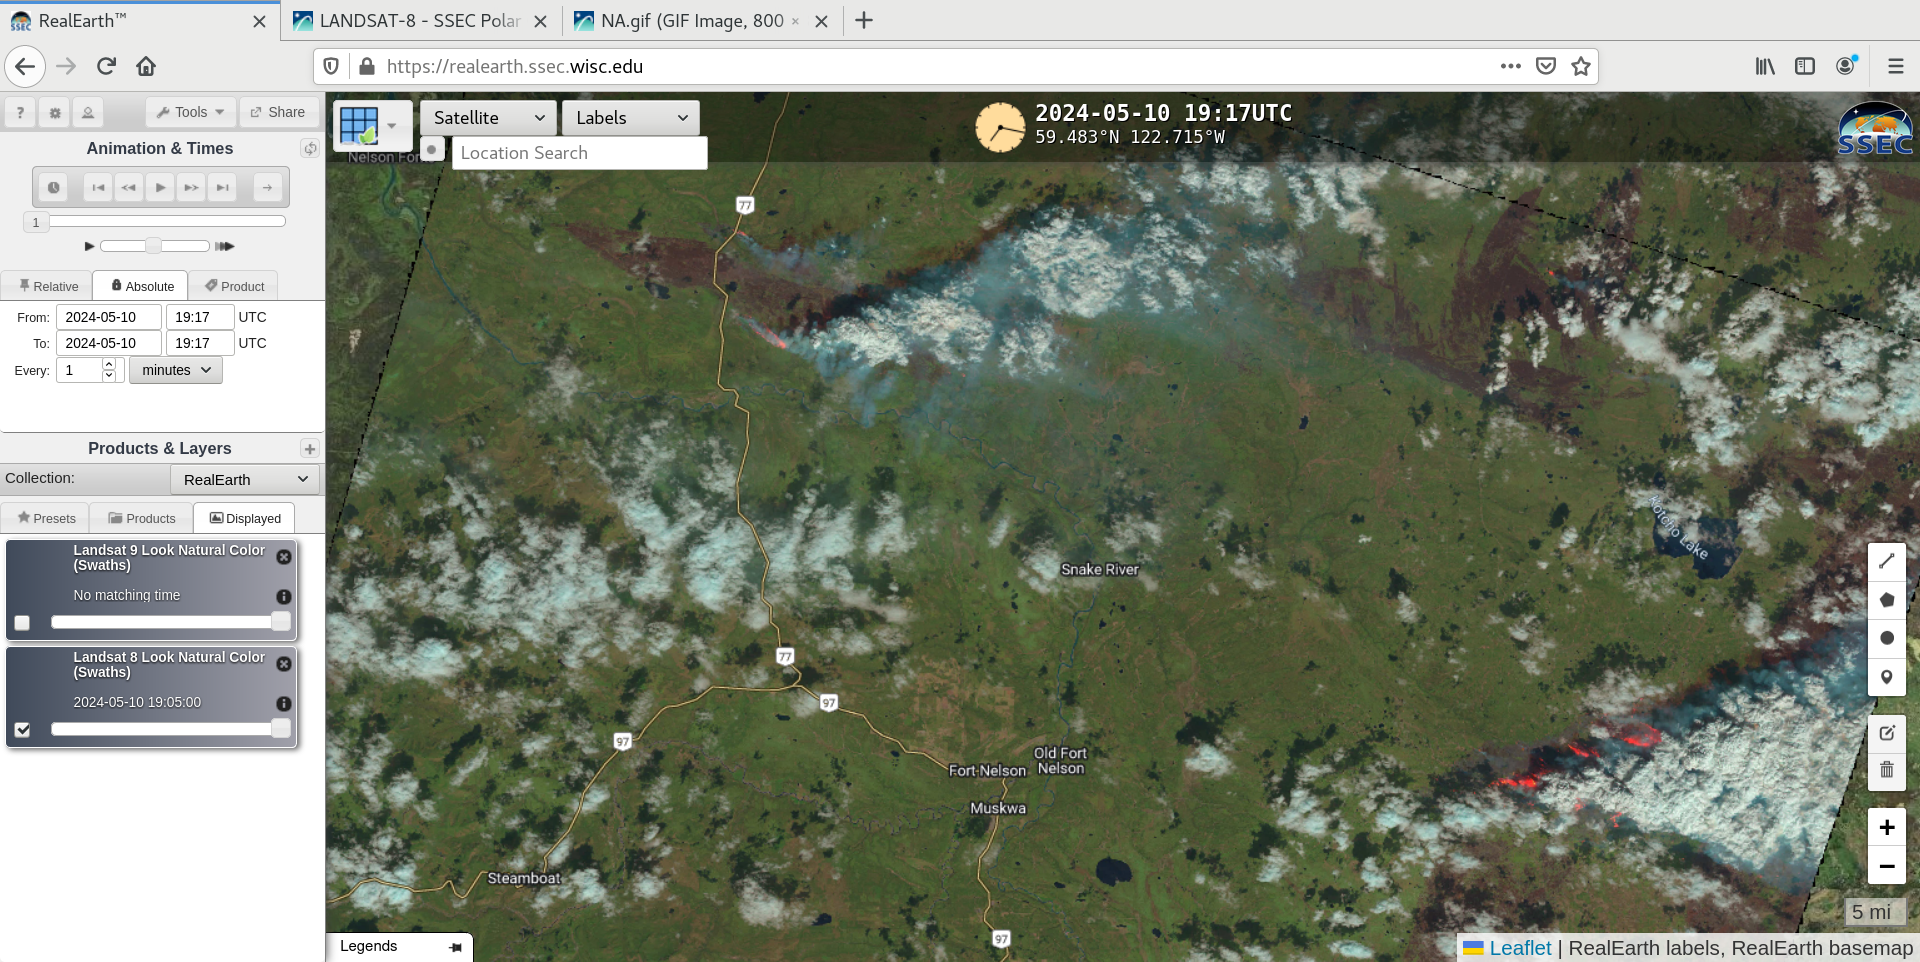
Landsat-8 Natural Color RGB image at 1917 UTC on 10 May [click to enlarge]
A nighttime Suomi-NPP VIIRS Shortwave Infrared (3.74 µm) image valid at 0957 UTC on 11 May (below) revealed the ~40 mile northwest-to-southeast run of the Parker Lake Fire (just to the NW and N of CYYE) — driven by NW winds gusting as high as 34 kt (CYYE surface reports) behind a fast-moving cold front (surface analyses).
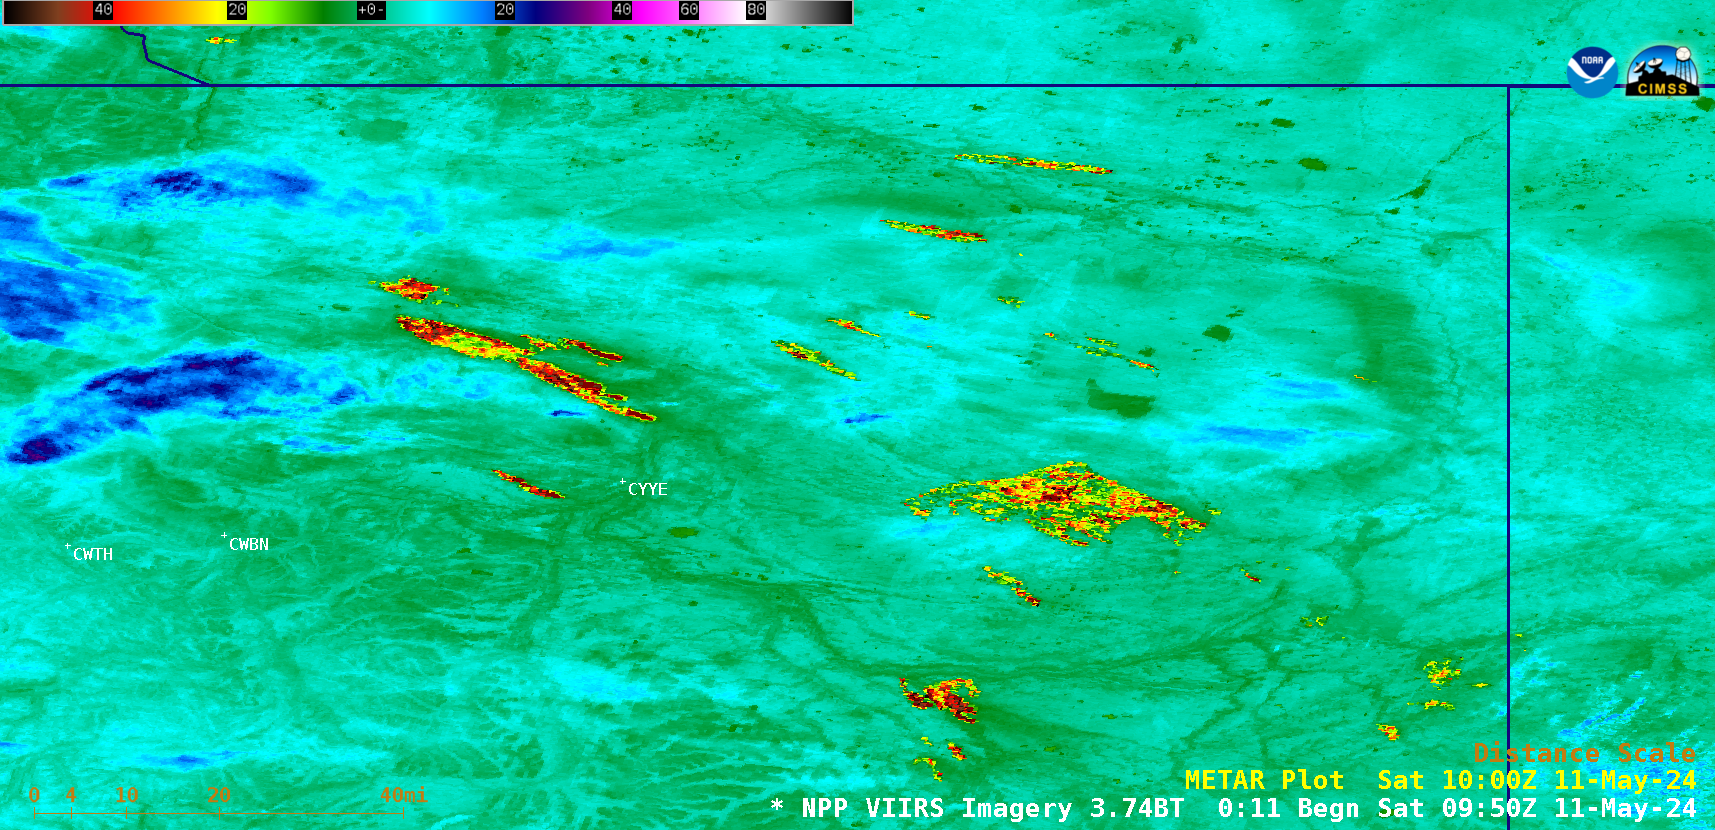
Suomi-NPP VIIRS Shortwave Infrared (3.74 µm) image valid at 0957 UTC on 11 May [click to enlarge]
After sunrise on 11 May, GOES-16 (GOES-East) True Color RGB images (below) showed the hazy gray-to-tan signature of widespread smoke from the British Columbia (and Prairie Province) wildfires — some of which became entrained into the circulation of a low pressure system in the Northwest Territories, with other plumes being transported as far east as Hudson Bay and as far south as North Dakota, South Dakota, Minnesota, Wisconsin, Michigan and Illinois.
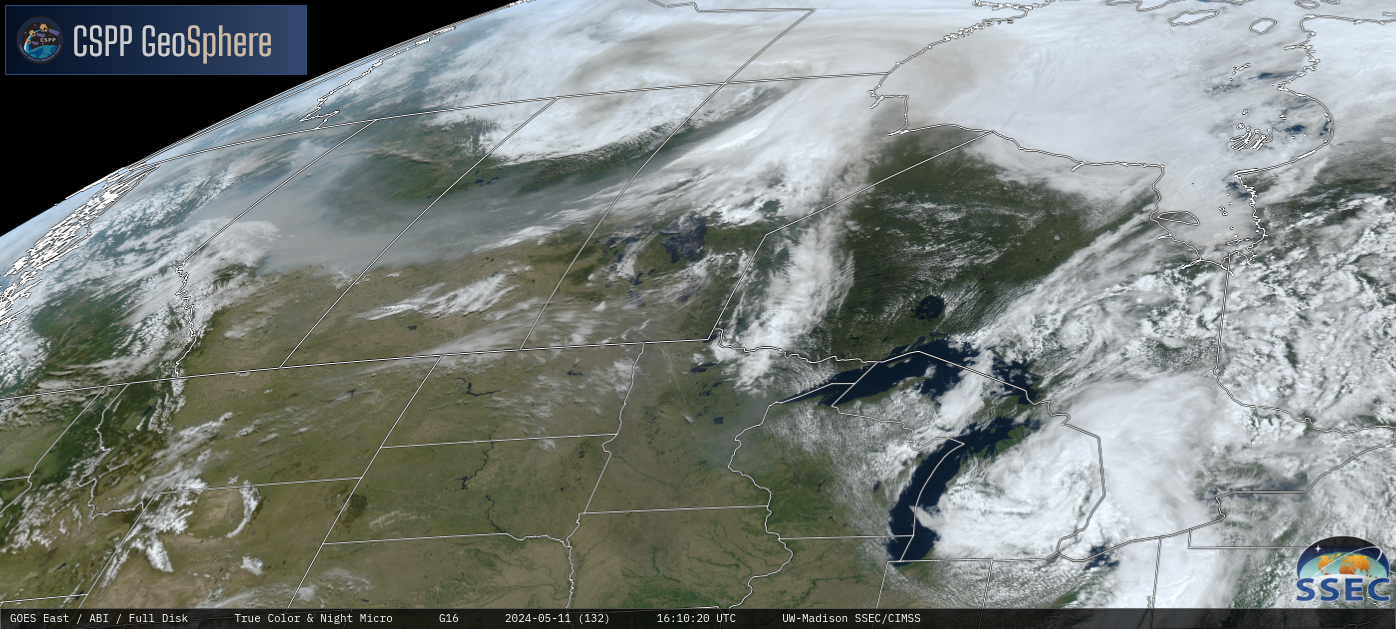
GOES-16 daytime True Color + Nighttime Microphysics RGB images, from 1130 UTC on 11 May to 0000 UTC on 12 May [click to play MP4 animation]
Note that the hazy signature of wildfire smoke was quite pronounced (in GOES-16 True Color RGB imagery) over southern Wisconsin by the end of the day on 11 May — lidar data from the University of Wisconsin – Madison (source) confirmed the presence of smoke aloft within the 4-6 km altitude range, from about 1800 UTC on 11 May to 0000 UTC on 12 May (below).

Lidar 532 nm Backscatter (top) and Linear Depolarization (bottom) at Madison Wisconsin [click to enlarge]
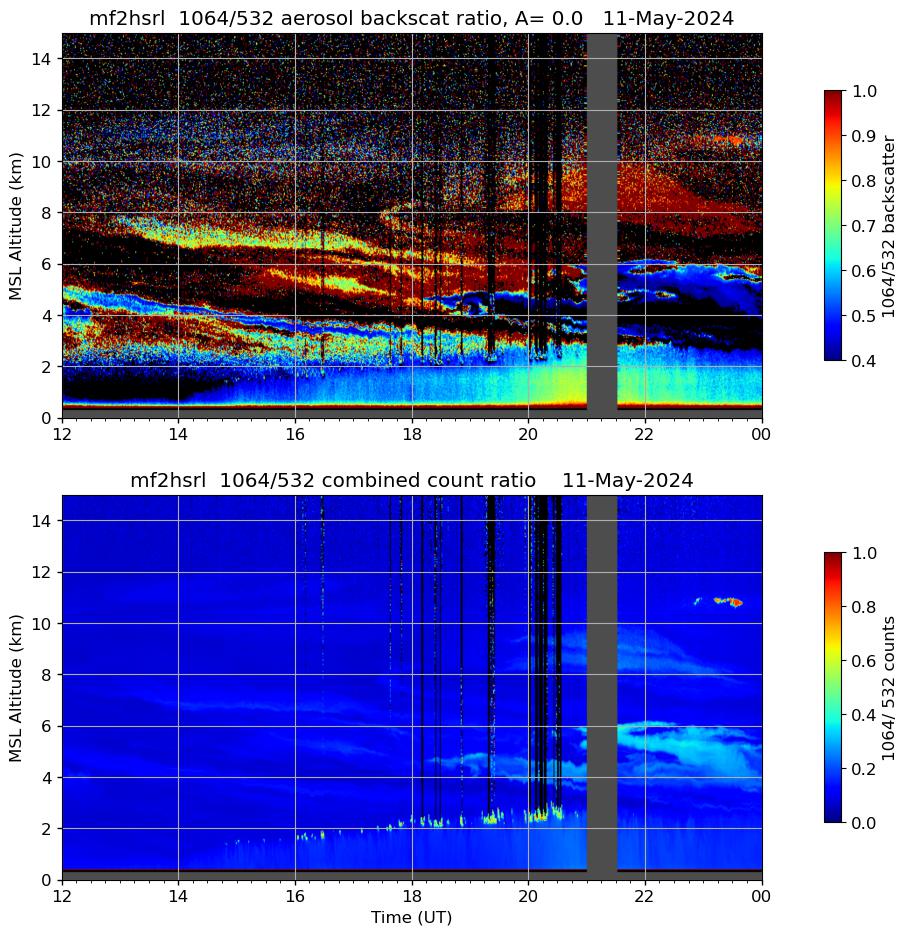
Lidar 1064/532 nm Aerosol Backscatter Ratio (top) and 1064/532 Combined Count Ratio (bottom) at Madison, Wisconsin [click to enlarge]
===== 12 May Update =====
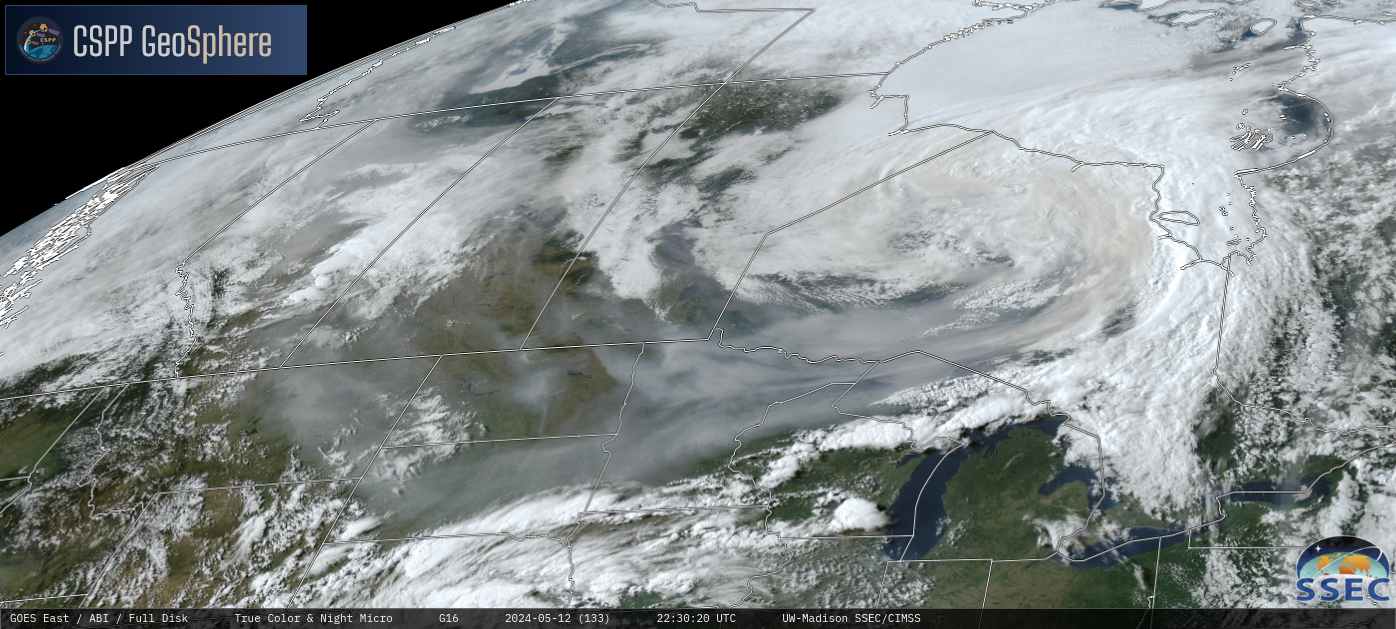
GOES-16 daytime True Color + Nighttime Microphysics RGB images, from 1130 UTC on 12 May to 0010 UTC on 13 May [click to play MP4 animation]
GOES-16 True Color RGB images (above) showed that the areal coverage of dense smoke increased across much of the north-central US on 12 May. Air Quality Advisories were issued for parts of the Upper Midwest.
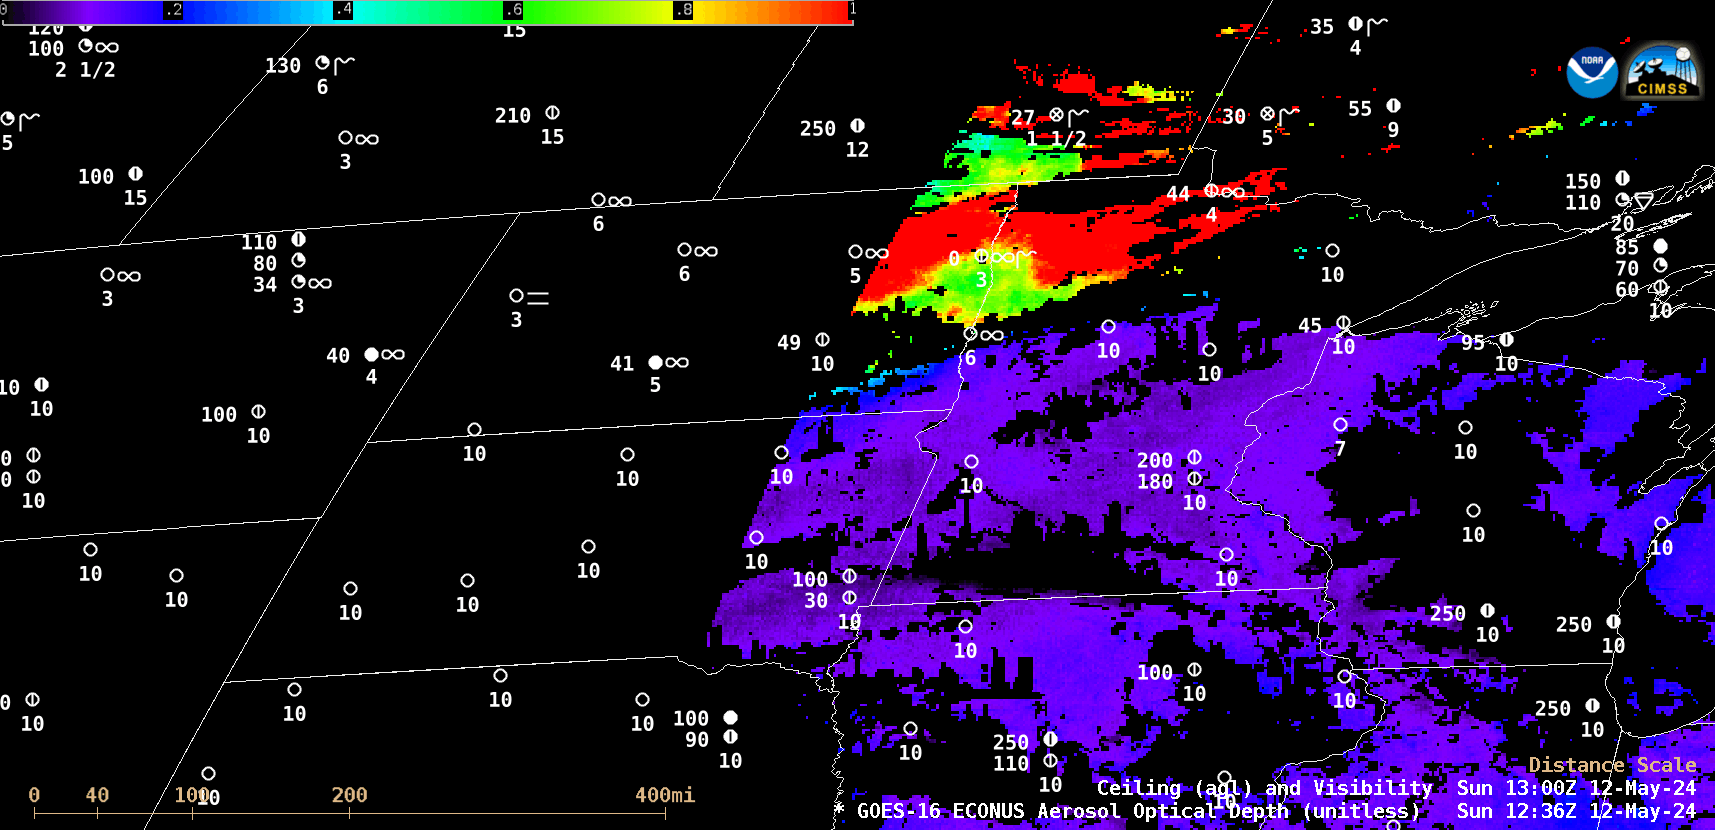
The GOES-16 Aerosol Optical Depth (AOD) derived product with plots of Ceiling and Visibility (below) displayed AOD values as high as 1.0 to 1.6 (darker shades of red) across parts of far southern Canada and the north-central US — and the surface visibility dropped to 3 miles or less due to smoke at some sites from Montana to Minnesota.
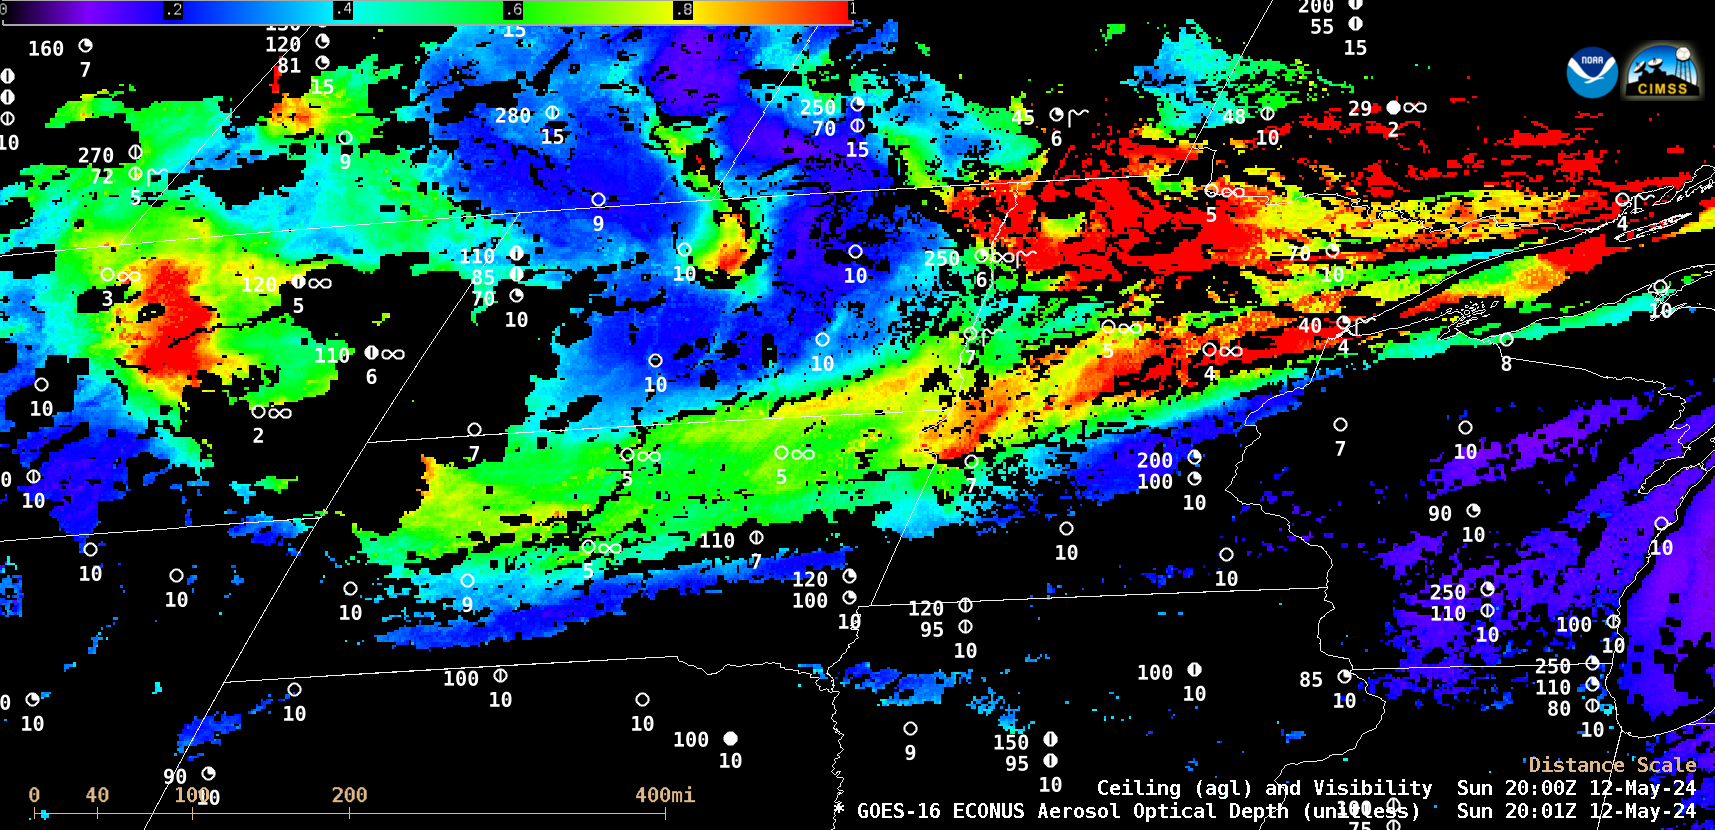
GOES-16 Aerosol Optical Depth derived product with plots of Ceiling and Visibility, from 1236-2356 UTC on 12 May [click to play animated GIF | MP4]
Aerosol Optical Depth derived from an overpass of NOAA-20 VIIRS data can be viewed in this blog post.
View only this post
Read Less


