GOES-16 (GOES-East) True Color Red-Green-Blue (RGB) images created using Geo2Grid (above) displayed widespread plumes of blowing dust and salt originating from Salar de Uyuni in southwestern Bolivia on 07 July 2020. These aerosol sources are located within an elevated plateau with altitudes of 11-12,000 feet (3.3-3.6 km) — and similar episodes of blowing... Read More
![GOES-16 True Color RGB images (credit: Tim Schmit, ASPB/CIMSS) [click to play animation | MP4]](https://cimss.ssec.wisc.edu/satellite-blog/images/2020/07/GOES-16_ABI_RadF_true_color_2020189_200023Z.png)
GOES-16 True Color RGB images (credit: Tim Schmit, ASPB/CIMSS) [click to play animation | MP4]
GOES-16
(GOES-East) True Color Red-Green-Blue (RGB) images created using
Geo2Grid (above) displayed widespread plumes of blowing dust and salt originating from
Salar de Uyuni in southwestern Bolivia on 07 July 2020. These aerosol sources are located within an
elevated plateau with altitudes of 11-12,000 feet (3.3-3.6 km) — and similar episodes of blowing dust/salt are not uncommon during the austral winter (
reference).
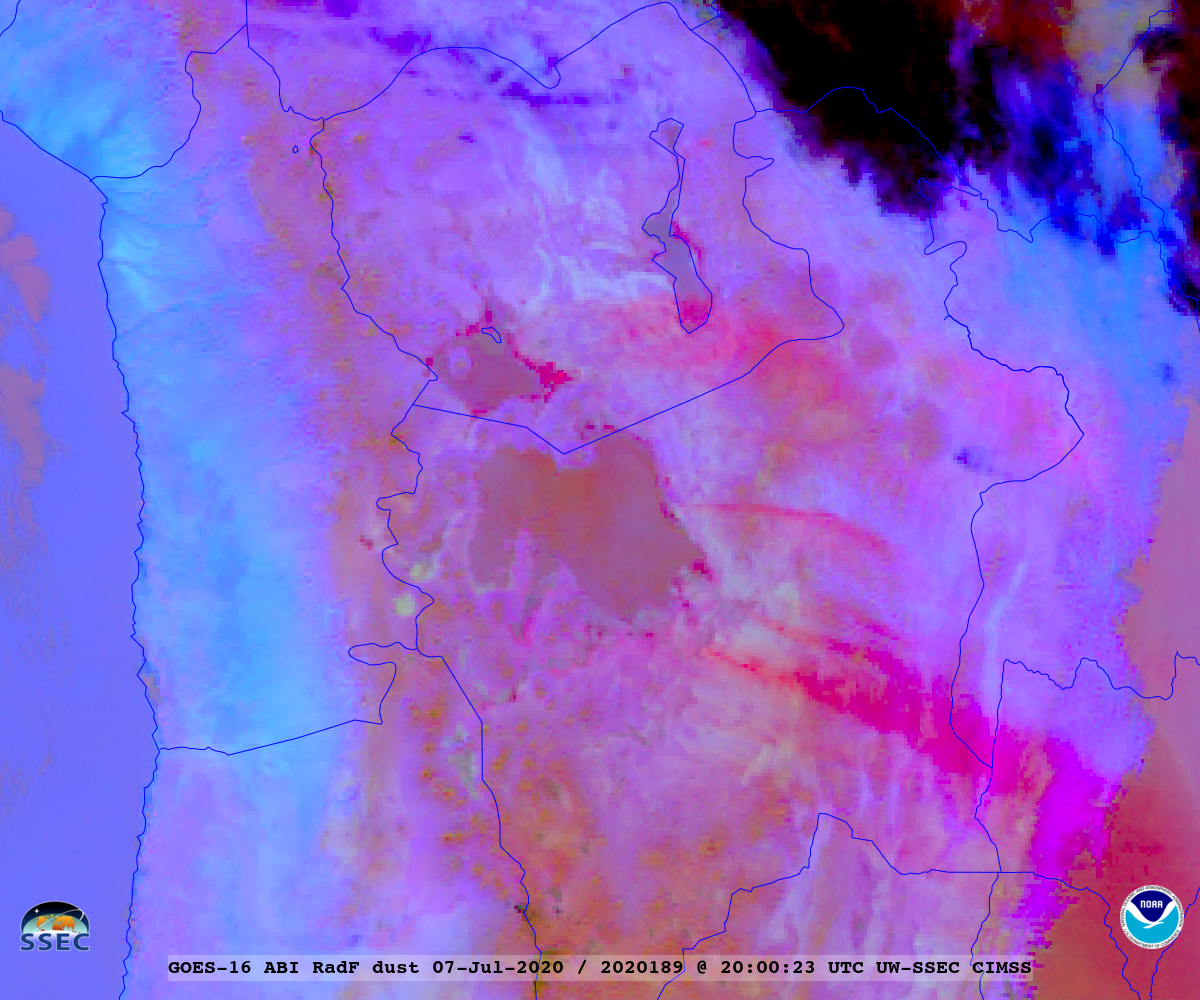
A longer animation of GOES-16 Dust RGB images (below) showed the continued eastward transport of dust/salt plumes for a few hours after sunset.
![GOES-16 Dust RGB images (credit: Tim Schmit, ASPB/CIMSS) [click to play animation | MP4]](https://cimss.ssec.wisc.edu/satellite-blog/images/2020/07/GOES-16_ABI_RadF_dust_2020189_200023Z.png)
GOES-16 Dust RGB images (credit: Tim Schmit, ASPB/CIMSS) [click to play animation | MP4]
A sequence of GOES-16 Natural Color RGB, Dust RGB and
Split Window Difference (10.3 µm – 12.3 µm) images from AWIPS
(below) provided a less detailed view of the plumes — the spatial resolution of Full Disk GOES imagery in AWIPS is reduced to 6 km.
![GOES-16 Natural Color RGB, Dust RGB and Split Window Difference (10.3 µm – 12.3 µm) images [click to play animation | MP4]](https://cimss.ssec.wisc.edu/satellite-blog/images/2020/07/bol_swd-20200707_191023.png)
GOES-16 Natural Color RGB, Dust RGB and Split Window Difference (10.3 µm – 12.3 µm) images [click to play animation | MP4]
Winds across that region increased on 07 July as an intensifying subtropical jet streak was passing just to the north/northeast, as shown in plots of 700 hPa geopotential height and integrated water vapor transport from
this site (below). Clouds associated with this jet streak could be seen in the northern portion of the GOES-16 images above.
![Plots of 700 hPa geopotential height and integrated water vapor transport [click to enlarge]](https://cimss.ssec.wisc.edu/satellite-blog/images/2020/07/200707_700hPa_height_ivt_South_America_anim.gif)
Plots of 700 hPa geopotential height and integrated water vapor transport [click to enlarge]
Plots of rawinsonde data from Antofagasta, Chile at 12 UTC on 06, 07 and 08 July
(below) showed the increase in northwesterly 700 hPa winds to 40 knots on
07 July. Antofagasta is located about 300 miles southwest of the Salar de Uyuni region.
![Plots of rawinsonde data from Antofagasta, Chile at 12 UTC on 06, 07 and 08 July [click to enlarge]](https://cimss.ssec.wisc.edu/satellite-blog/images/2020/07/200706_200708_SCFA_rawinsondes_anim.gif)
Plots of rawinsonde data from Antofagasta, Chile at 12 UTC on 06, 07 and 08 July [click to enlarge]
View only this post
Read Less

![GOES-16 “Red” Visible (0.64 µm) images [click to play animation | MP4]](https://cimss.ssec.wisc.edu/satellite-blog/images/2020/07/200711_goes16_visible_IA_anim.gif)
![GOES-16 “Clean” Infrared Window (10.35 µm) images [click to play animation | MP4]](https://cimss.ssec.wisc.edu/satellite-blog/images/2020/07/200711_goes16_infrared_IA_anim.gif)
![GOES-16 “Red” Visible (0.64 µm) images, with SPC Storm Reports plotted in red [click to play animation | MP4]](https://cimss.ssec.wisc.edu/satellite-blog/images/2020/07/200711_goes16_visible_spcStormReports_IA_v2_anim.gif)
![GOES-16 “Clean” Infrared Window (10.35 µm) images, with time-matched SPC Storm Reports plotted in cyan [click to play animation | MP4]](https://cimss.ssec.wisc.edu/satellite-blog/images/2020/07/200711_goes16_infrared_spcStormReports_IA_anim.gif)
![GOES-16 “Red” Visible (0.64 µm) images, with SPC Storm Reports plotted in red [click to play animation | MP4]](https://cimss.ssec.wisc.edu/satellite-blog/images/2020/07/200711_goes16_visible_spcStormReports_KS_anim.gif)
![GOES-16 “Clean” Infrared Window (10.35 µm) images, with time-matched SPC Storm Reports plotted in violet [click to play animation | MP4]](https://cimss.ssec.wisc.edu/satellite-blog/images/2020/07/200711_goes16_infrared_spcStormReports_KS_anim.gif)
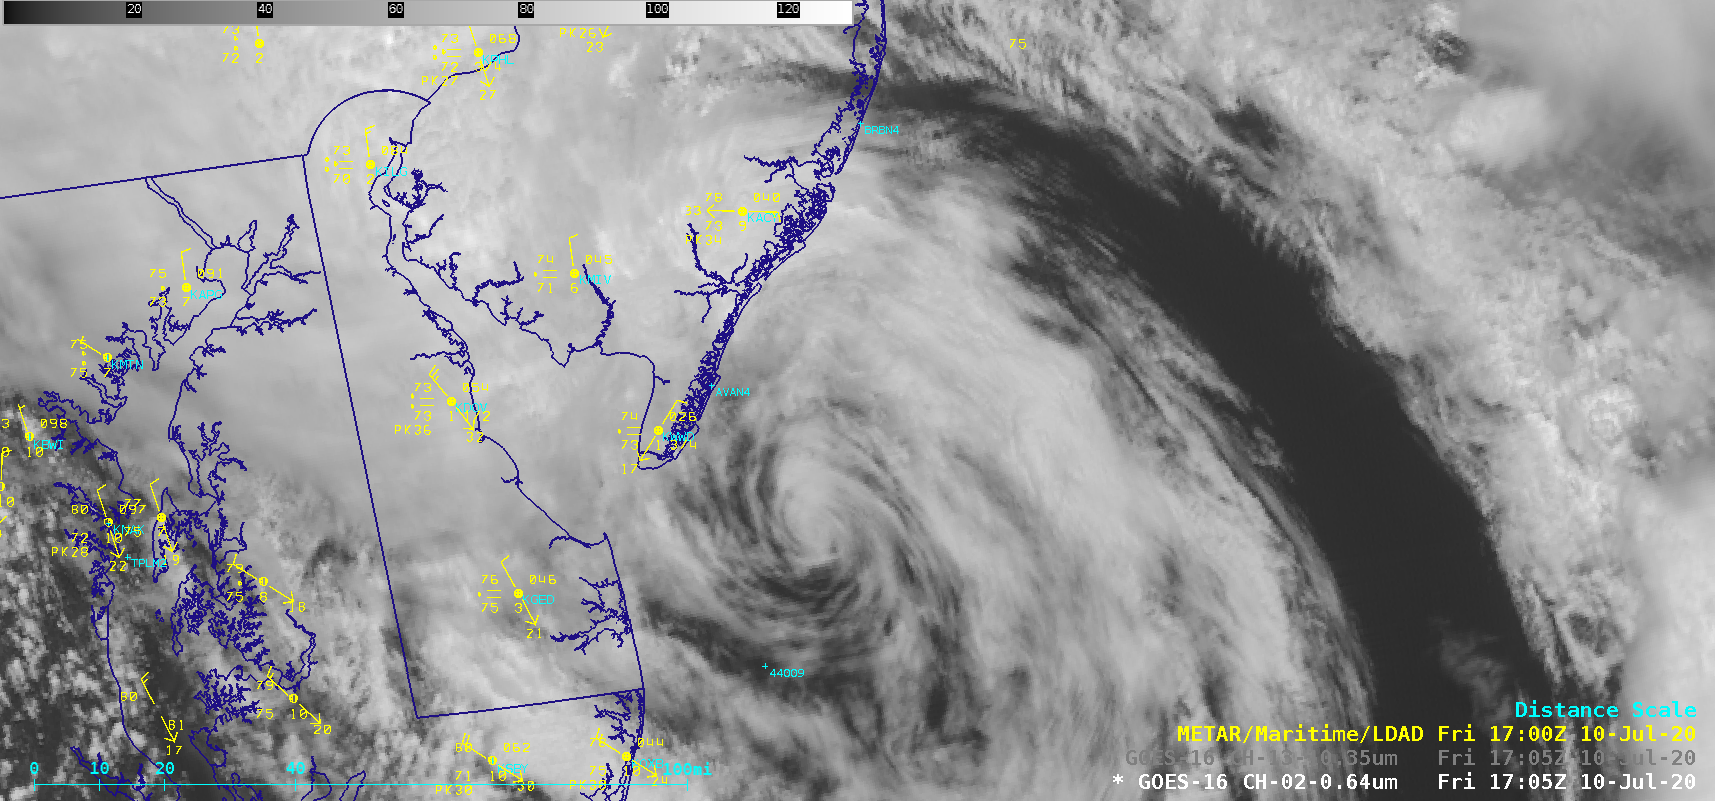
![GOES-16 “Red” Visible (0.64 µm) and “Clean” Infrared Window (10.35 µm) images [click to play animation | MP4]](https://cimss.ssec.wisc.edu/satellite-blog/images/2020/07/200710_goes16_visible_infrared_TS_Fay_anim.gif)
![GOES-16 “Red” Visible (0.64 µm) images, with plots of Derived Motion Winds [click to play animation | MP4]](https://cimss.ssec.wisc.edu/satellite-blog/images/2020/07/200710_goes16_visible_derivedMotionWinds_TS_Fay_anim.gif)
![GOES-16 Mid-level Water Vapor (6.9 µm) and “Red” Visible (0.64 µm) images [click to play animation | MP4]](https://cimss.ssec.wisc.edu/satellite-blog/images/2020/07/200710_goes16_waterVapor_visible_TS_Fay_anim.gif)
![Sea Surface Temperature analysis [click to enlarge]](https://cimss.ssec.wisc.edu/satellite-blog/images/2020/07/200710_sst_Fay.png)
![GOES-16 True Color RGB images (credit: Tim Schmit, ASPB/CIMSS) [click to play animation | MP4]](https://cimss.ssec.wisc.edu/satellite-blog/images/2020/07/GOES-16_RadF_true_color_2020189_1900_2020189_2130_zoom_salar.gif)
![GOES-16 Dust RGB images (credit: Tim Schmit, ASPB/CIMSS) [click to play animation | MP4]](https://cimss.ssec.wisc.edu/satellite-blog/images/2020/07/GOES-16_RadF_dust_2020189_154000_2020189_230000.gif)
![GOES-16 Natural Color RGB, Dust RGB and Split Window Difference (10.3 µm – 12.3 µm) images [click to play animation | MP4]](https://cimss.ssec.wisc.edu/satellite-blog/images/2020/07/200707_goes16_naturalColorRGB_dustRGB_splitWindowDifference_Bolivia_blowing_salt_plumes_anim.gif)
![GOES-16 “Red” Visible (0.64 µm) and “Clean” Infrared Window (10.35 µm) images [click to play animation | MP4]](https://cimss.ssec.wisc.edu/satellite-blog/images/2020/07/200704_goes16_visible_infrared_ND_SD_AACP_anim.gif)
![GOES-16 “Red” Visible (0.64 µm) images, with time-matched SPC Storm Reports plotted in red [click to play animation | MP4]](https://cimss.ssec.wisc.edu/satellite-blog/images/2020/07/200704_goes16_visible_spcStormReports_ND_SD_anim.gif)
![GOES-16 “Clean” Infrared Window (10.35 µm) images, with time-matched SPC Storm Reports plotted in cyan [click to play animation | MP4]](https://cimss.ssec.wisc.edu/satellite-blog/images/2020/07/200704_goes16_infrared_spcStormReports_ND_SD_anim.gif)
![Plot of 00 UTC rawinsonde data from Aberdeen, South Dakota [click to enlarge]](https://cimss.ssec.wisc.edu/satellite-blog/images/2020/07/200705_00utc_kabr_raob.png)
![Suomi NPP VIIRS Infrared Window (11.45 µm) and Day/Night Band (0.7 µm) images [click to enlarge]](https://cimss.ssec.wisc.edu/satellite-blog/images/2020/07/200705_0915utc_suomiNPP_viirs_infraredWindow_dayNightBand_ND_AACP_anim.gif)
