
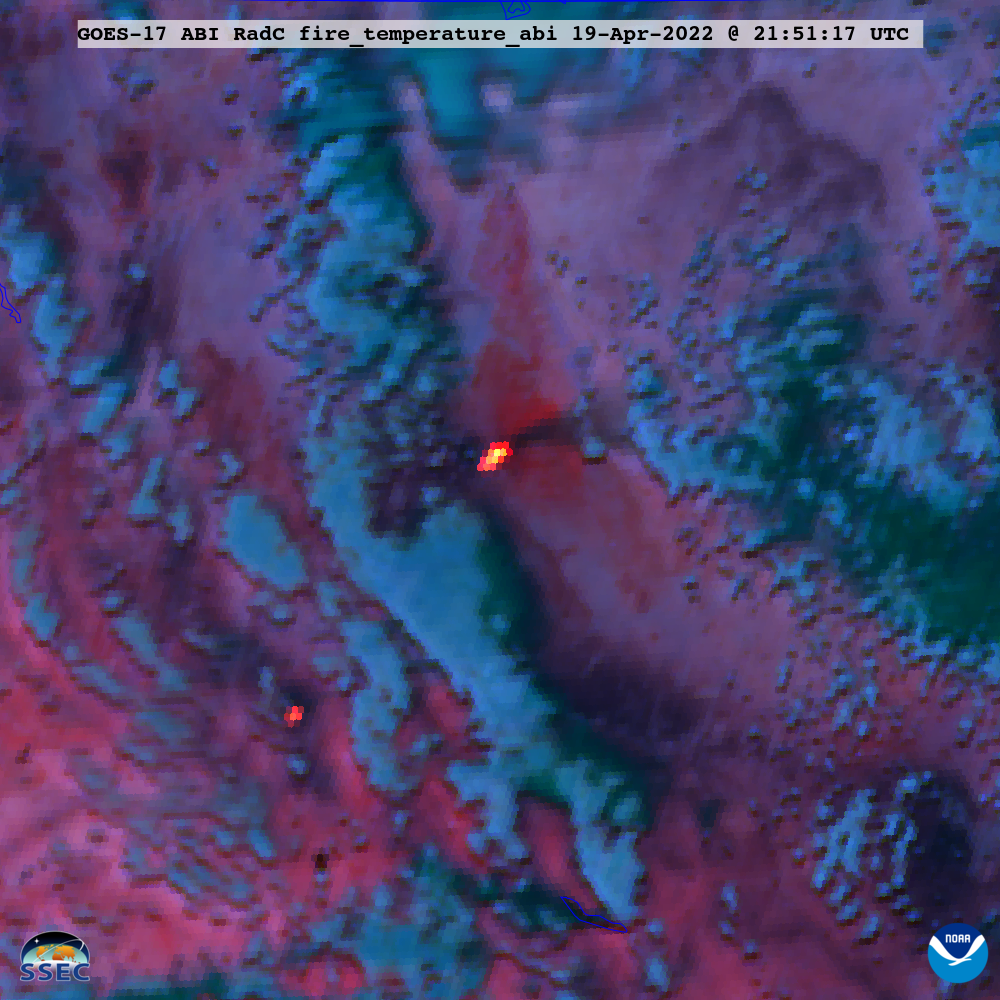
JMA Himawari-8 “Red” Visible (0.64 µm), Shortwave Infrared (3.9 µm) and “Clean” Infrared Window (10.4 µm) images (above) showed signatures of a rapidly-spreading grassland fire in eastern Mongolia’s Numrug National Park (near the border with China) on 19 April 2022. The fast rate of northeastward growth of the dark burn scar in... Read More
JMA Himawari-8 “Red” Visible (0.64 µm, top), Shortwave Infrared (3.9 µm, center) and “Clean” Infrared Window (10.4 µm, bottom) images [click to play animated GIF | MP4]
Himawari-8 “Red” Visible (0.64 µm), Shortwave Infrared (3.9 µm) and “Clean” Infrared Window (10.4 µm) images
(above) showed signatures of a rapidly-spreading grassland fire in eastern Mongolia’s
Numrug National Park (near the border with China) on 19 April 2022. The fast rate of northeastward growth of the dark burn scar in Visible imagery was particularly striking. Strong winds aided the rapid expansion of this fire, due to the tight pressure gradient between a high over central China and a deepening low that was moving from Siberia to northeastern China (
surface analyses).
Consecutive NOAA-20 VIIRS Infrared image valid at 0401 UTC and 0541 UTC — viewed using RealEarth (below) — showed the eastward drift of individual small pyrocumulonimbus (pyroCb) clouds, which exhibited cloud-top infrared brightness temperatures of -40ºC and colder (brighter green color enhancement).
NOAA-20 VIIRS Infrared Window (11.45 µm) images at 0401 UTC and 0541 UTC [click to enlarge]
A toggle between NOAA-20 VIIRS True Color RGB and Infrared images at 0541 UTC
(below) depicted the dark burn scar as well as the smoke plume with embedded pyroCb clouds.

NOAA-20 VIIRS True Color RGB and Infrared Window (11.45 µm) images at 0541 UTC [click to enlarge]
30-meter resolution Landsat-8 False Color RGB imagery
valid at 0252 UTC (below) provided an even more detailed view of the dark burn scar — in addition, the active fire front appeared as brighter shades of pink to red along the eastern and southeastern flanks.
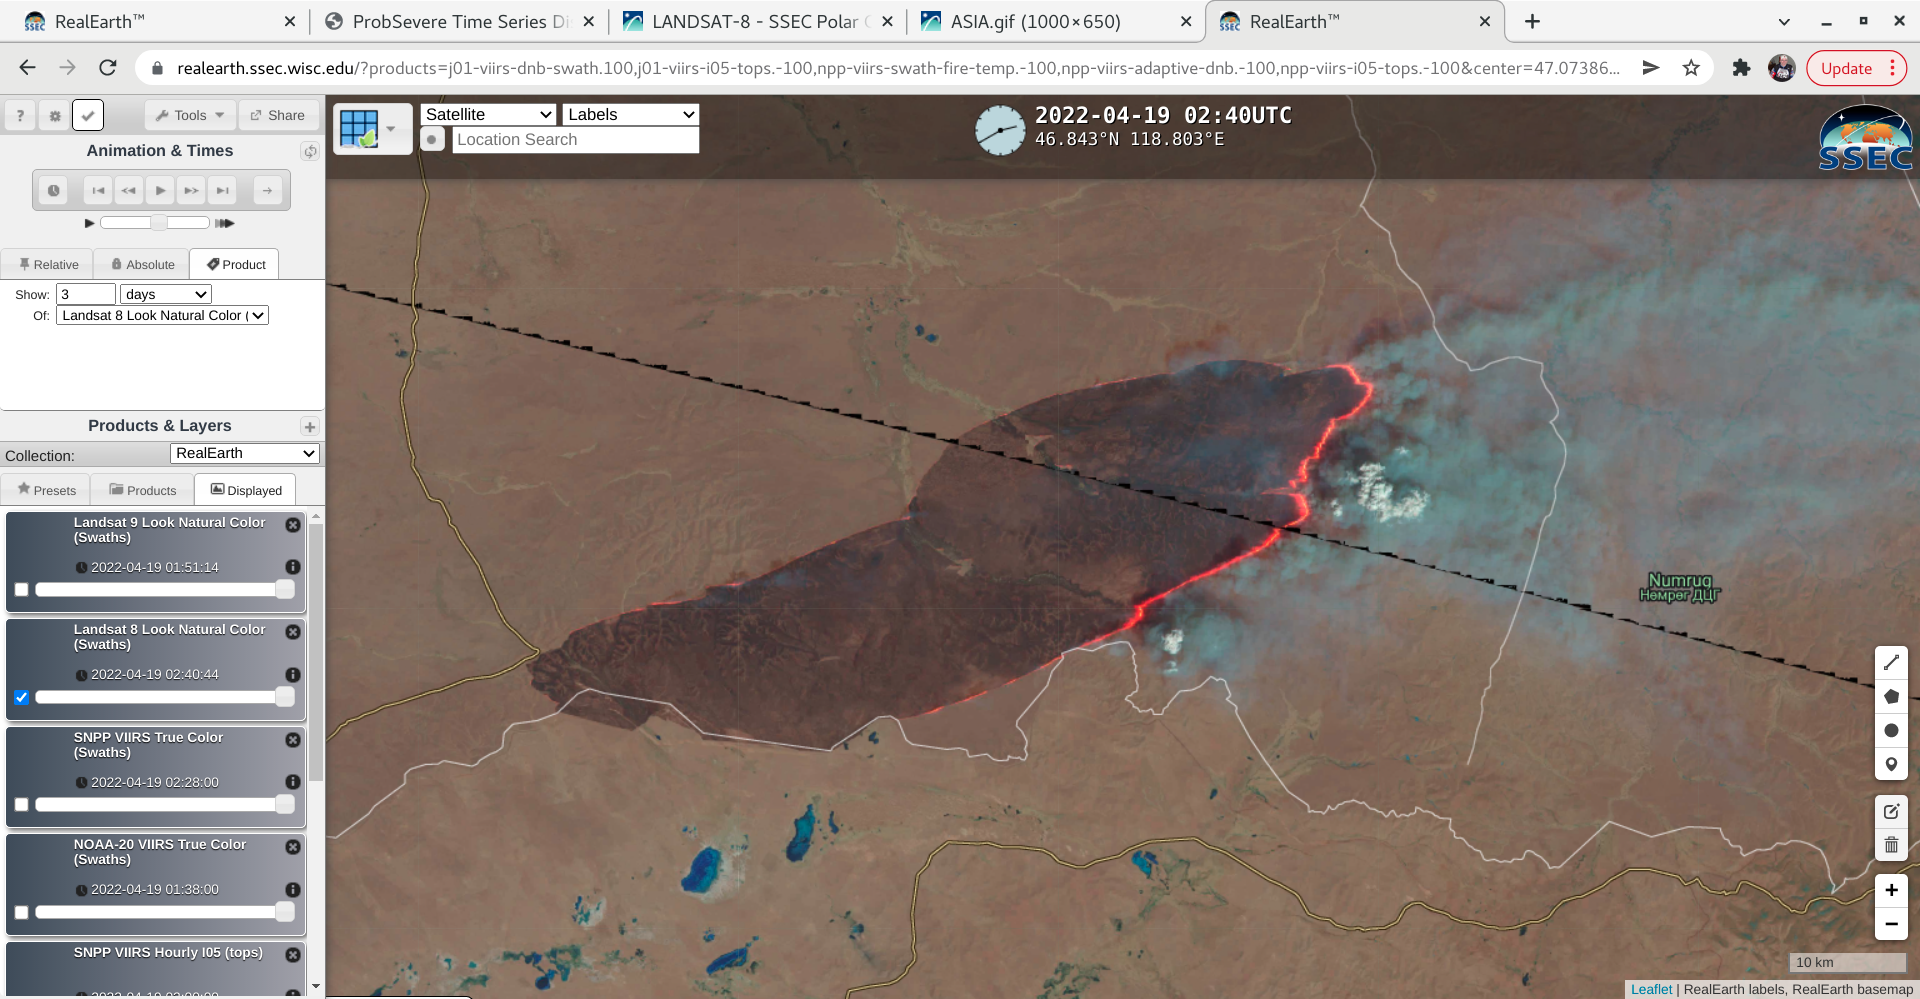
Landsat-8 False Color image at 0252 UTC [click to enlarge]
After sunset, the northern flank of the fire continued to burn at an intense rate, judging from the thermal signature seen in Himawari-8 Shortwave Infrared images
(below). Dense layered clouds began to move over the region before sunrise the next day, which then acted to mask the fire’s thermal signature.
JMA Himawari-8 “Red” Visible (0.64 µm, top), Shortwave Infrared (3.9 µm, center) and “Clean” Infrared Window (10.4 µm, bottom) images [click to play animated GIF | MP4]
A toggle between NOAA-20 VIIRS Day/Night Band (0.7 µm) and Infrared Window (11.45 µm) images
valid at 1757 UTC (below) showed the bright nighttime glow of active fires — especially along the aforementioned northern flank — in addition to the associated smoke plume that was moving eastward, as illuminated by the Moon (which was in the Waning Gibbous phase, at 90% of Full). This smoke did not exhibit a signature in the corresponding 11.45 µm Infrared image, since relatively thin smoke layers are generally transparent to upwelling surface radiation at longer wavelengths.
NOAA-20 VIIRS Day/Night Band (0.7 µm) and Infrared Window (11.45 µm) images at 1742 UTC [click to enlarge]
View only this post
Read Less


