
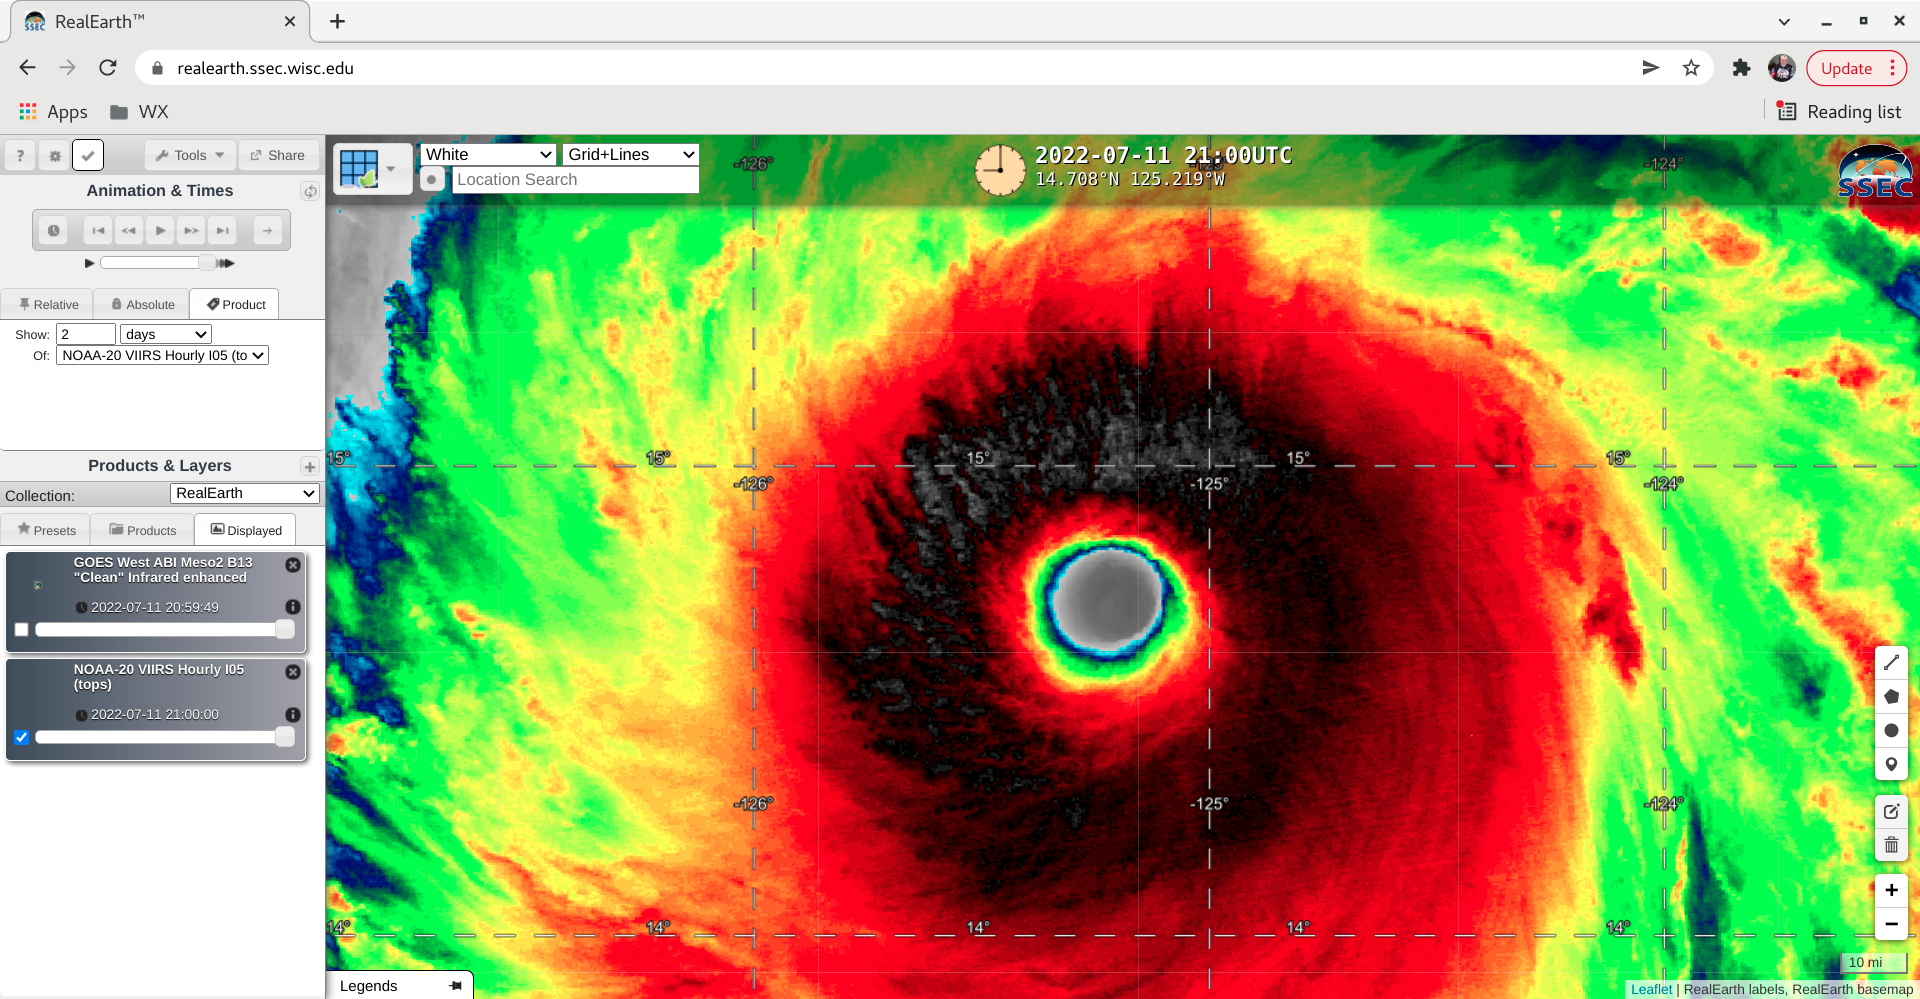
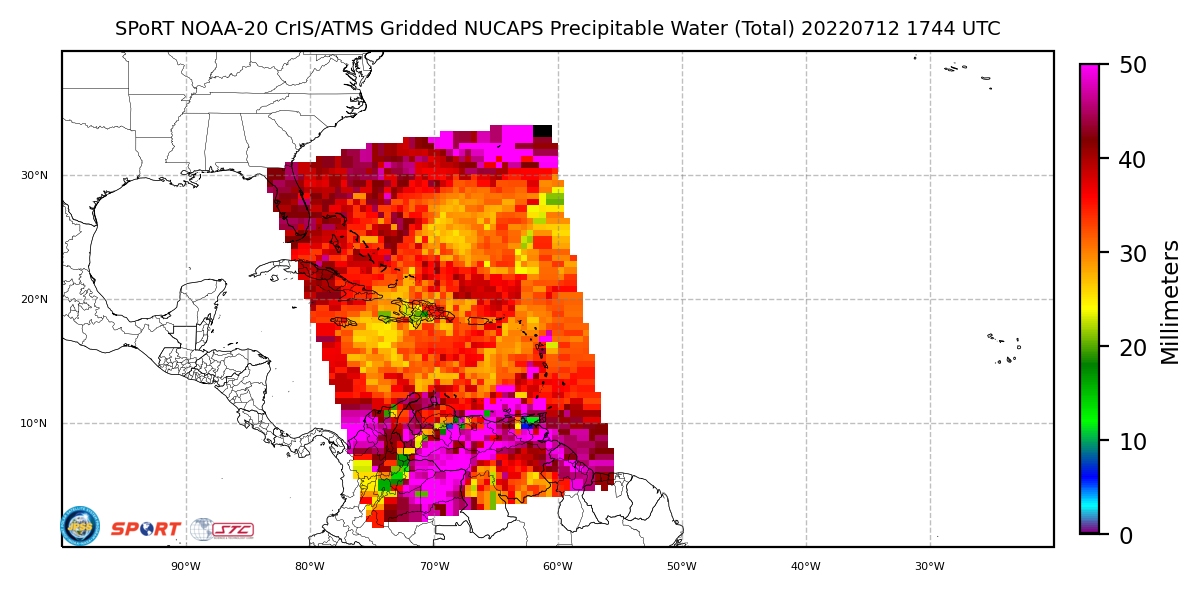
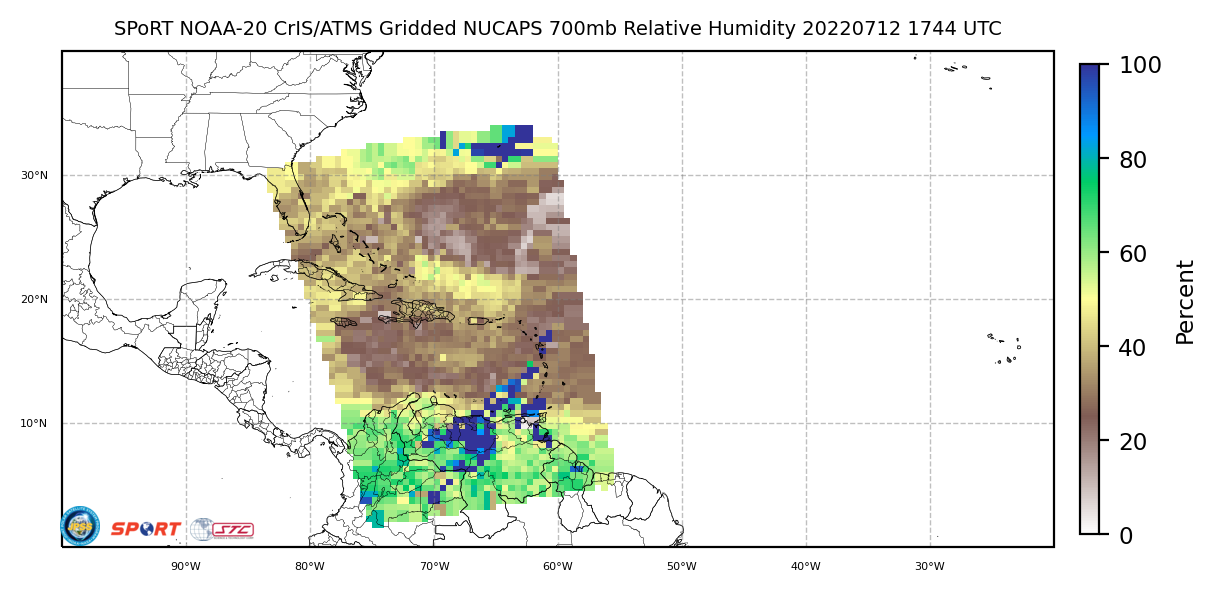
Himawari-8 Imagery, above (courtesy JMA, the Japan Meteorological Agency, from this site), shows a cyclonically rotating feature over the western Pacific, approaching the northern Marianas Islands by the end of the animation. Periodic weak convection is forming within the center of the circulation, with more widespread convection developing to its east. Gridded NUCAPS fields, below, from this site, show that the cyclonic feature is associated with relatively cool temperatures at 500 mb. At the beginning of the animation, the cool temperatures are near Wake Island; the cool temperatures progress steadily westward just south of 20o N latitude over the following days and are over the Marianas at the end of the animation.
Examination of surface-based winds (from scatterometers, at this site) suggests that the mid-level circulation does not extend all the way to the surface.
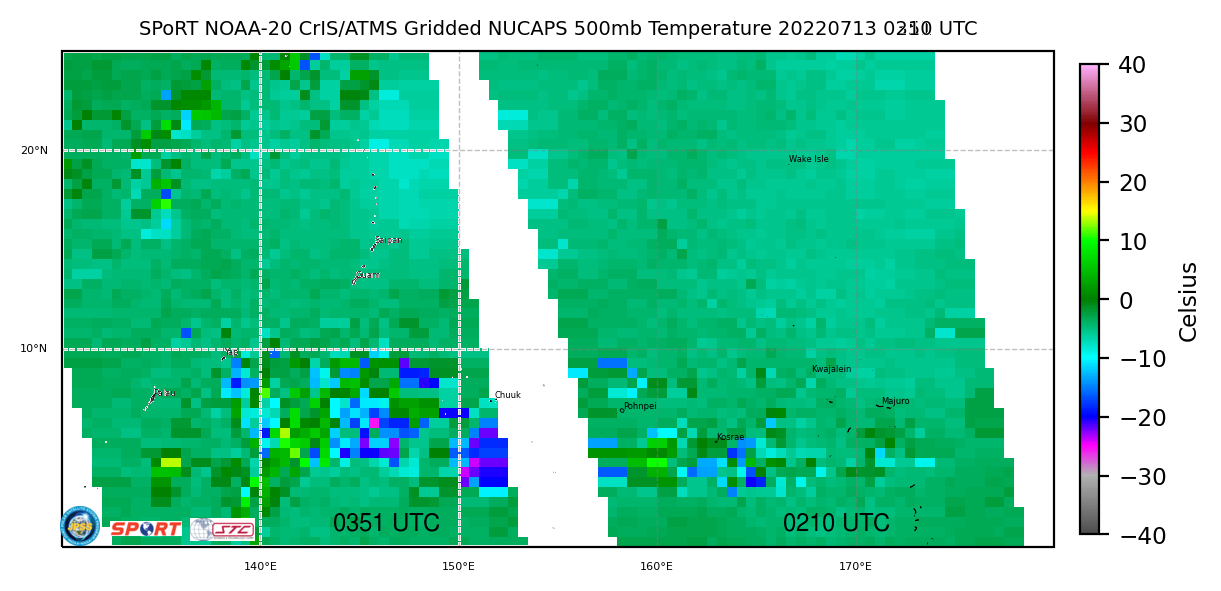
Update, 14 July 2022
By 0333 UTC on 14 July 2022, the cool region at 500 mb was centered just west of 20oN, 150oE. (Its westward progress has slowed significantly) The cool region overlaps a ‘green’ Quality Control Region, meaning the retrieval there converged to a solution. Yellow regions likely correspond with clouds, and the infrared retrieval did not converge (but the microwave one did); red points depict a lack of convergence in the infrared and microwave retrievals. For more information on the retrieval, check out this training video on NUCAPS profiles.
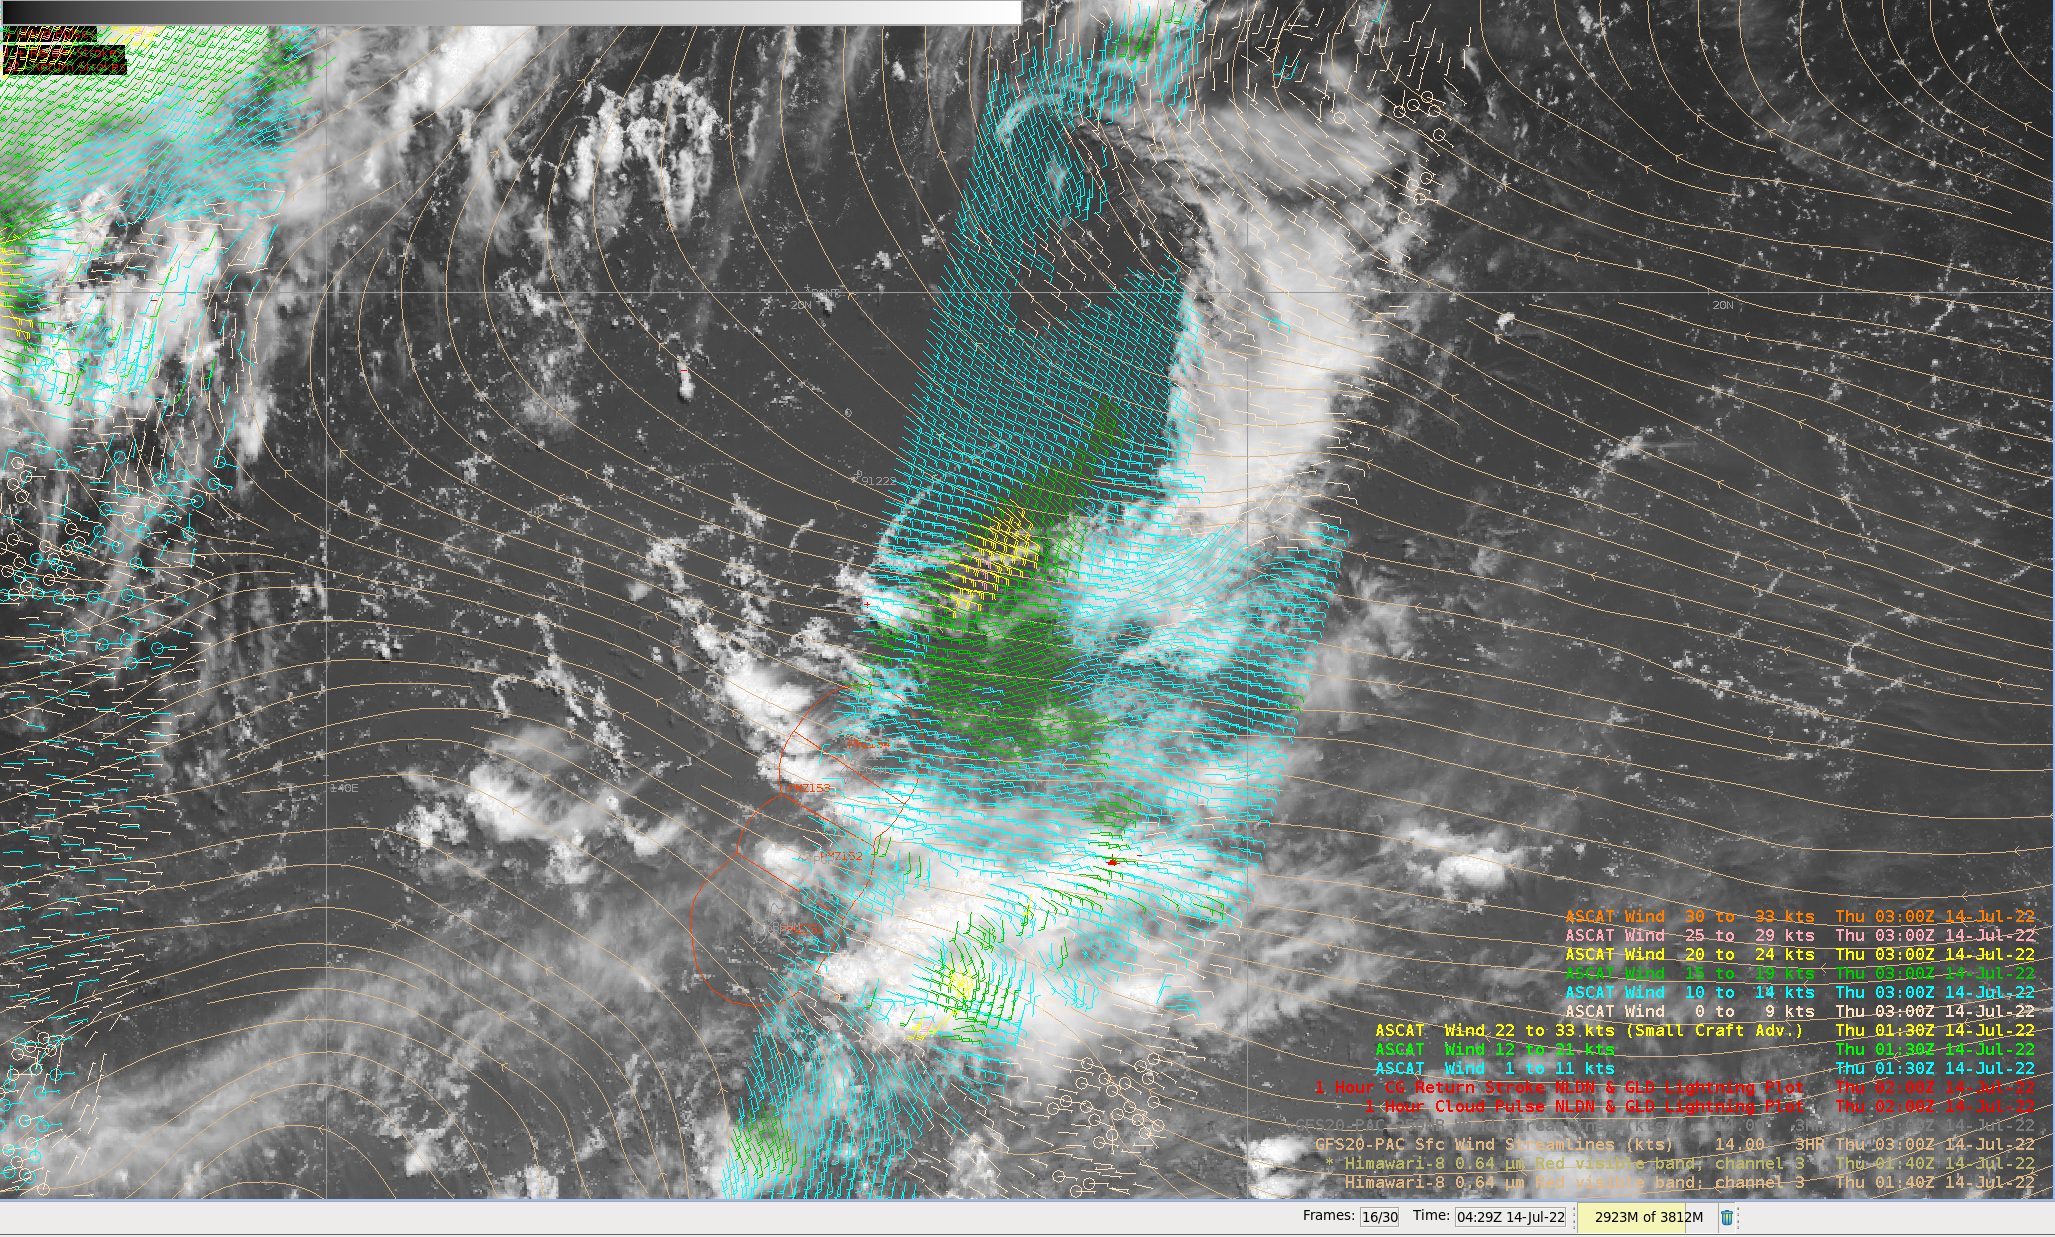
Did the cold pool aloft have a surface signature? Scatterometry overlain on top of Himawari-8 Visible (0.64 µm) imagery, along with a streamline analysis from the NOAA/NWS/NCEP Global Forecasting System (GFS) model, shown below (courtesy Brandon Aydlett, WFO Guam), shows anticyclonic flow underneath the region of the upper-level cold pool. Upper-level (300-mb) streamline (shown here overlain on top of Himawari-8 Upper Level water vapor imagery (Band 8, 6.24 µm), also courtesy Brandon Aydlett) shows an upper-level cyclonic circulation associated with the cold pool.
View only this post Read Less


