This website works best with a newer web browser such as Chrome, Firefox, Safari or Microsoft
Edge. Internet Explorer is not supported by this website.
The sharp eye of Rick DiMaio notes a change in Lake Erie ice coverage from a port in Ontario and then around Long Point. Information from this website suggests this is the tanker Algonorth! Follow this ship today at your favorite website that shows GOES-16 animations! For example: CSPP Geosphere ; CIRA Slider.... Read More
GOES-16 Band 2 Visible (0.64 µm) imagery, 1421 – 1736 UTC on 14 February 2022 (Click to enlarge)
The sharp eye of Rick DiMaio notes a change in Lake Erie ice coverage from a port in Ontario and then around Long Point. Information from this website suggests this is the tanker Algonorth! Follow this ship today at your favorite website that shows GOES-16 animations! For example: CSPP Geosphere ; CIRA Slider. (Update the times as needed!)
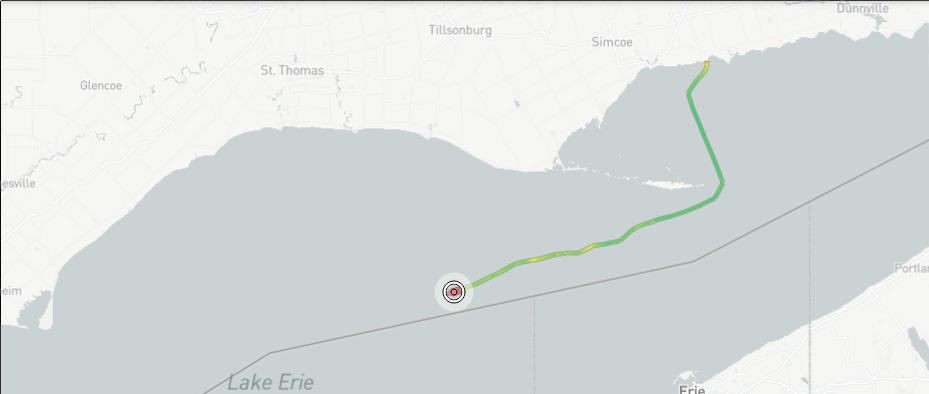
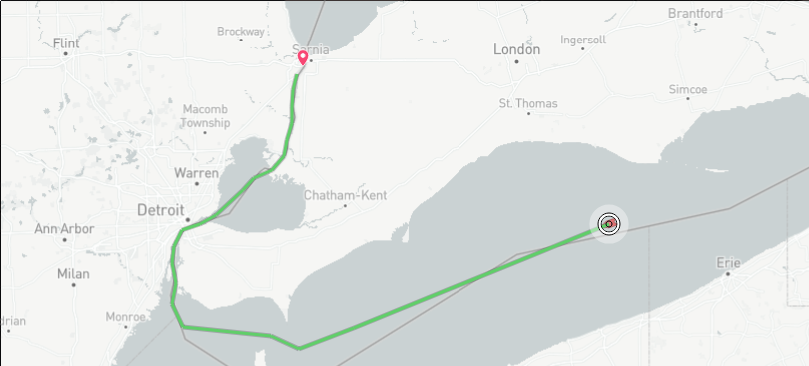
This website (link) can be used to track this ship. Here is the path through 2000 UTC on 14 February 2022, in agreement with the imagery above (and below). The ship (with a draught of 7.6 m) is bound for Sarnia, Ontario (ETA at 1600 UTC on 15 February), on the south shore of Lake Huron where the St. Clair River starts. There is a lot of ice between its present position and there!
An updated loop (through 2126 UTC) is shown below. The obvious wake through the ice becomes much less obvious during the day, suggesting that the ship is passing through thicker and thicker ice.
GOES-16 Band 2 Visible (0.64 µm) imagery, 1421 – 2126 UTC on 14 February 2022 (Click to enlarge)
Something similar happened on 15 February as well, with a ship (an icebreaker) leaving Cleveland.
GOES-16 Band 2 Visible (0.64 µm) imagery, 1421 – 1816 UTC on 15 February 2022 (Click to enlarge)
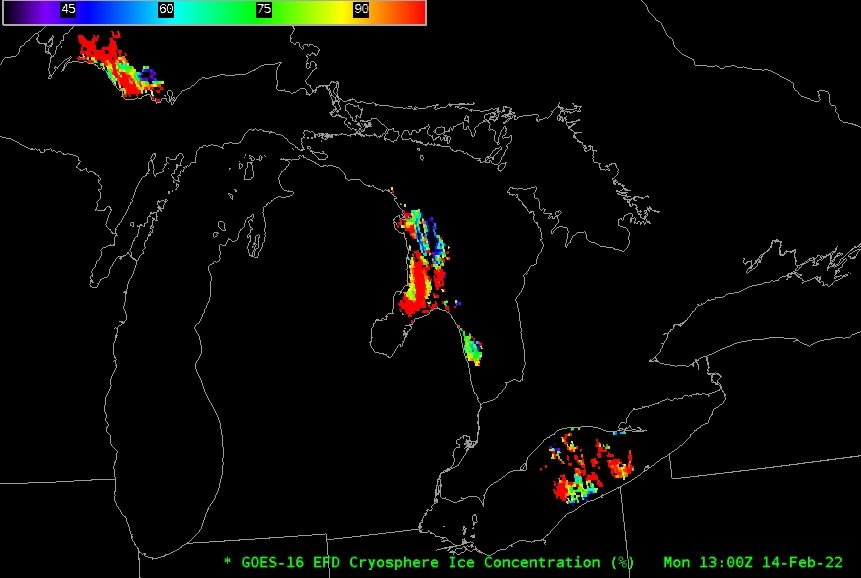
GOES-16 Cryosphere products — Ice Mask, Ice Concentration and Ice Surface Temperature — have been developed and are in a testing phase. The AWIPS screenshot above shows ice concentrations over parts of Lakes Superior, Huron and Erie. These products are created over the Full Disk ABI domain in regions of... Read More
GOES-16 Ice Concentration, 1300 UTC on 4 February 2022 (click to enlarge)
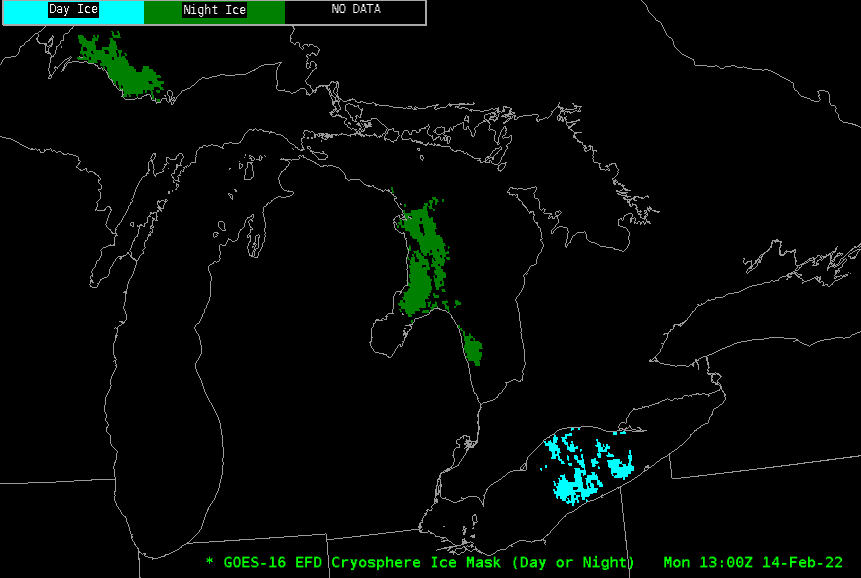
GOES-16 Cryosphere products — Ice Mask, Ice Concentration and Ice Surface Temperature — have been developed and are in a testing phase. The AWIPS screenshot above shows ice concentrations over parts of Lakes Superior, Huron and Erie. These products are created over the Full Disk ABI domain in regions of clear sky only (clouds over Lakes Michigan and Ontario mean Ice Concentration is not computed there at 1300 UTC). The Ice Mask at the same time, below, shows ‘Day Ice’ (cyan) and ‘Night Ice’ (green) flags; cryosphere products are created day and night, but different algorithms are used: Bands 14 and 15 (11.2 µm and 12.2 µm, respectively) are used day and night; the daytime product also uses Bands 2, 3 and 5 (at 0.64 µm, 0.86 µm and 1.61 µm, respectively) as noted in the Advanced Theoretical Basis Document — ATBD — here.
GOES-16 Ice Mask, 1300 UTC on 14 February 2022 (Click to enlarge)
The strength of ABI is frequency (every hour) of observations, so an animation, as shown below, will allow a user multiple views of the lakes; in partly cloudy (or clearing) conditions, values from one hour can augment values from other hours. An example is shown below with Ice Concentration over the Great Lakes. Clearing skies over Lake Erie allow for a more complete description of Lake Ice, whereas increasing clouds over western Ontario and western Lake Superior mean GOES-R Cryosphere observations are lost. In the absence of very strong winds, however, lake ice does not erode quickly, so although the observations are precluded by cloud cover, earlier observations likely remain valid. It is important to know where the clouds are, however, when viewing these products.
GOES-16 Sea Ice Concentration, hourly from 0700-1600 UTC on 14 February 2022 (Click to enlarge)
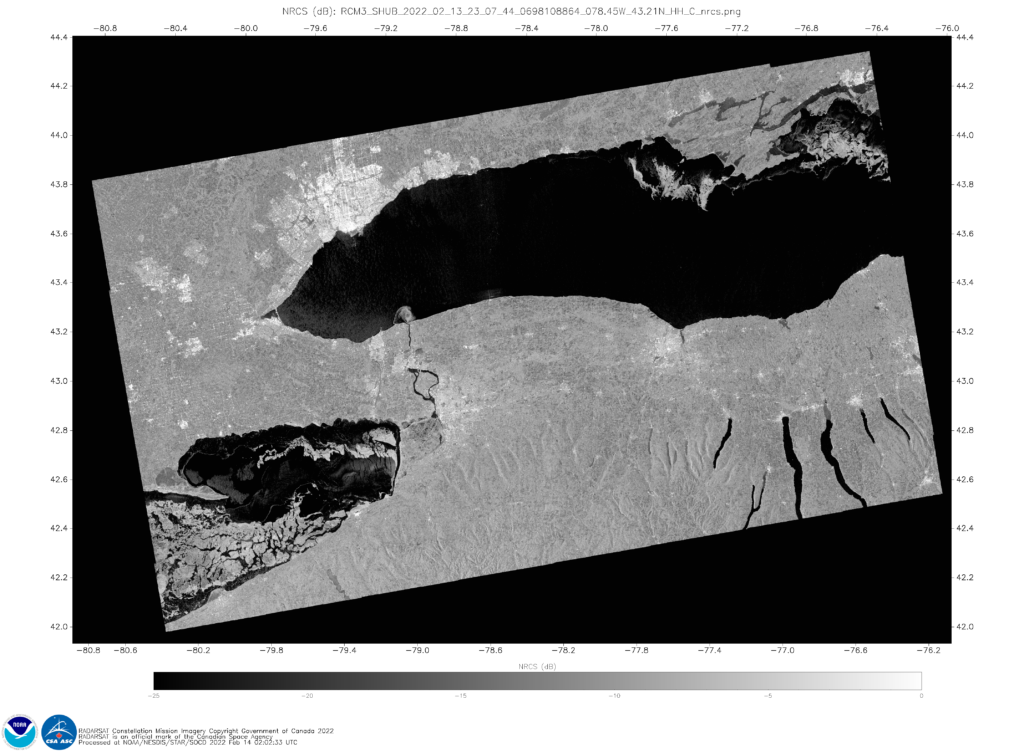
The utility of these clear-sky products with good temporal frequency is augmented in combination with all-sky products that give observations only once or twice daily — such as Synthetic Aperture Radar (SAR) ice observations that available here. For example, the 2307 UTC 13 February Normalized Radar Cross Section (NRCS) image (below) over eastern Lake Erie can be used to fill in information not available from the GOES-16 Cryosphere product.
RADARSat Constellation Mission (RCM)-3 NRCS imagery over Lake Ontario and eastern Lake Erie, 2307 UTC on 13 February 2022 (Click to enlarge)
The AWIPS toggle below shows Ice Surface Temperature plotted below and on top of the Binary Cloud Mask. You will note that there are regions where Ice Surface Temperature is computed in regions where the Binary Cloud Mask shows clouds! How can this occur in Clear Sky products such as the Cryosphere products (a similar toggle could be created with Ice Concentration or Ice Mask)?
The Cloud Mask in AWIPS shows regions that are Clear or Cloudy — it is binary. The Cloud Mask actually has 4 different states (as noted here): Clear, Probably Clear, Probably Cloudy and Cloudy. The Cloud Mask in AWIPS assigns ‘Cloudy’ to all pixels that aren’t Clear: that includes ‘Probably Clear’, ‘Probably Cloudy’ and ‘Cloudy’ pixels. In contrast, the Cryosphere products are produced in regions that are both Clear, or Probably Clear (as noted in the ATBD). That’s why Cryosphere products can show up in regions that AWIPS shows are Cloudy.
GOES-16 Cryosphere Ice Surface Temperature and GOES-16 Cloud Mask, 1300 UTC on 14 February 2022 (Click to enlarge)
GOES-16 (GOES-East) “Red” Visible (0.64 µm) images (above) showed a string of mesovortices over the eastern portion of Lake Superior, along with a small, isolated mesovortex just offshore in the western portion of Lake Superior on 13 February 2022. Increasing ice coverage was also seen along the edges of the lake.Farther to the... Read More
GOES-16 “Red” Visible (0.64 µm) images [click to play animated GIF | MP4]
GOES-16 (GOES-East) “Red” Visible (0.64 µm) images (above) showed a string of mesovortices over the eastern portion of Lake Superior, along with a small, isolated mesovortex just offshore in the western portion of Lake Superior on 13 February 2022. Increasing ice coverage was also seen along the edges of the lake.
Farther to the east, GOES-16 Visible images showed a large and well-defined mesovortex over Lake Huron, with smaller mesovortices along a northern Lake Michigan cloud band (below).
GOES-16 “Red” Visible (0.64 µm) images [click to play animated GIF | MP4]
Finally, over southern Lake Michigan a distinct mesovortex developed along the southern end of a long lake cloud band that began to move inland across far southwestern Lower Michigan (below).
GOES-16 “Red” Visible (0.64 µm) images [click to play animated GIF | MP4]
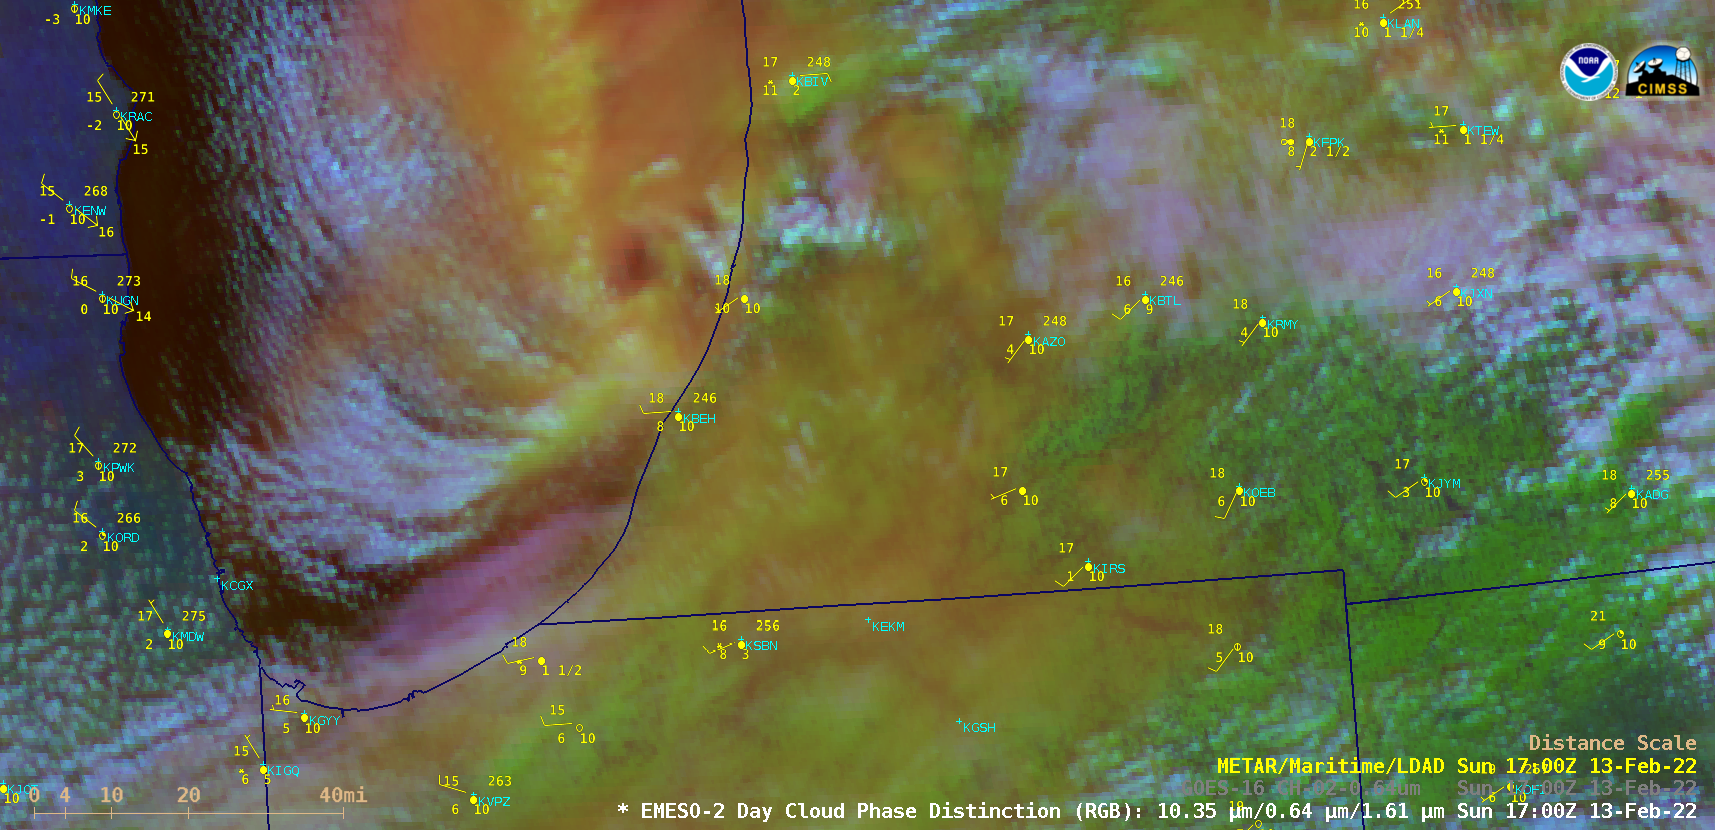
A closer look at the Lake Michigan vortex using 1-minute Mesoscale Domain Sector GOES-16 Day Cloud Phase Distinction RGB images (below) portrayed the shades of green indicative of glaciating convective clouds around the core of the mesovortex and the trailing Lake Michigan band. The confluence of the western periphery of the mesovortex with the trailing lake cloud band produced a prolonged period of heavy snow at Benton Harbor (KBEH) and up to 12 inches of snowfall at downwind locations in Berrien County, Michigan.
GOES-16 Day Cloud Phase Distinction RGB images [click to play animated GIF | MP4]
In a sequence of 1-minute GOES-16 Cloud Top Phase Distinction RGB and Cloud Top Phase derived product images from 2000-2100 UTC (below), the supercooled/mixed phase core of the inland mesovortex was surrounded by a ring of ice phase clouds — while the adjoining Lake Michigan cloud band was classified as a mixed-phase feature as it began to move inland.
GOES-16 Cloud Top Phase Distinction RGB and Cloud Top Phase derived product images [click to play animated GIF | MP4]
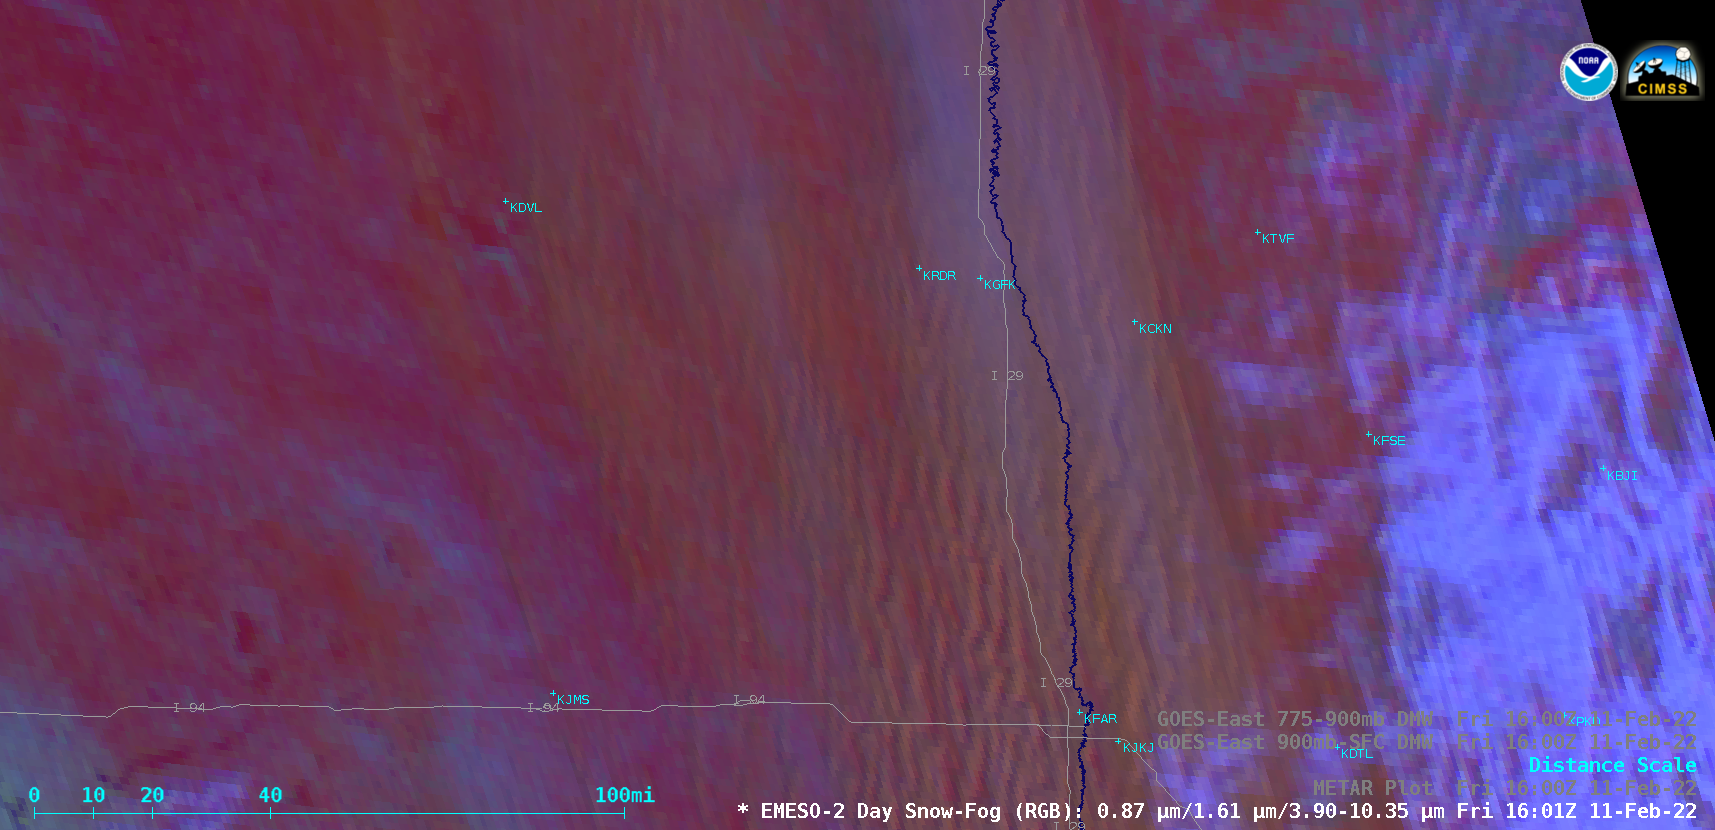
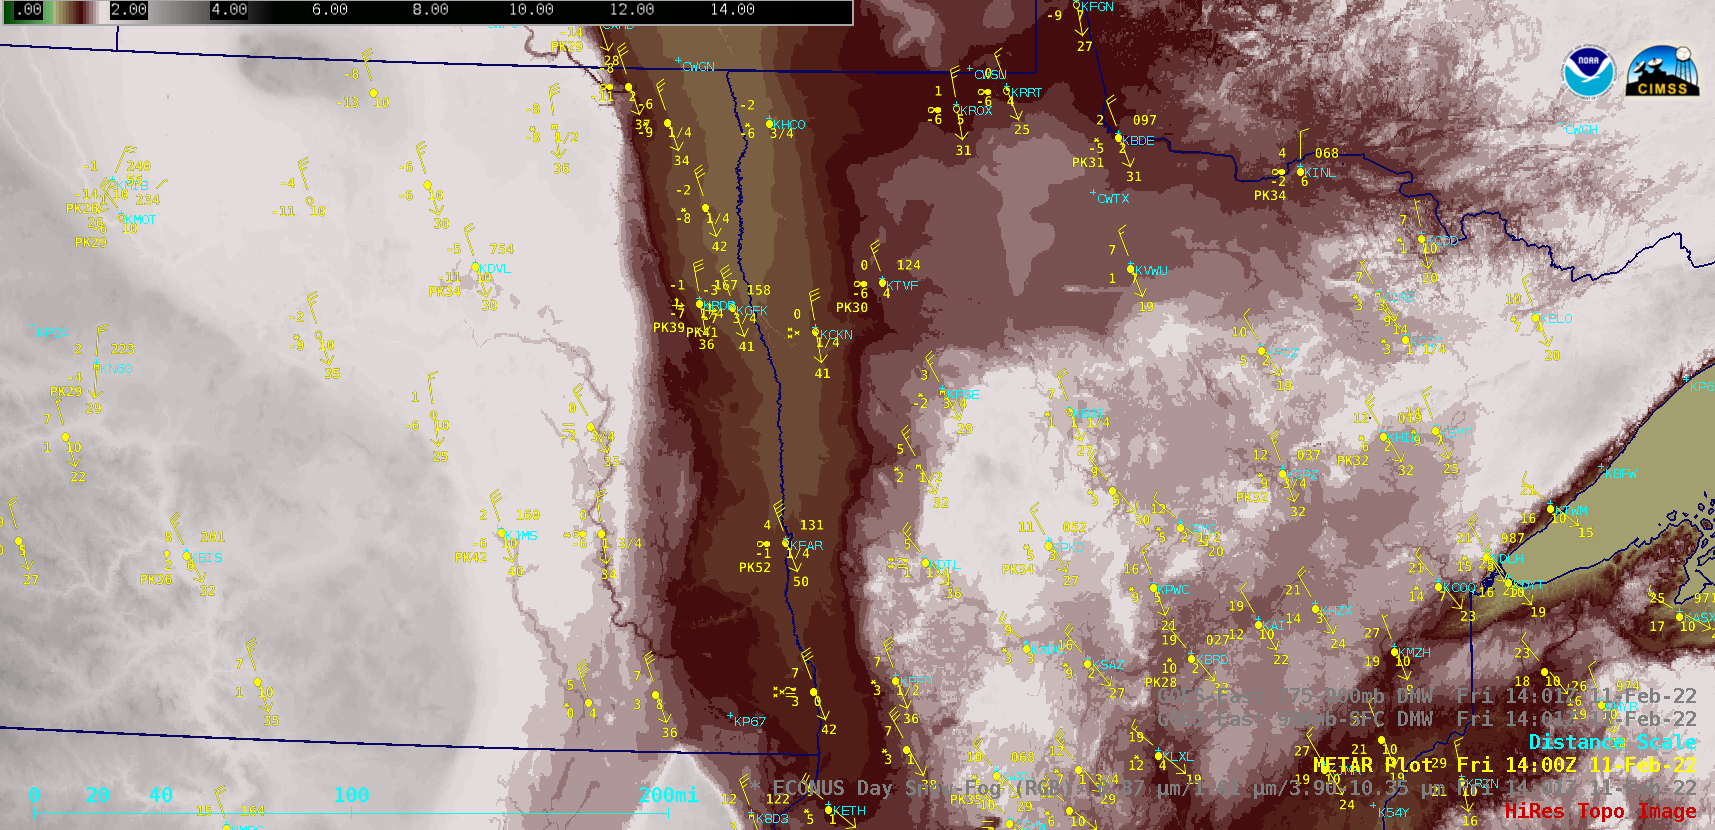
GOES-16 (GOES-East) Day Snow-Fog RGB images (above) showed the signature of widespread horizontal convective rolls — which highlighted areas where blowing snow was creating ground blizzard conditions — across parts of eastern North Dakota and far western Minnesota on 11 February 2022. The elongated bands of blowing snow were more concentrated where they were... Read More
GOES-16 Day Snow-Fog RGB images, with and without plots of METAR surface reports [click to play animated GIF | MP4]
GOES-16 (GOES-East)Day Snow-Fog RGB images (above) showed the signature of widespread horizontal convective rolls — which highlighted areas where blowing snow was creating ground blizzard conditions — across parts of eastern North Dakota and far western Minnesota on 11 February 2022. The elongated bands of blowing snow were more concentrated where they were being channeled by strong northerly winds through the lower elevations of the Red River Valley (peak wind gusts included 60 mph in North Dakota and 56 mph in Minnesota). The surface visibility was briefly reduced to near zero at reporting sites such as Crookston MN (KCKN) and Wahpeton ND (KBWP).
A closer view using 1-minute Mesoscale Domain Sector GOES-16 Day Snow-Fog RGB images (below) showed portions of Interstate 29 (between Grand Forks KGFK and Fargo KFAR) and Interstate 94 (between Jamestown KJMS and Fargo KFAR) that were impacted by these bands of blowing snow.
GOES-16 Day Snow-Fog RGB images, with and without plots of METAR surface reports [click to play animated GIF | MP4]
This event is also discussed at the Satellite Liaison Blog (link).


