This website works best with a newer web browser such as Chrome, Firefox, Safari or Microsoft
Edge. Internet Explorer is not supported by this website.
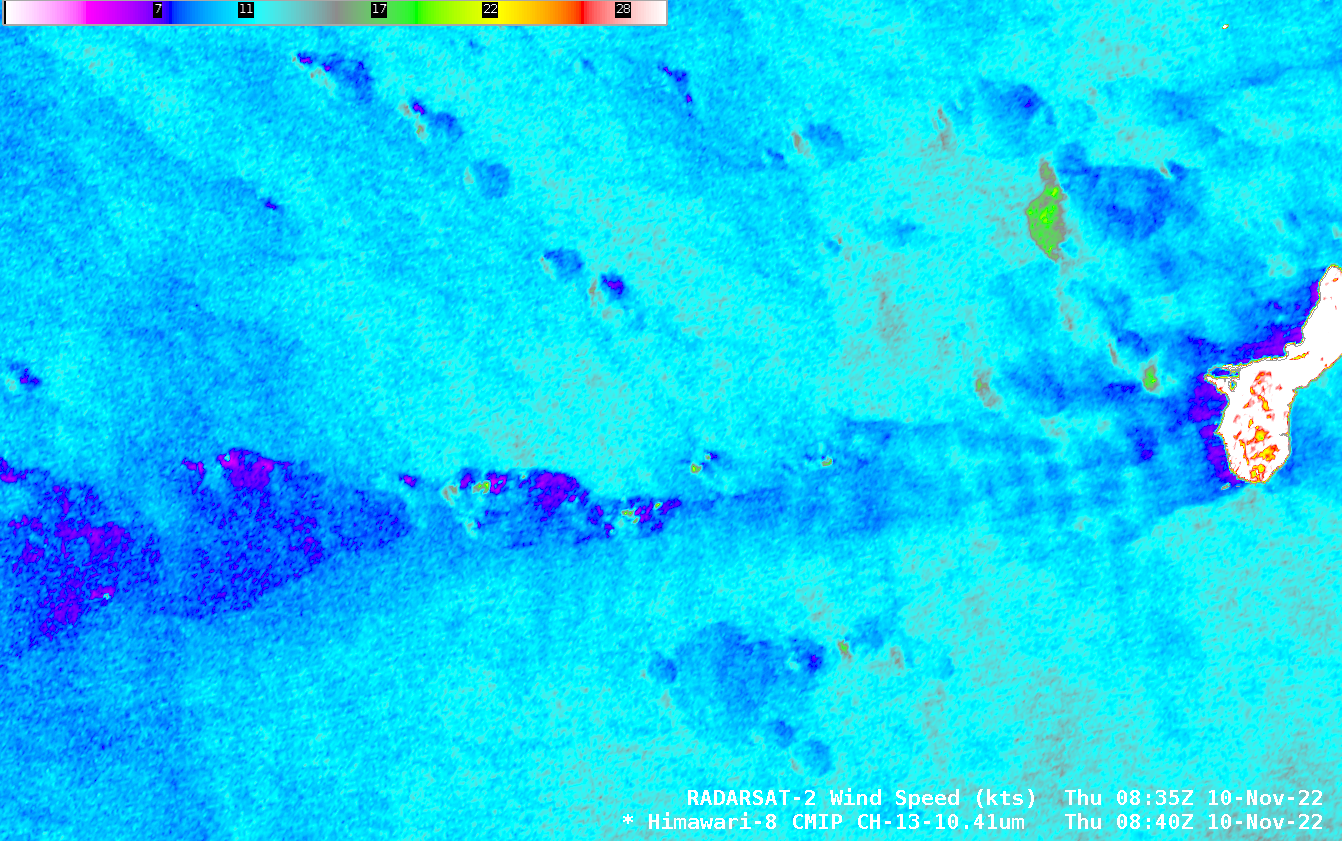
RADARSAT-2 overflew Guam early on 10 November 2022, and the toggle above shows both Himawari-8 imagery at that time with the SAR wind estimates overlain. This was a time of light winds and minimal shower activity. It’s interesting that the wake of weak winds downwind of the islands of Guam... Read More
Himawari Band 13 infrared imagery (10.4 µm) SAR winds from RADARSAT-2, 0840 UTC on 10 November 2022 (Click to enlarge)
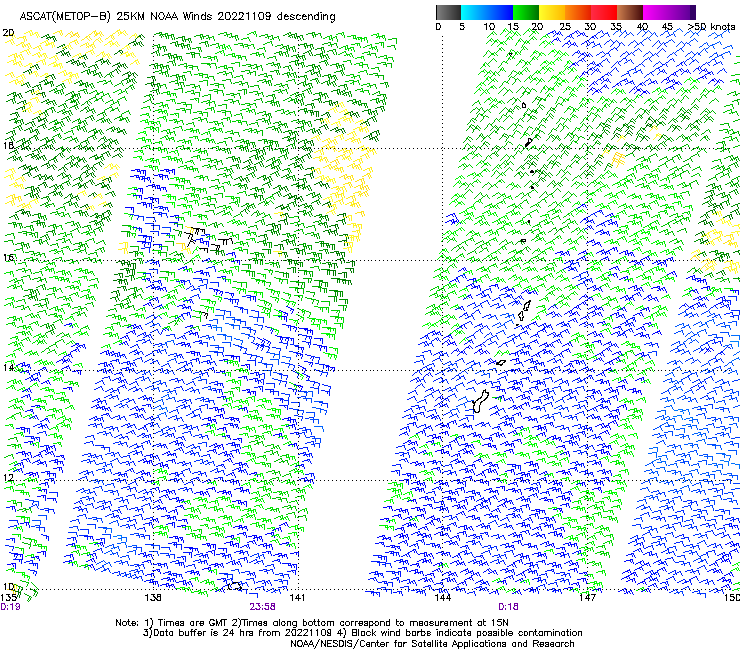
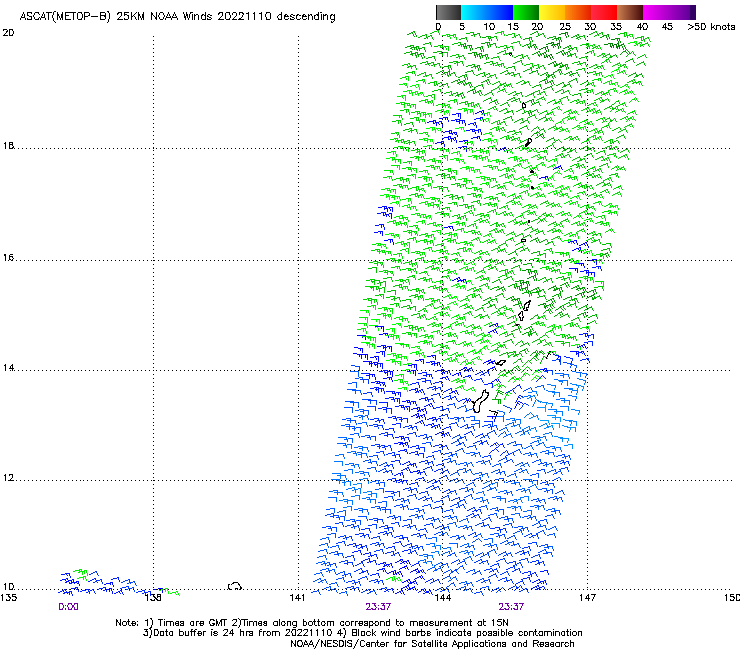
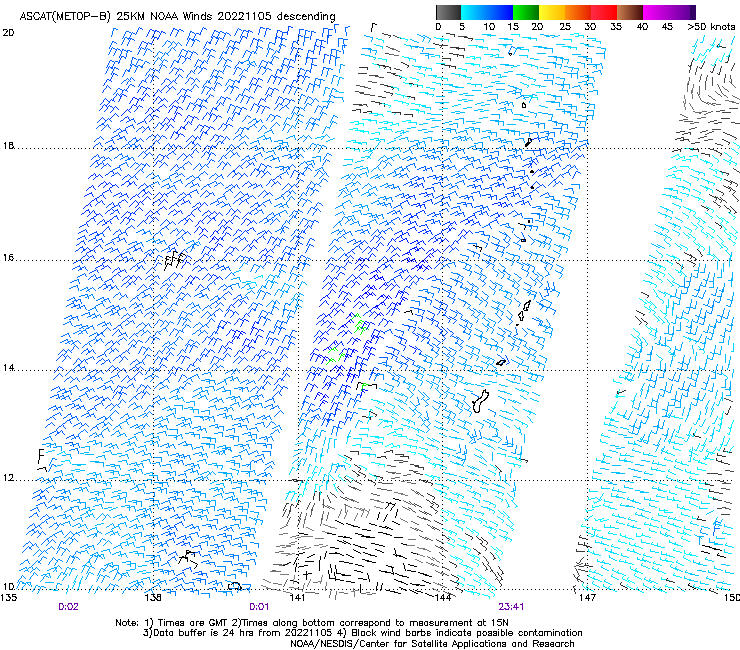
RADARSAT-2 overflew Guam early on 10 November 2022, and the toggle above shows both Himawari-8 imagery at that time with the SAR wind estimates overlain. This was a time of light winds and minimal shower activity. It’s interesting that the wake of weak winds downwind of the islands of Guam (and Rota) are apparent in this regime of weak easterly winds. (Metop-B ASCAT winds from late on 9 November are here, and late on 10 November are here; both images are from the NOAA/NESDIS ‘manati’ website).
A zoomed-in version of the image above is shown below. The windspeed downwind of Guam shows downstream variations in speed, oriented north-south. Those speed changes are very small, from 11-12 knots (cyan enhancement) to 8 or 9 knots (dark blue) enhancements. The coldest cloud tops in the Himawari-8 imagery — to the west of Guam — are associated with strong/weak wind dipoles. The region of stronger winds (around 18 knots, green in the enhancement used) to the west-northwest of Guam are associated with slightly cooler cloud tops, but this line of tropical convection has brightness temperatures in the 15-18oC range: not very tall at all!
Himawari Band 13 infrared imagery (10.4 µm) SAR winds from RADARSAT, 0840 UTC on 10 November 2022 (Click to enlarge)
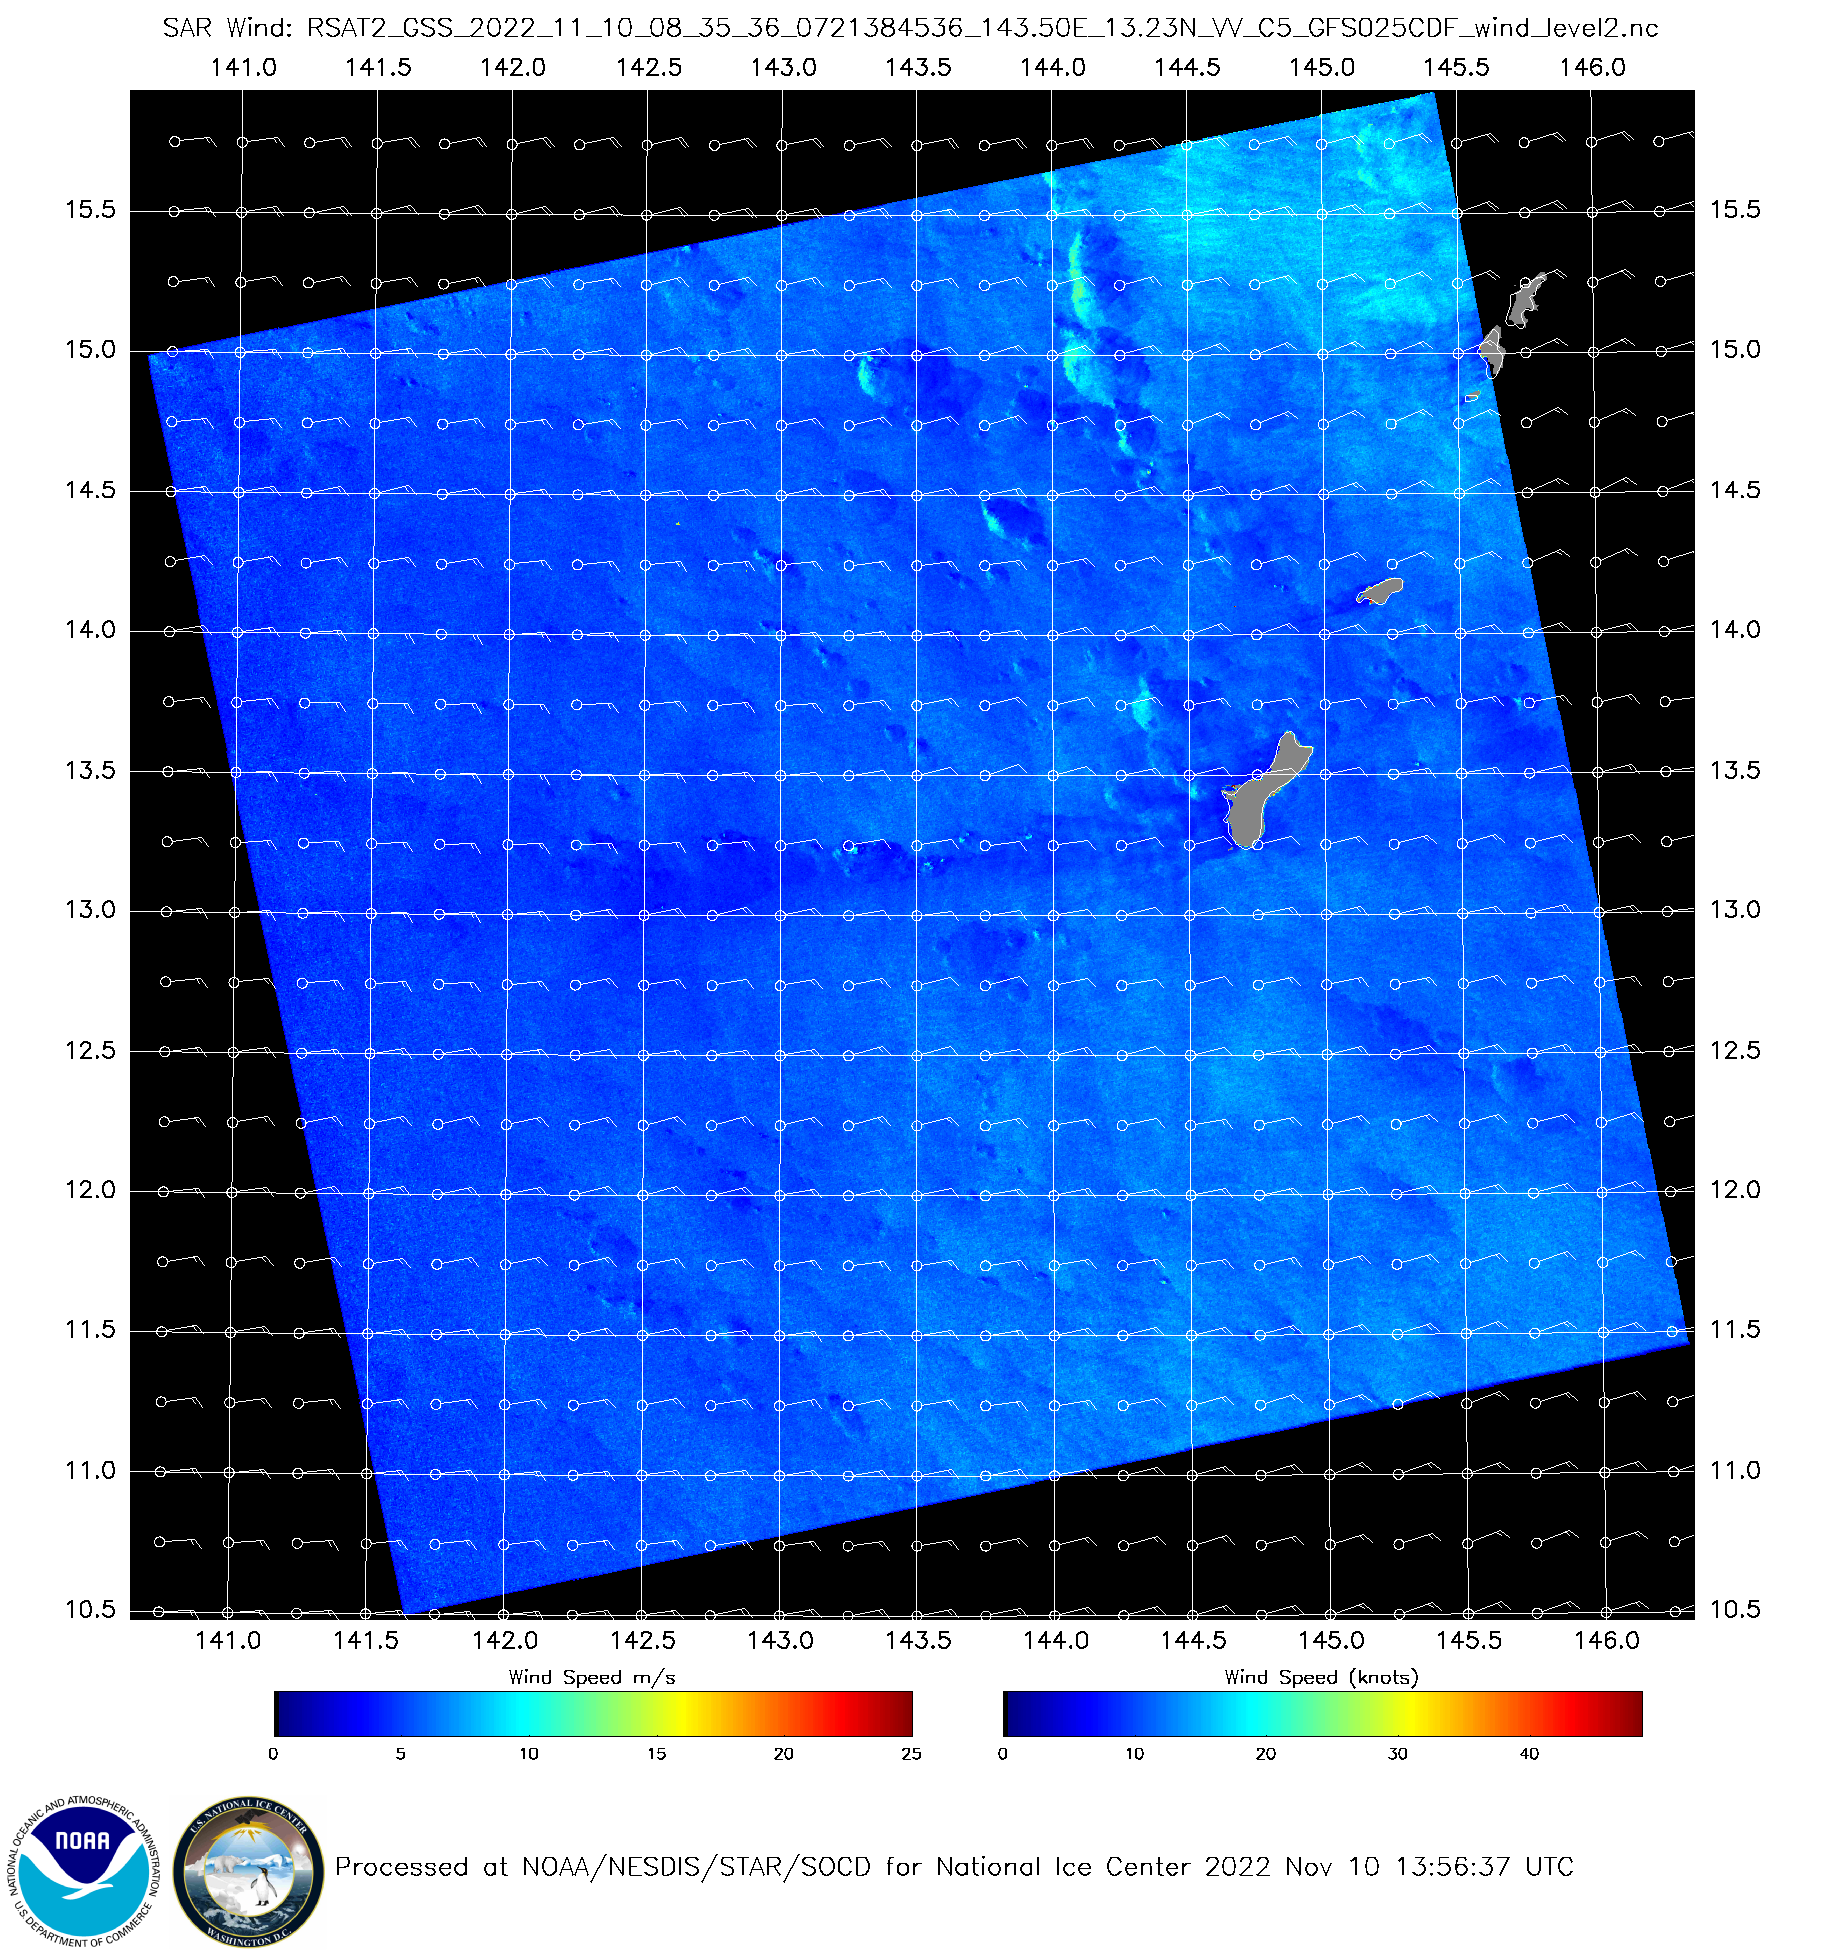
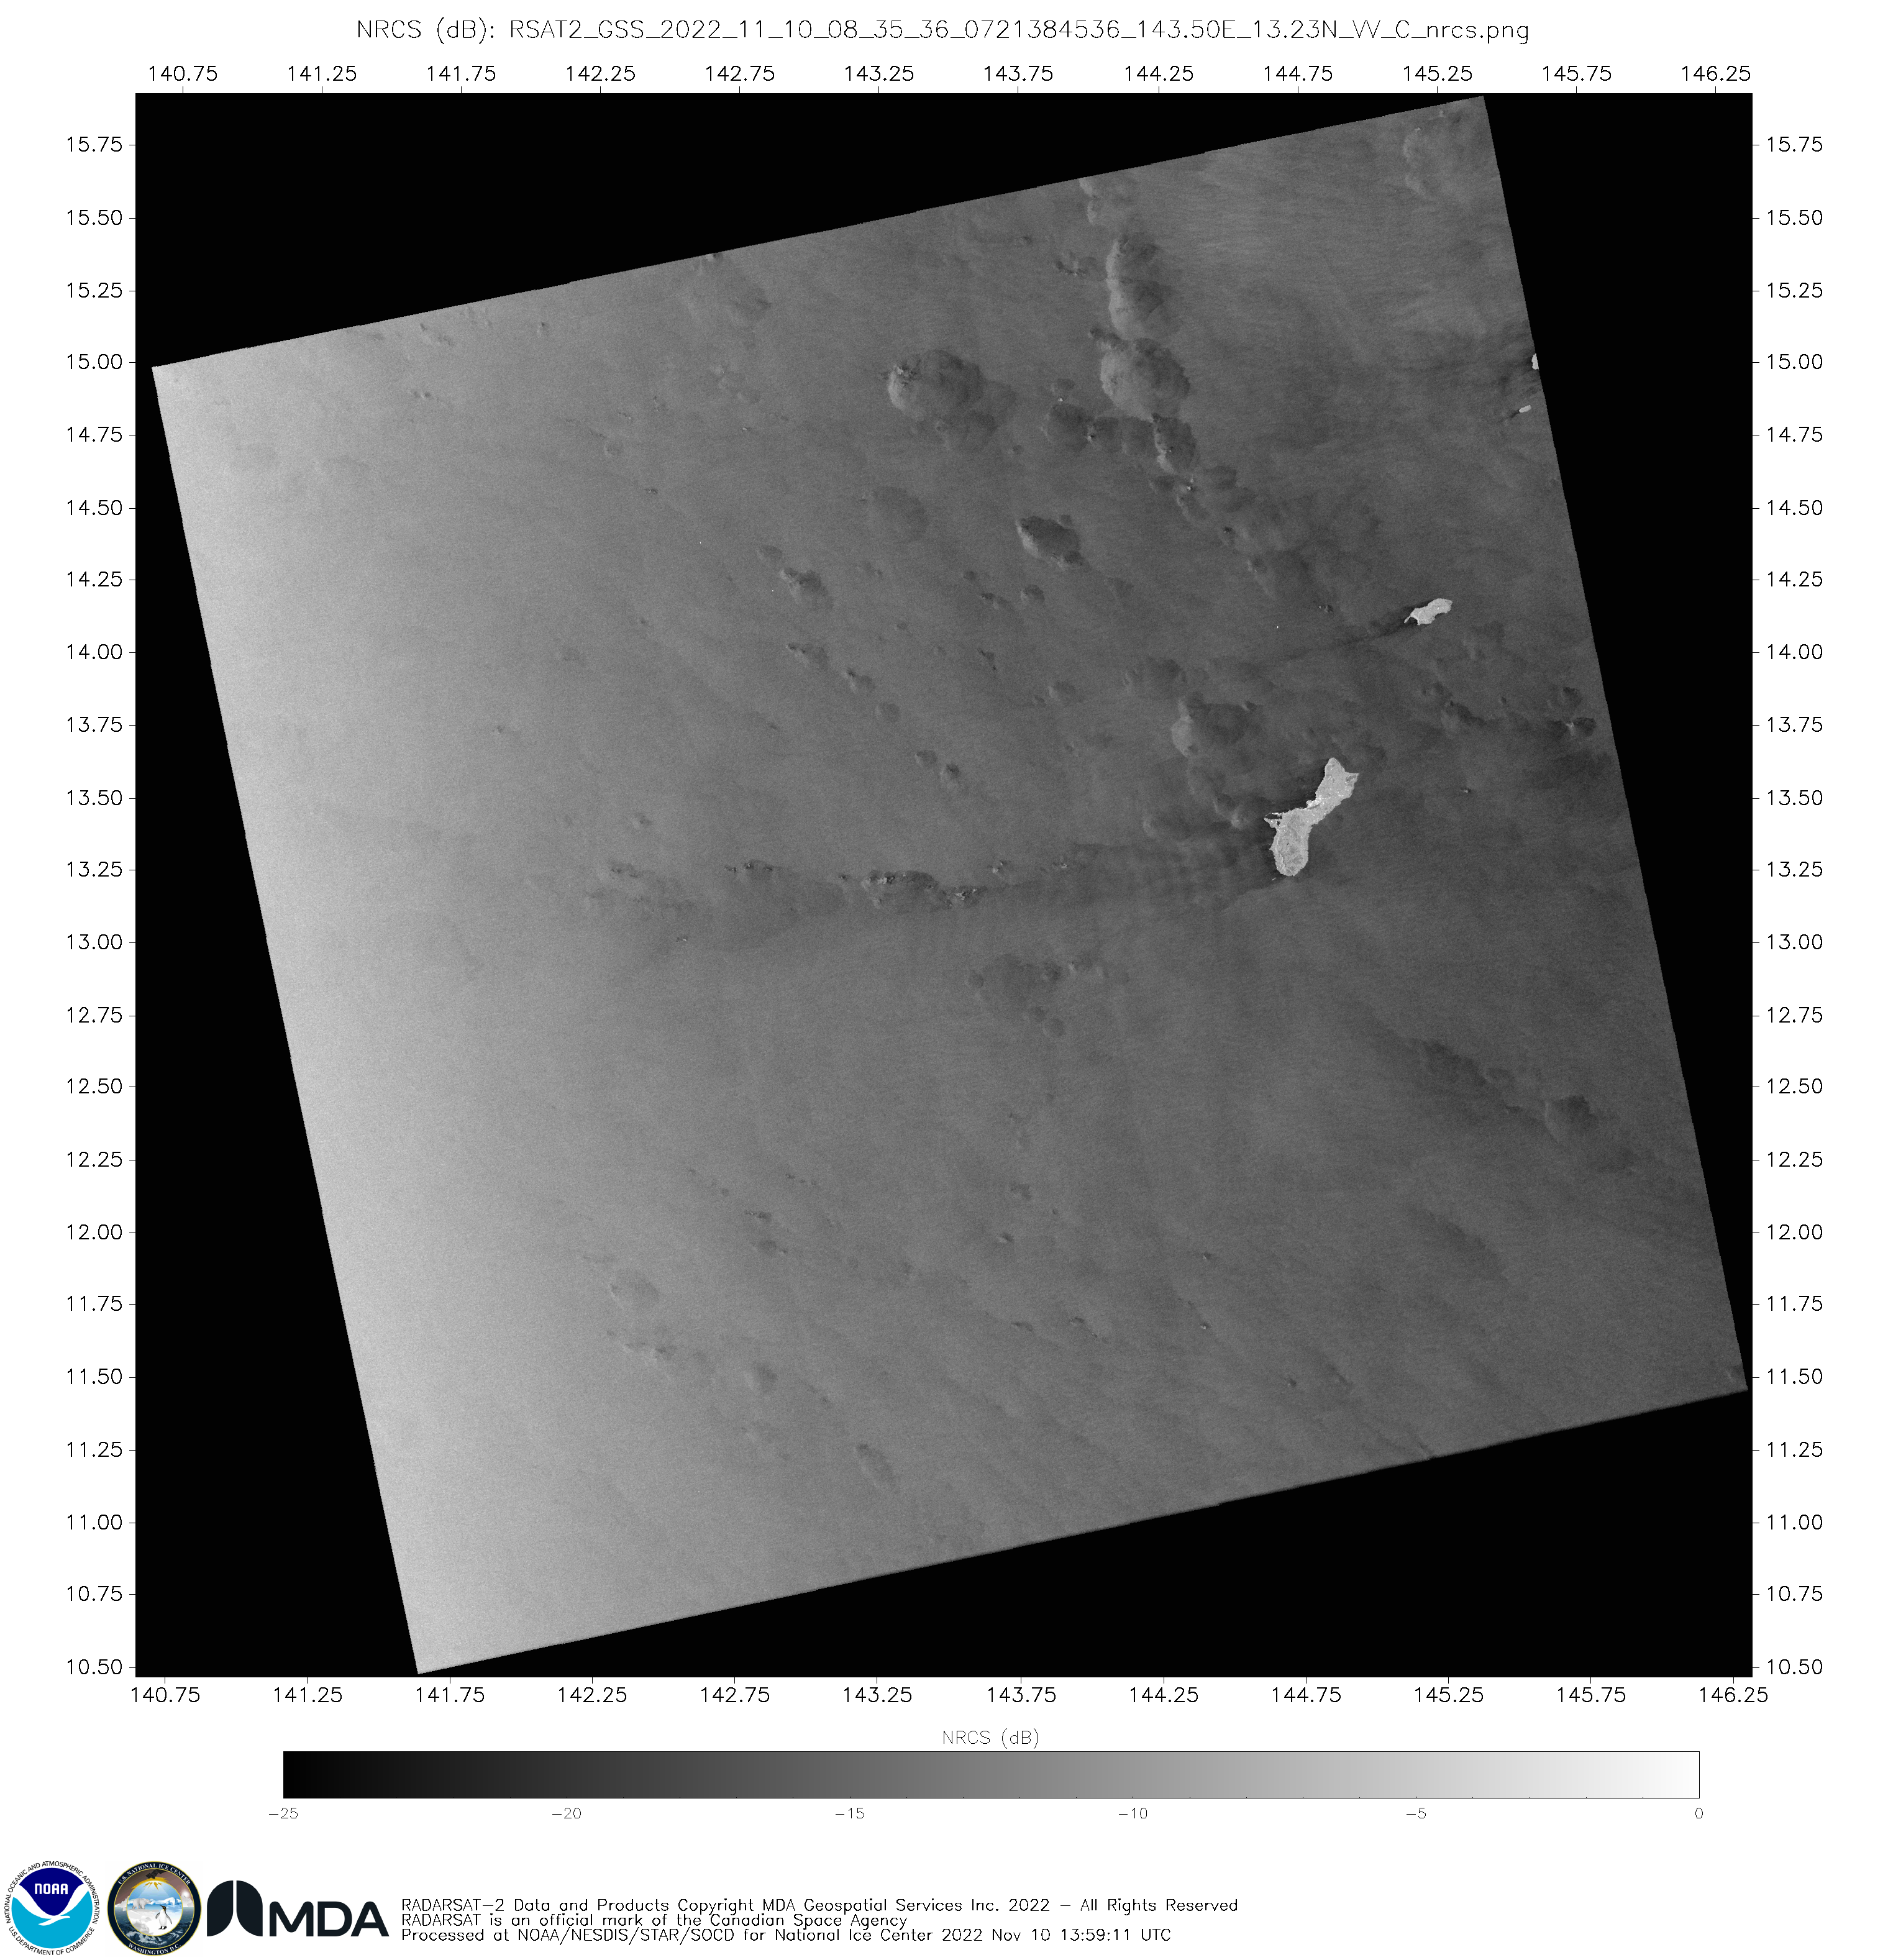
Imagery is also available at the NOAA/NESDIS STAR SAR Winds calendar here; the wind speed and the Normalized Radar Cross Section information are both available, and they are shown in a toggle below.
SAR Wind Speeds and Normalized Radar Cross Section (NRCS) imagery, 0835 UTC on 10 November 2022 (Click to enlarge)
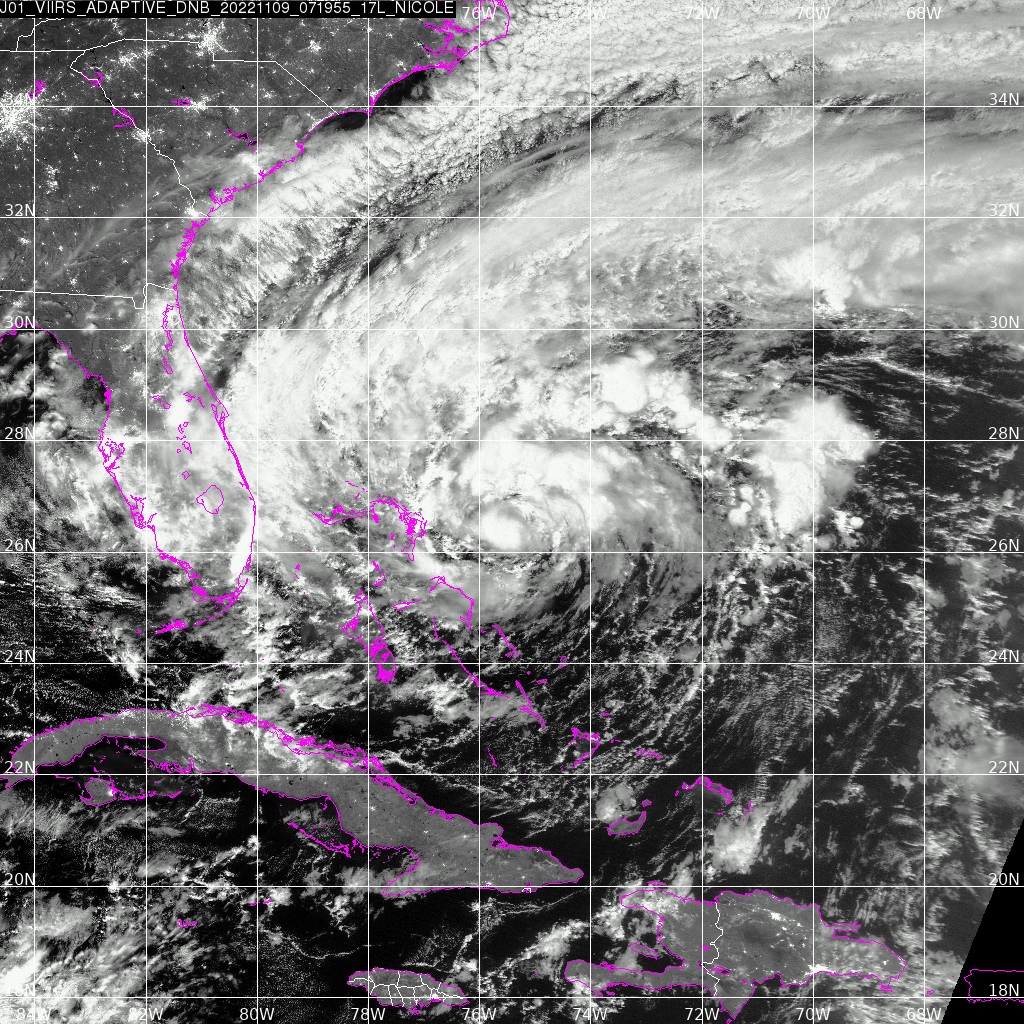
Day Night Band imagery from NOAA’s AOMLDirect Broadcast site, above, shows a low-level circulation with deep convection over the center at 0719 UTC. GOES-16 Low-Level water vapor (Band 10, 7.3 µm) mesoscale sector one imagery, below, (from this website) shows abundant mid-level dry air to the south of the Nicole. Nicole is near... Read More
NOAA-20 (0540 and 0719 UTC) and Suomi NPP (0630 UTC) Day Night Band visible (0.7 µm) imagery centered on Tropical Storm Nicole (Click to enlarge)
Day Night Band imagery from NOAA’s AOMLDirect Broadcast site, above, shows a low-level circulation with deep convection over the center at 0719 UTC. GOES-16 Low-Level water vapor (Band 10, 7.3 µm) mesoscale sector one imagery, below, (from this website) shows abundant mid-level dry air to the south of the Nicole. Nicole is near a dry environment.
GOES-16 Band 10 (low level water vapor) infrared (7.3 µm) imagery, 1350-1449 UTC on 9 November 2022
Nicole’s path, shown below, (from this website), is along a corridor of low shear, and towards the warm waters of the Gulf Stream.
Nicoles’s path on top of an SST analysis. Also shown: 1400 UTC 200-850mb Shear (Click to enlarge)
A true-color visible mp4 animation, below, from the CSPP Geosphere site, (direct link to animation) shows the center of Nicole very close to dryer air to the south. This proximity to dry air argues against rapid intensification.
GOES_16 True-color animation, 1216 – 1531 UTC on 9 November 2022
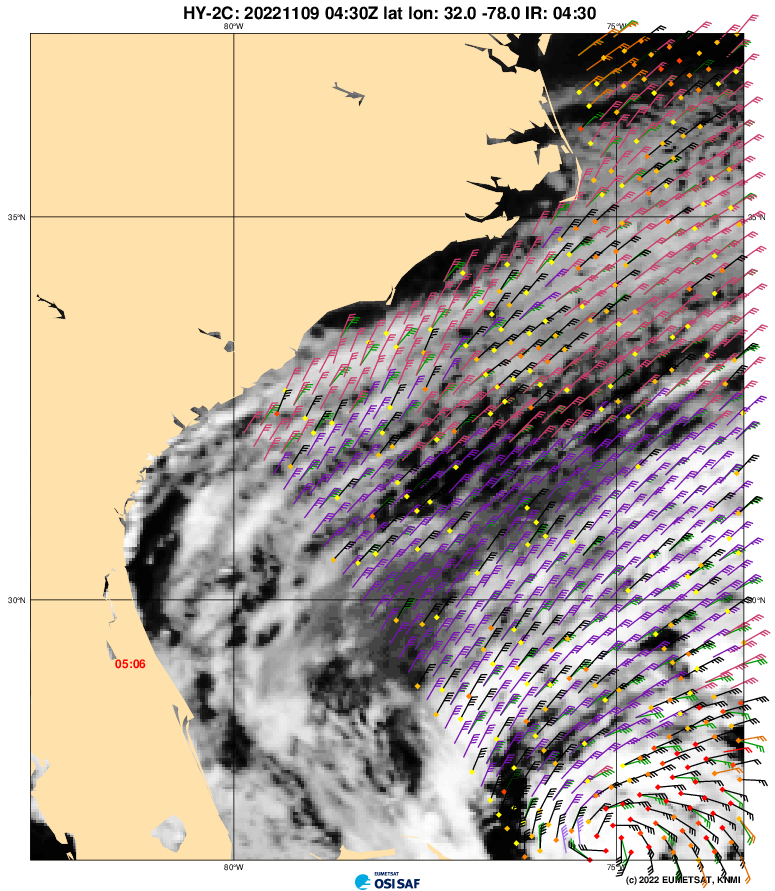
Nicole does have a very large windfield. HY-2C scatterometery, above, (from this website), show the very large region of tropical storm-force winds over much of the South Atlantic Bight, from the Bahamas up to Cape Hatteras! Coastal erosion and flooding from the wind and generated waves (in addition to storm surge) is likely, and residents along the coast should heed advisories/warnings.
HY2C Scatterometer winds, 0430 UTC on 9 November 2022 (Click to enlarge)
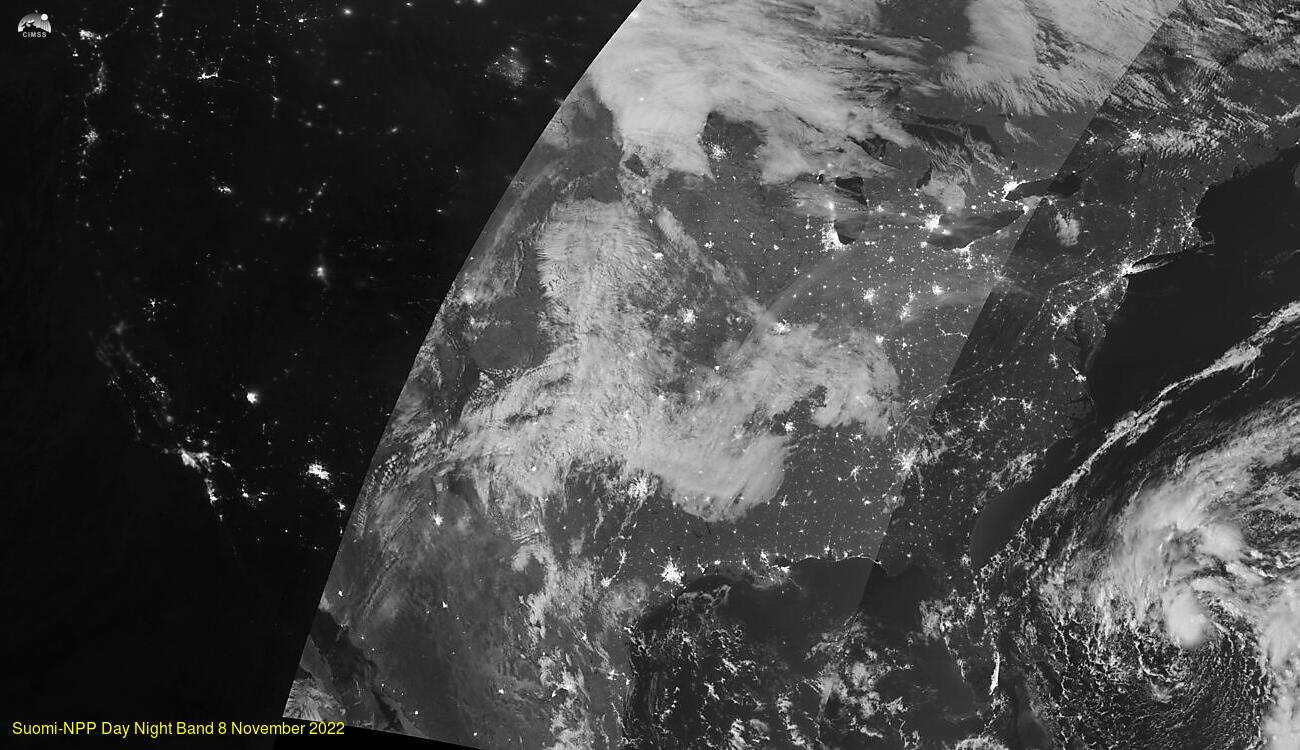
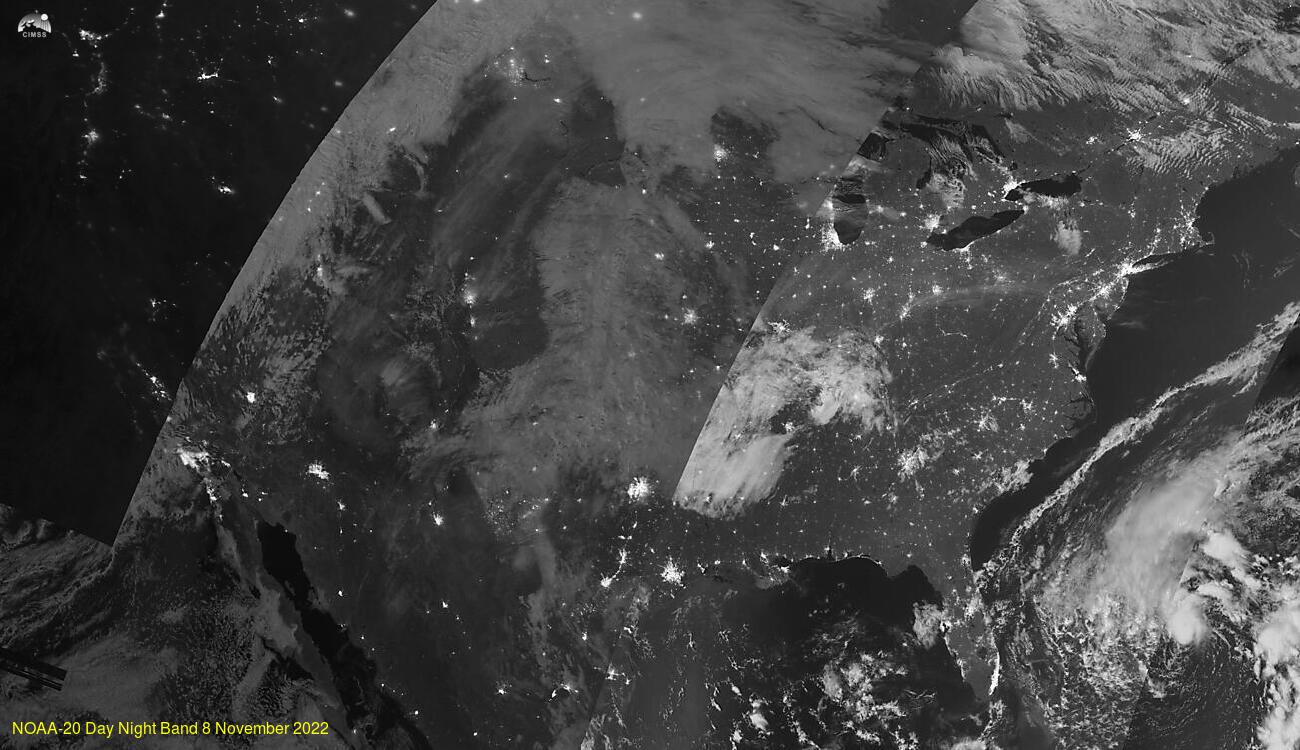
The Day Night band on Suomi NPP and on NOAA-20 (and on the soon-to-be-launched JPSS-2 that will become NOAA-21) rely on reflected moonlight to provide crisp imagery of clouds. When a lunar eclipse occurs, as happened early on 8 November 2022, lunar illumination is lost. The lunar eclipse of 8 November started at 0803 UTC,... Read More
Suomi NPP and NOAA-20 Day Night Band images, 8 November 2022 (click to enlarge)
The Day Night band on Suomi NPP and on NOAA-20 (and on the soon-to-be-launched JPSS-2 that will become NOAA-21) rely on reflected moonlight to provide crisp imagery of clouds. When a lunar eclipse occurs, as happened early on 8 November 2022, lunar illumination is lost. The lunar eclipse of 8 November started at 0803 UTC, with totality from 1017 to 1142 UTC, and the eclipse ended 1249 UTC. (Details are here.)
The toggle above shows Suomi NPP and NOAA-20 imagery (from the VIIRS Today website); when Suomi NPP overflew the east coast (at around 0700 UTC, viewing Tropical Storm Nicole to the east of Florida) and the midwest (around 0830 UTC), the lunar eclipse had not yet started, or its effects were minimal (here is a map of Suomi NPP orbital paths). NOAA-20 overflew the midwest 90 minutes after Suomi NPP when the Lunar Eclipse was starting to reduce illumination. For both satellites, the overflights over the western US occurred during totality; lunar illumination was minimal.
Previous lunar eclipses are discussed here, here and here.
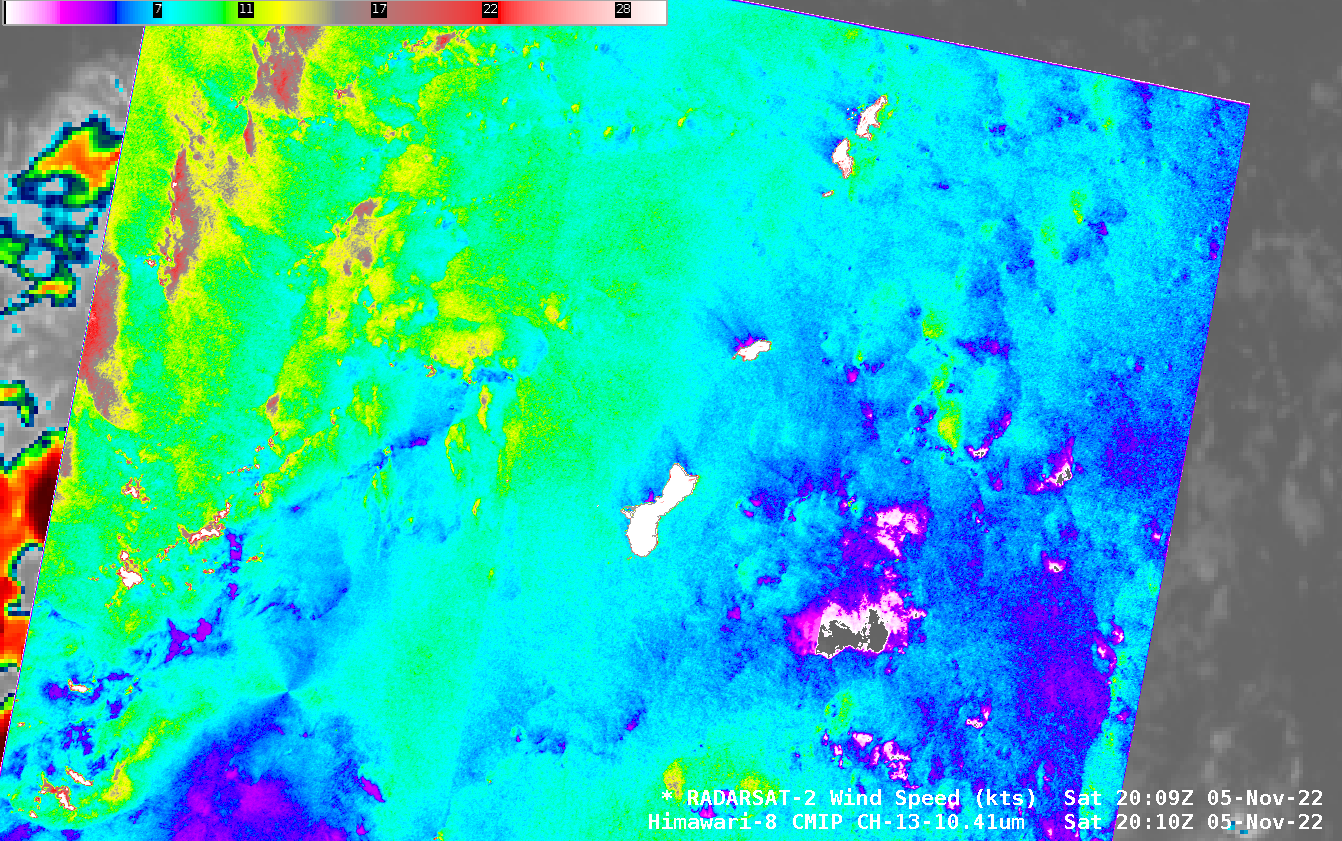
Synthetic Aperture Radar (SAR) data retrievals continue over Guam, with 10 planned for November. The toggle above compares the 2009 UTC SAR footprint (from RADARSAT-2) with Himawari-8 Clean Window (10.41) infrared imagery at 2010 UTC (on 5 November 2022). These data are also available online at this NOAA/STAR Website; there are also... Read More
Himawari-8 Clean Window infrared (Channel 13, 10.4 µm) and SAR Winds, 2010 UTC on 5 November 2022 (Click to enlarge)
Synthetic Aperture Radar (SAR) data retrievals continue over Guam, with 10 planned for November. The toggle above compares the 2009 UTC SAR footprint (from RADARSAT-2) with Himawari-8 Clean Window (10.41) infrared imagery at 2010 UTC (on 5 November 2022). These data are also available online at this NOAA/STAR Website; there are also direct links to wind analyses and Normalized Radar Cross Section (NRCS) data. MetOp-B Scatterometer winds for this time (from the manati website), show light southeasterly winds over the Guam and islands to its northeast: Rota, the very small Aquipan, Tinian and Saipan.
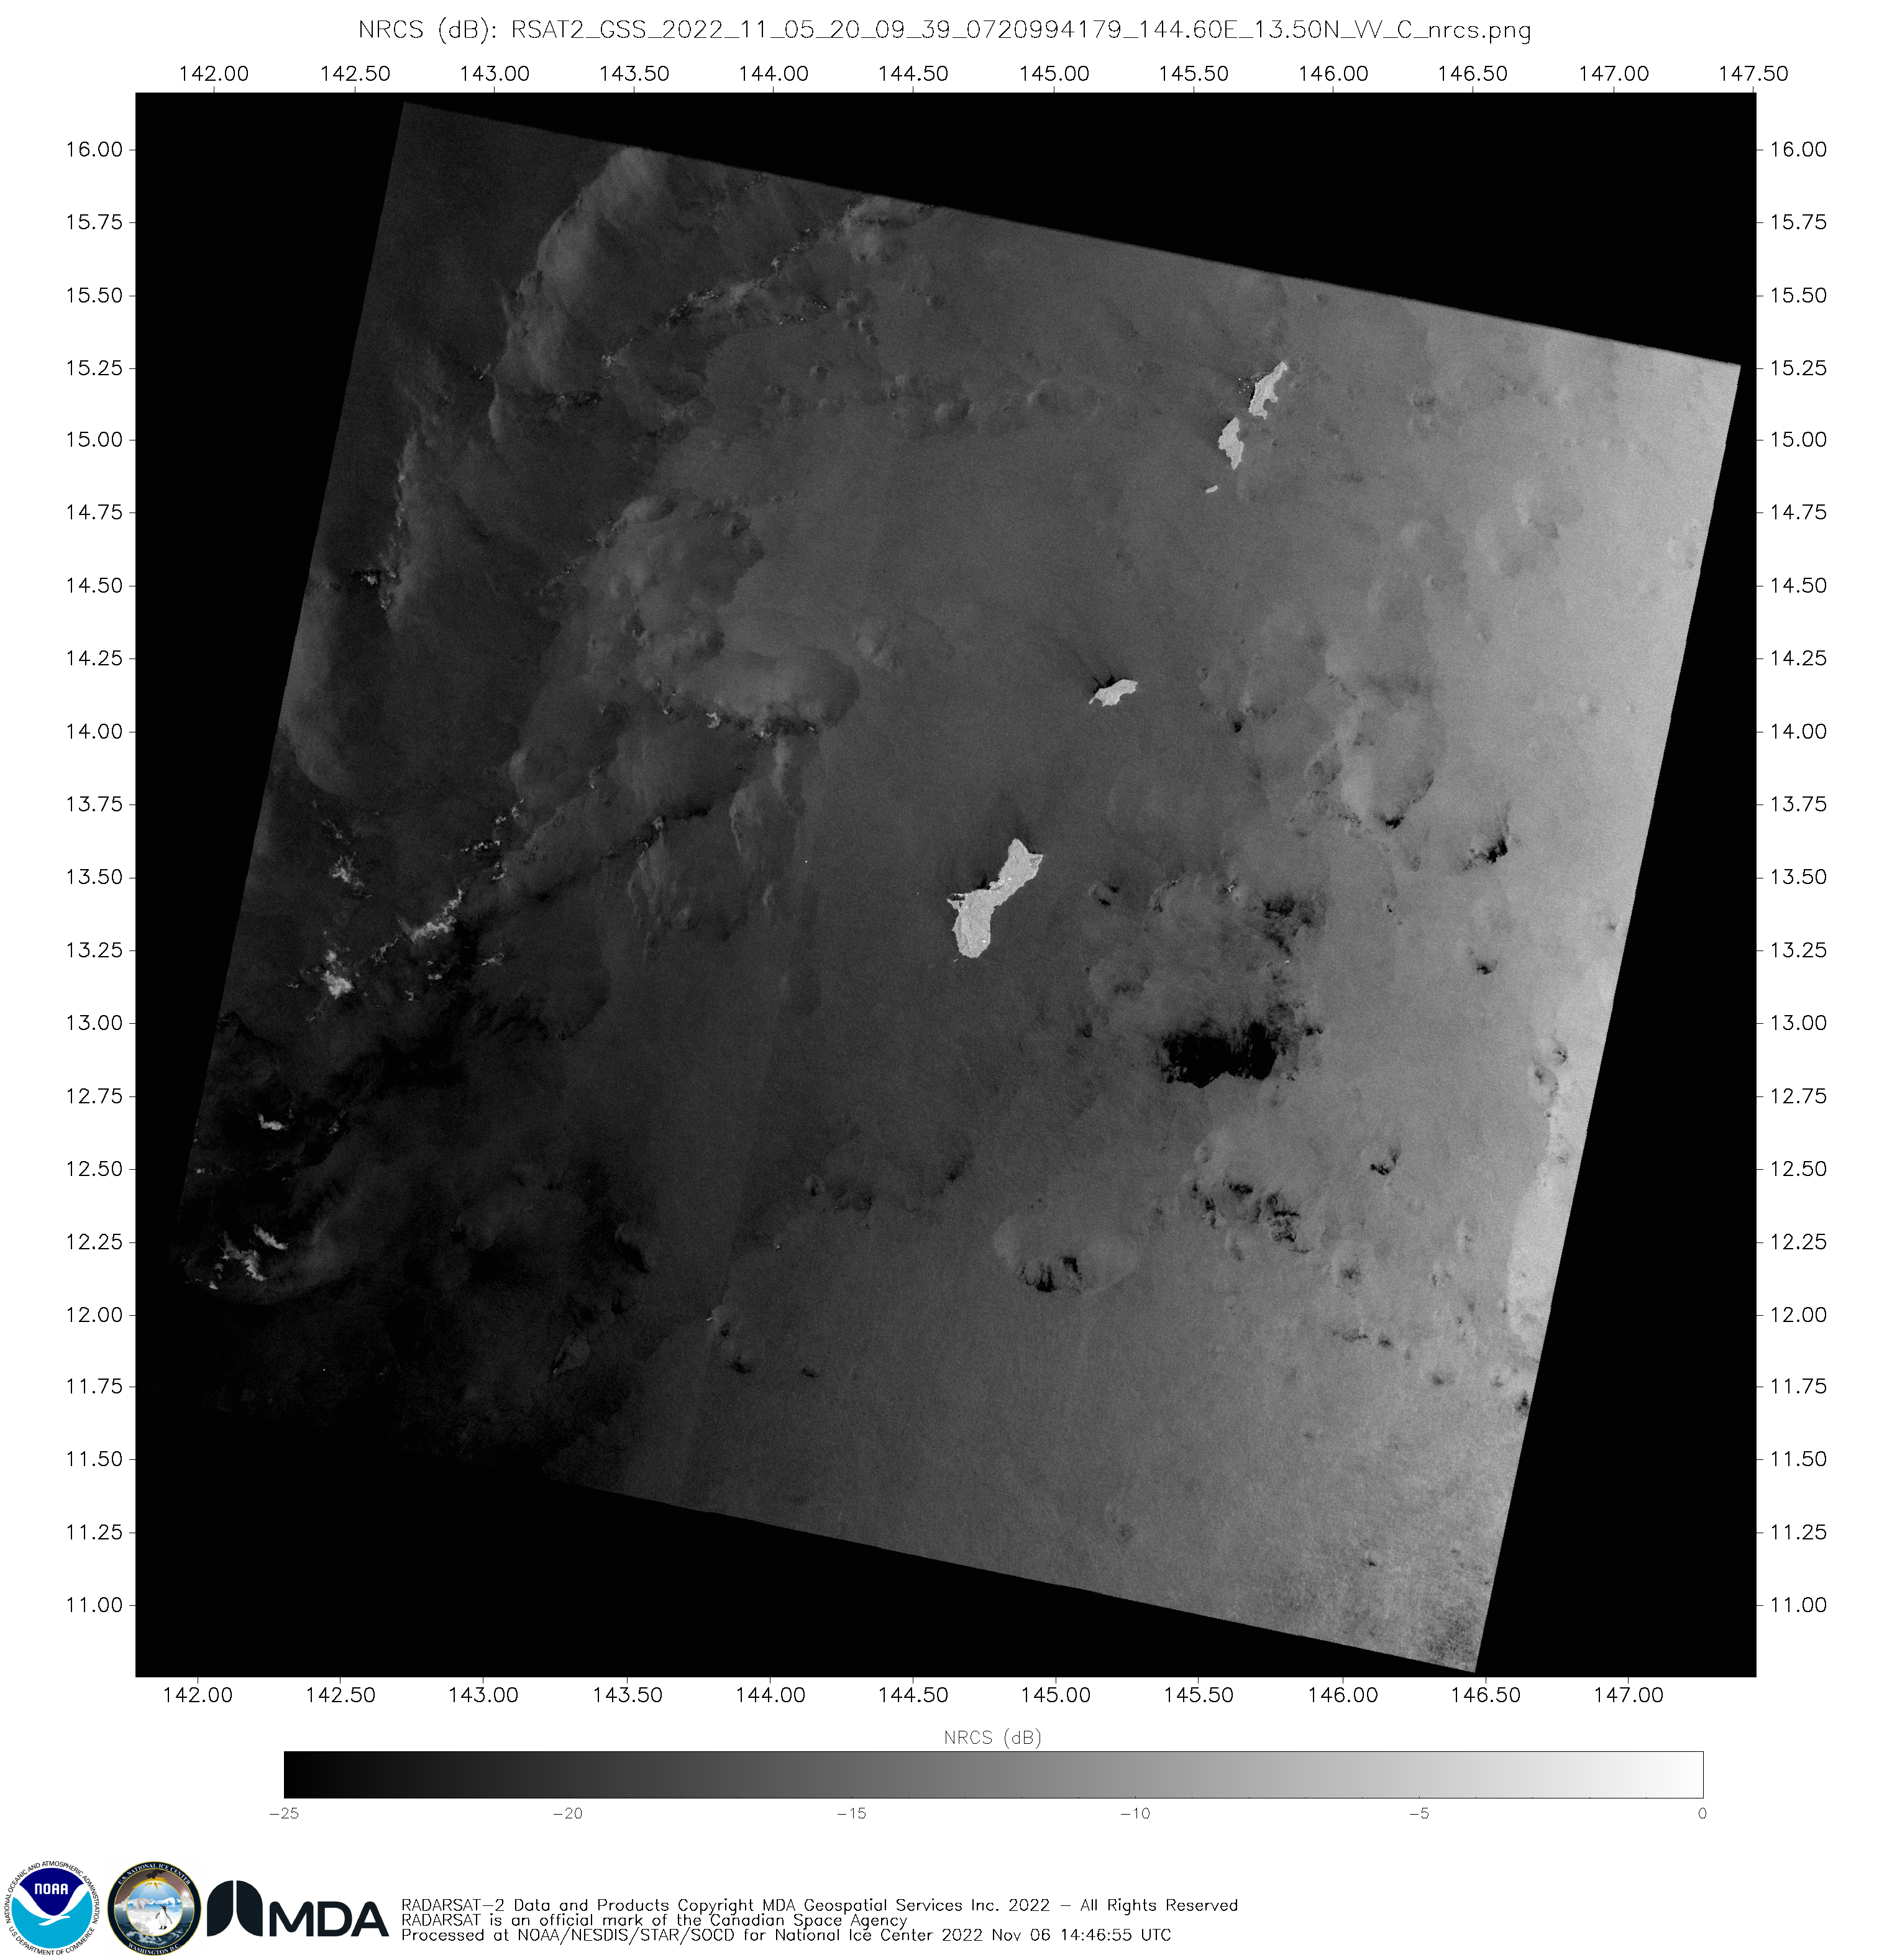
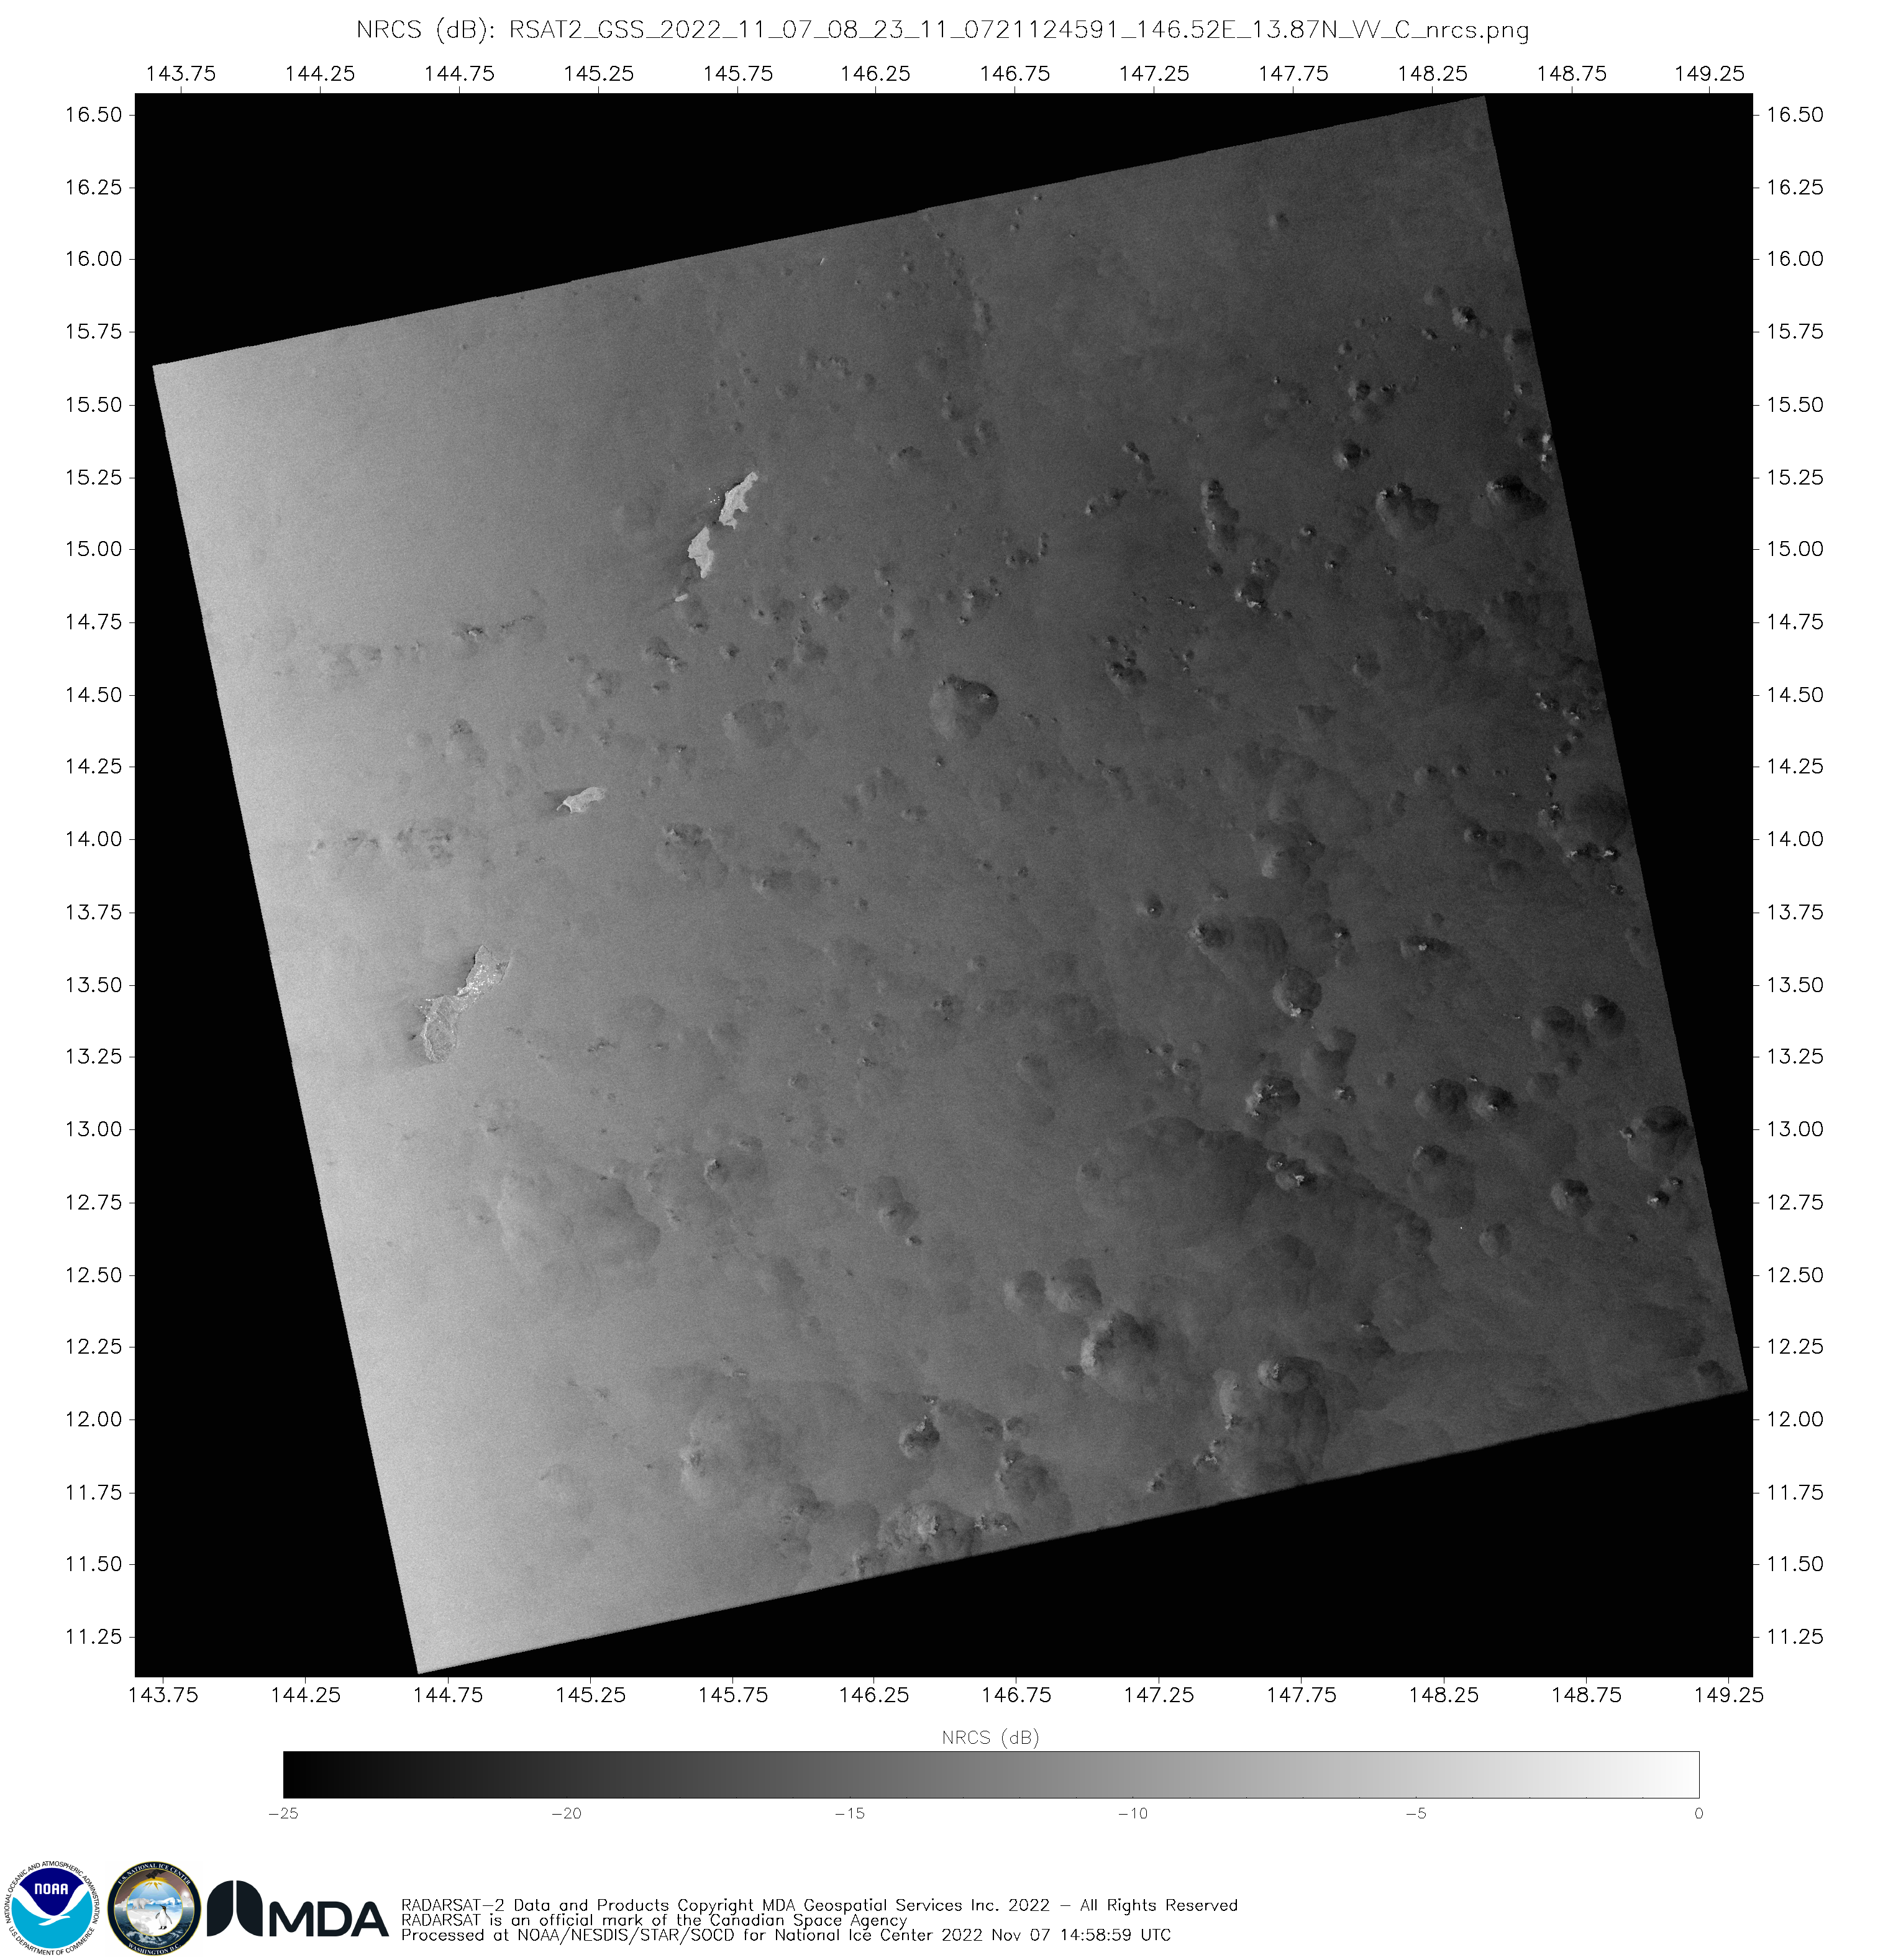
The SAR Wind observations show several things. Each of the islands has a wind shadow, with lighter winds downwind of the islands (that is, to their north and west given the prevailing southeasterlies). The strongest winds — 30 to 40 knots — are most likely a result of cloud ice causing a much greater SAR return, and this can be verified by viewing the Normalized Radar Cross Section, shown below, from this link. Feathery features that occur in the NRCS imagery are most likely cloud ice, and the enhanced reflection from that cloud ice results in an analysis that shows stronger surface winds than may be present. So an analyst who sees very strong winds in/near deep convection should verify what kind of hydrometeors might be in the cloud.
Normalized Radar Cross Section, 2009 UTC on 5 November 2022 (Click to enlarge)
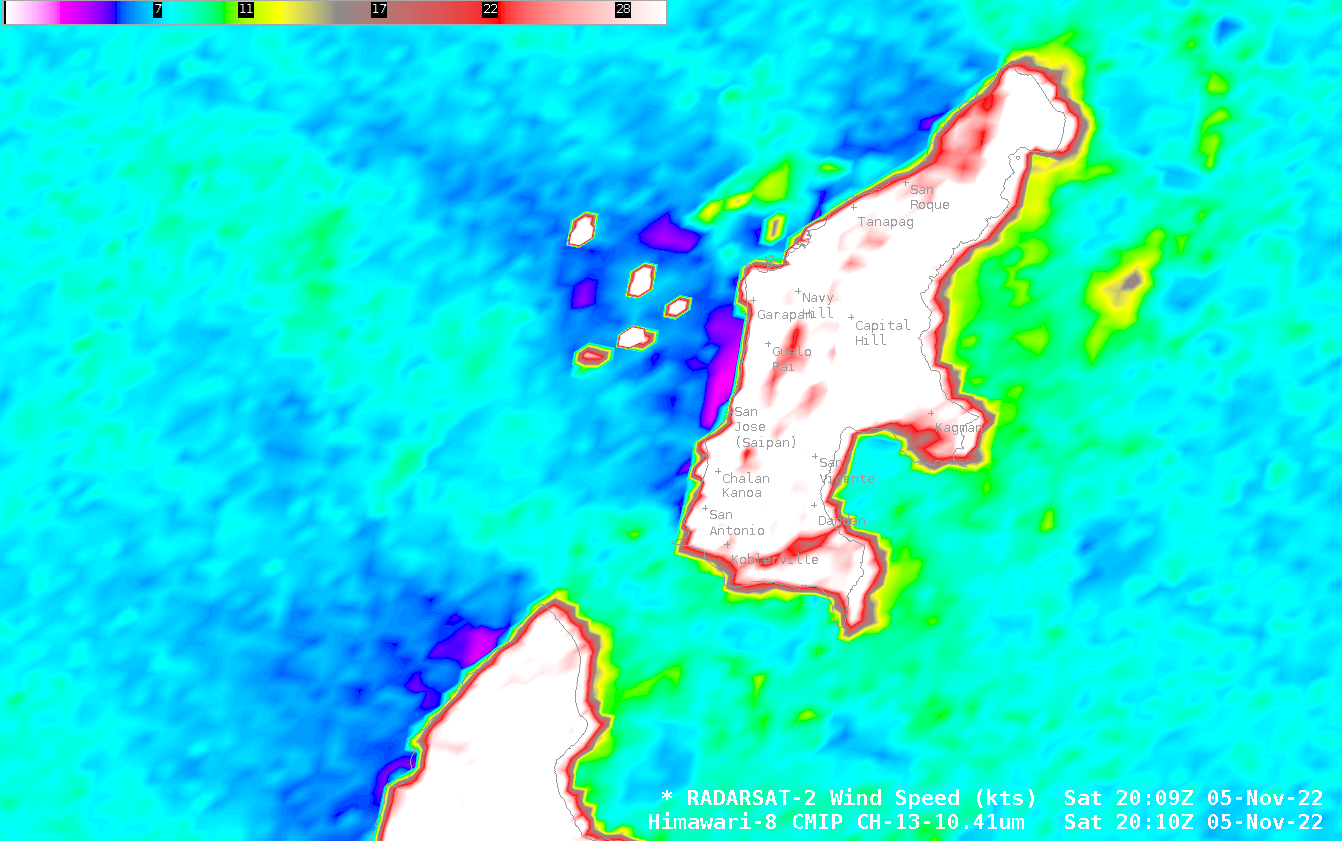
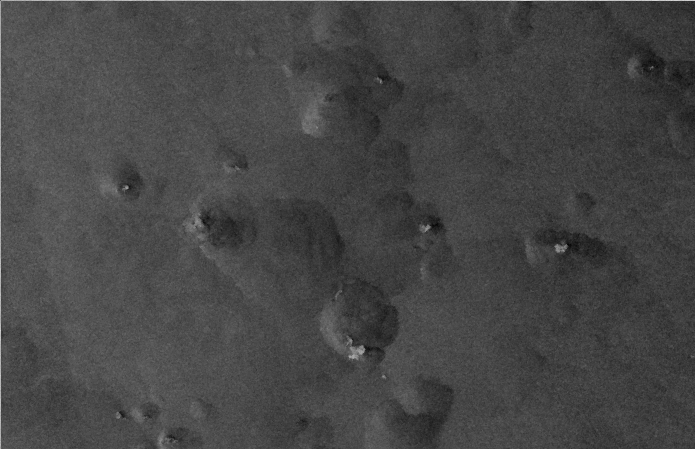
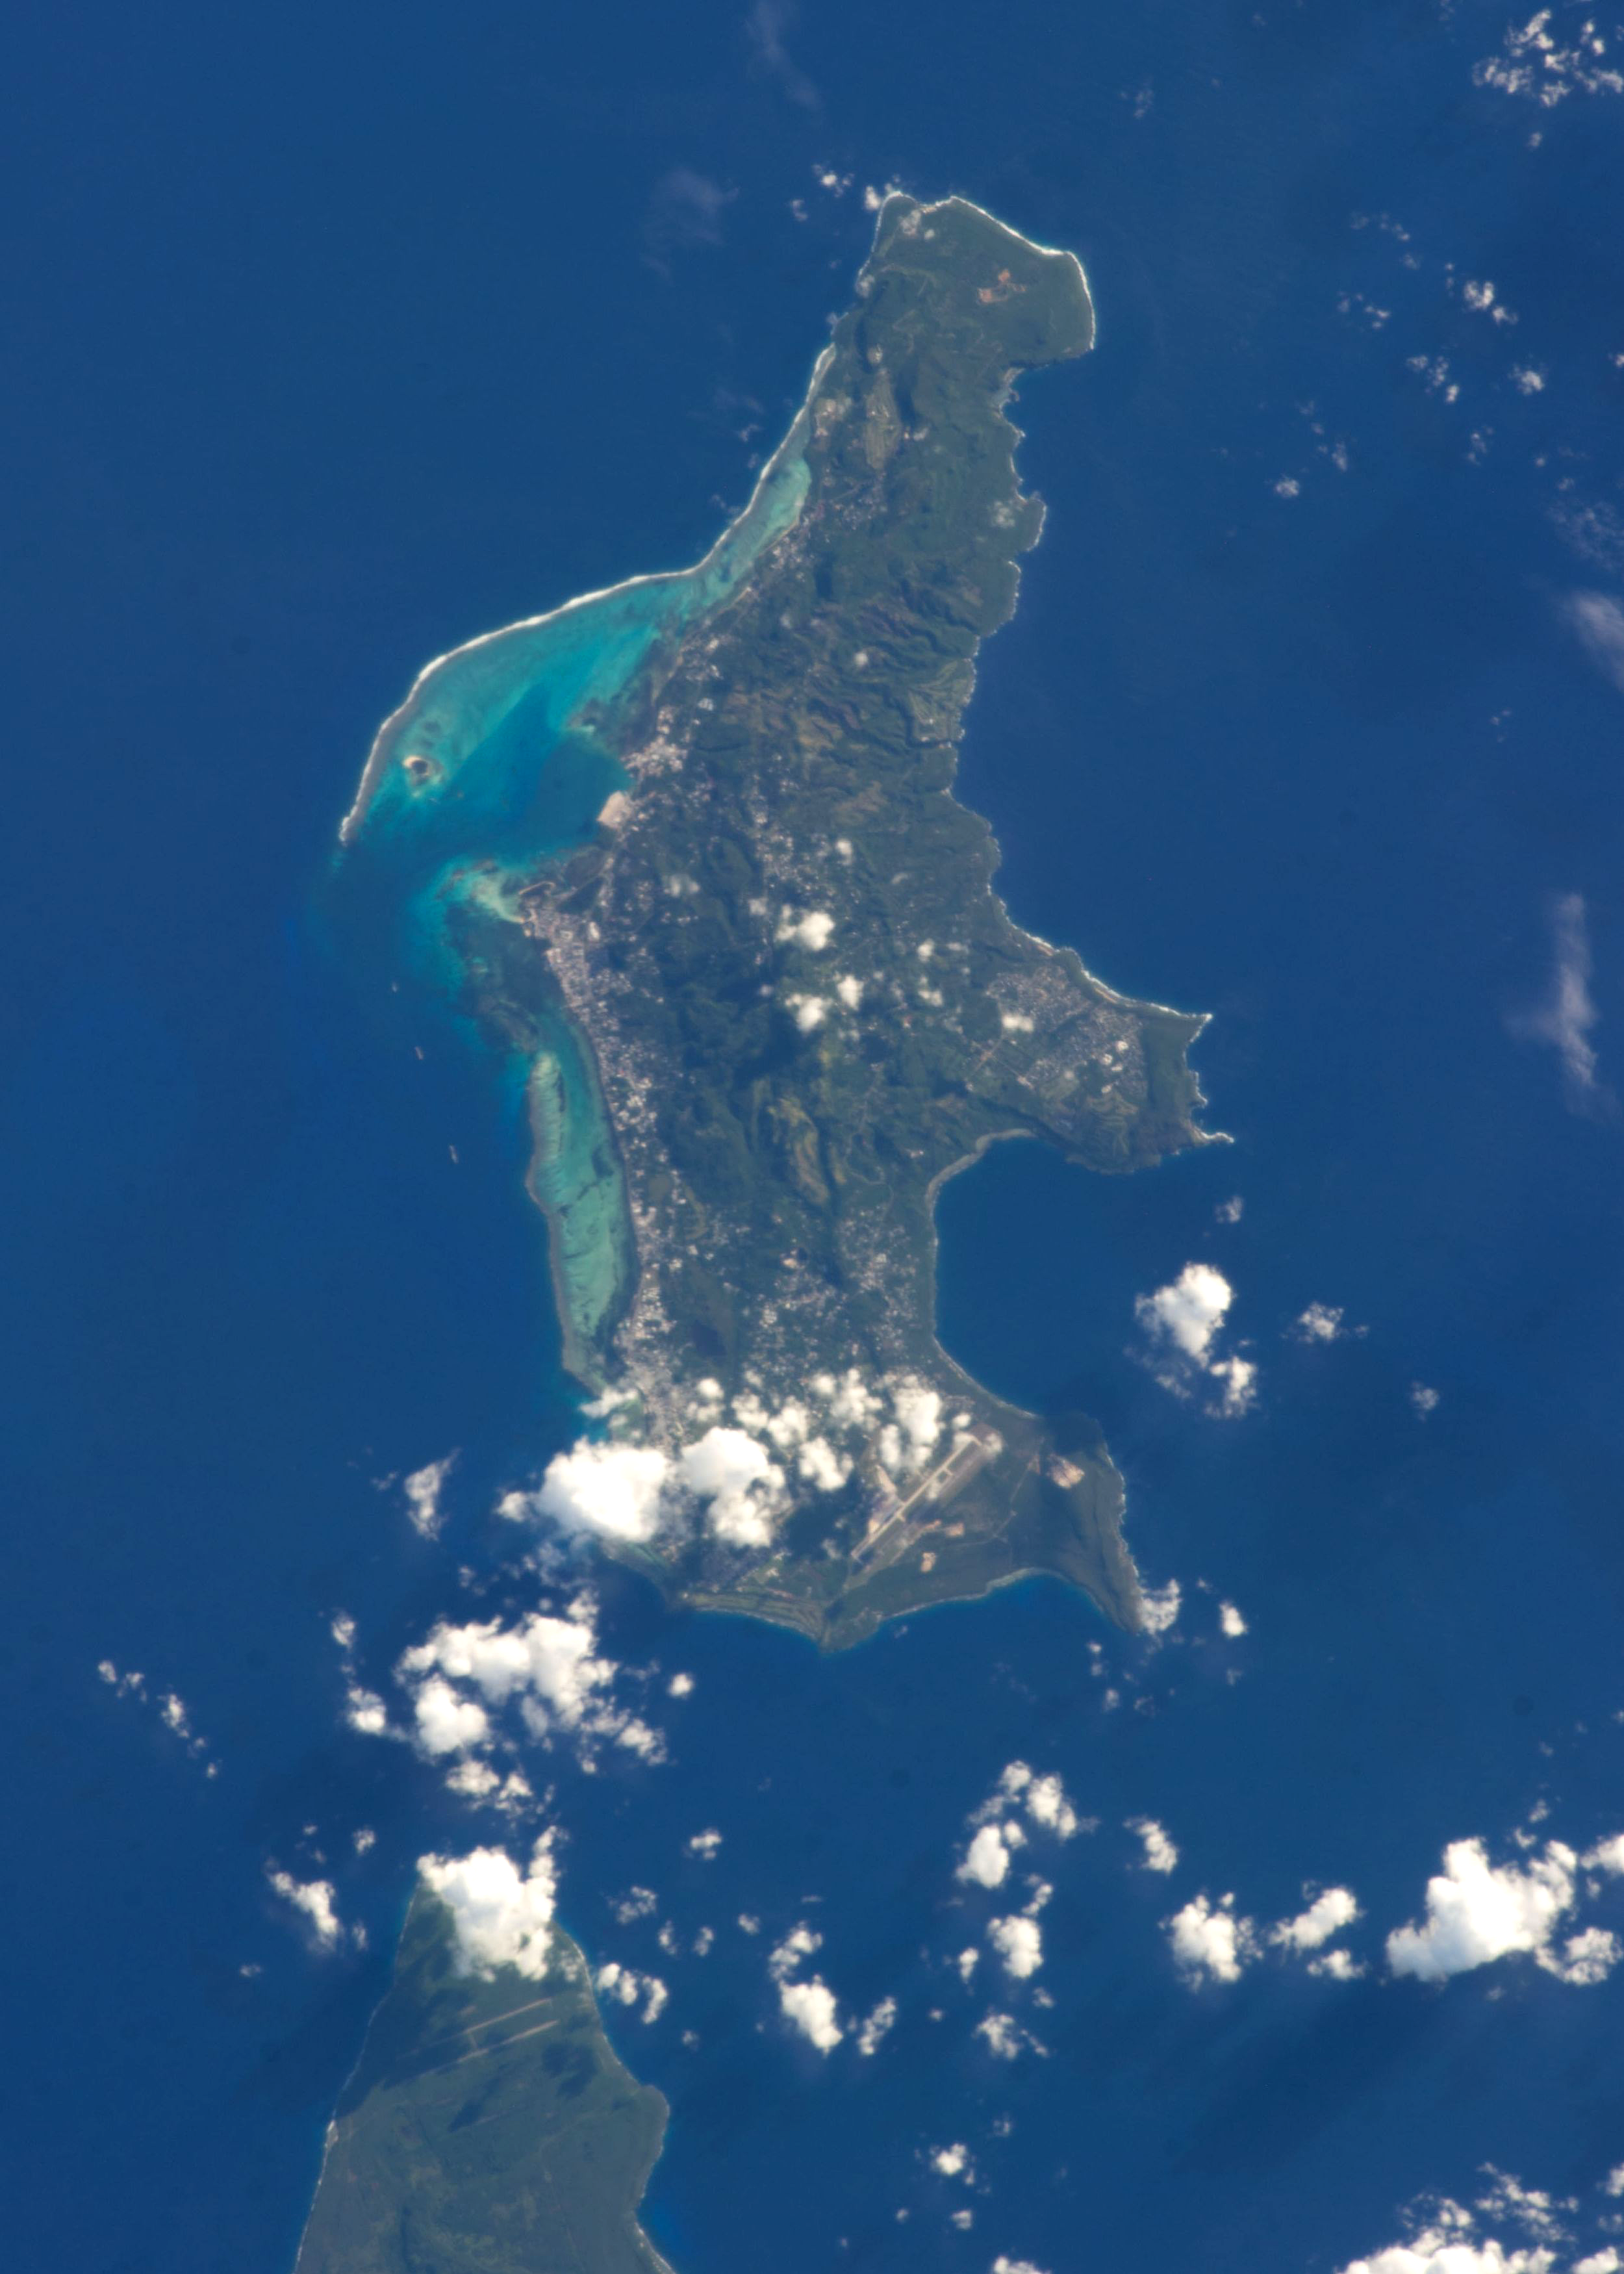
SAR Winds just to the west of the island of Saipan show 5 separate strong maxima in a region where Himawari-8 data show little evidence of cloudiness. This image of Saipan from the International Space Station suggests a possible reason: ships at anchor in Saipan’s harbor! Such ships are highly reflective in C-band frequencies as used on RADARSAT-2.
SAR WInds around Saipan, 2009 UTC on 5 November 2022 (Click to enlarge)
Thanks to Brandon Aydlett, SOO at WFO Guam, for pointing out the artifacts near Saipan!
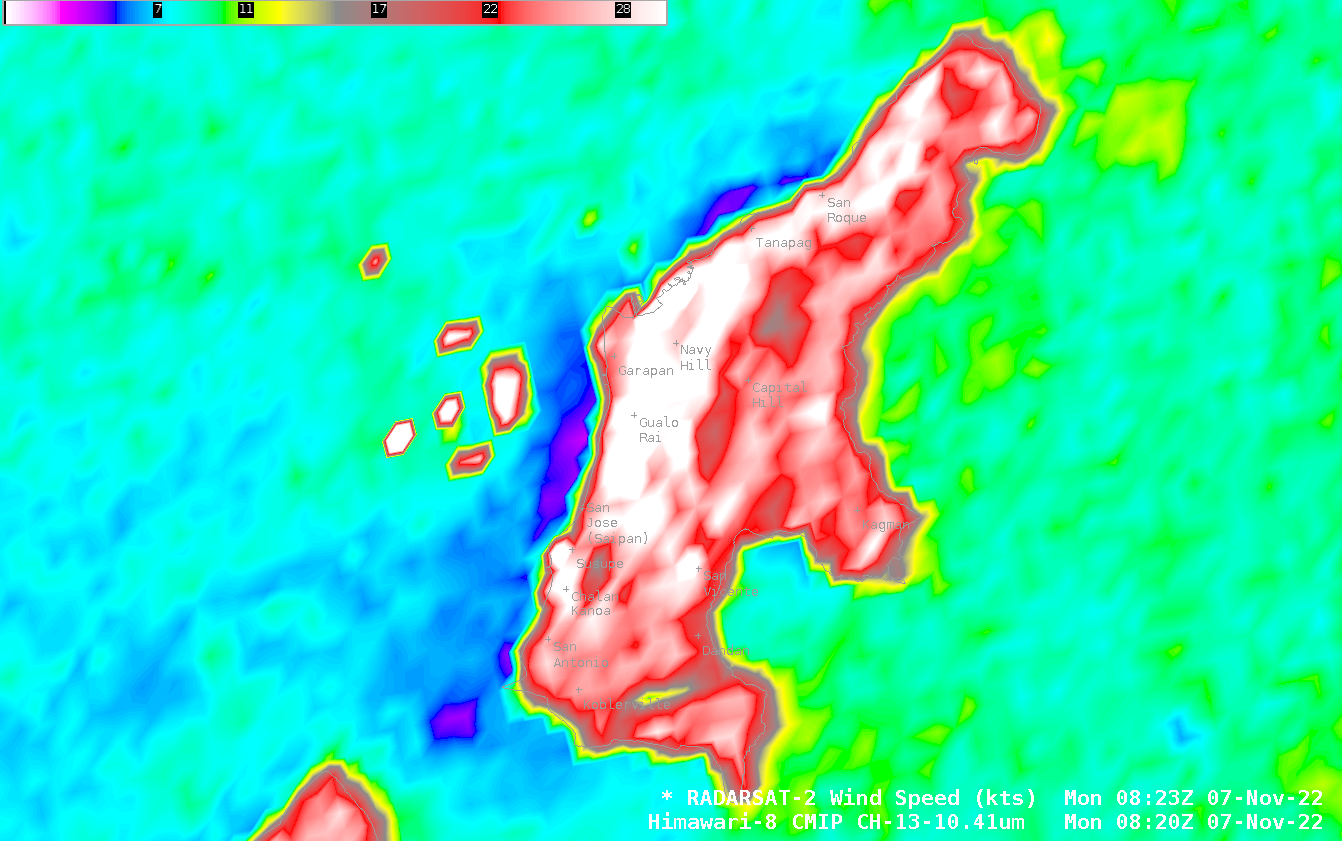
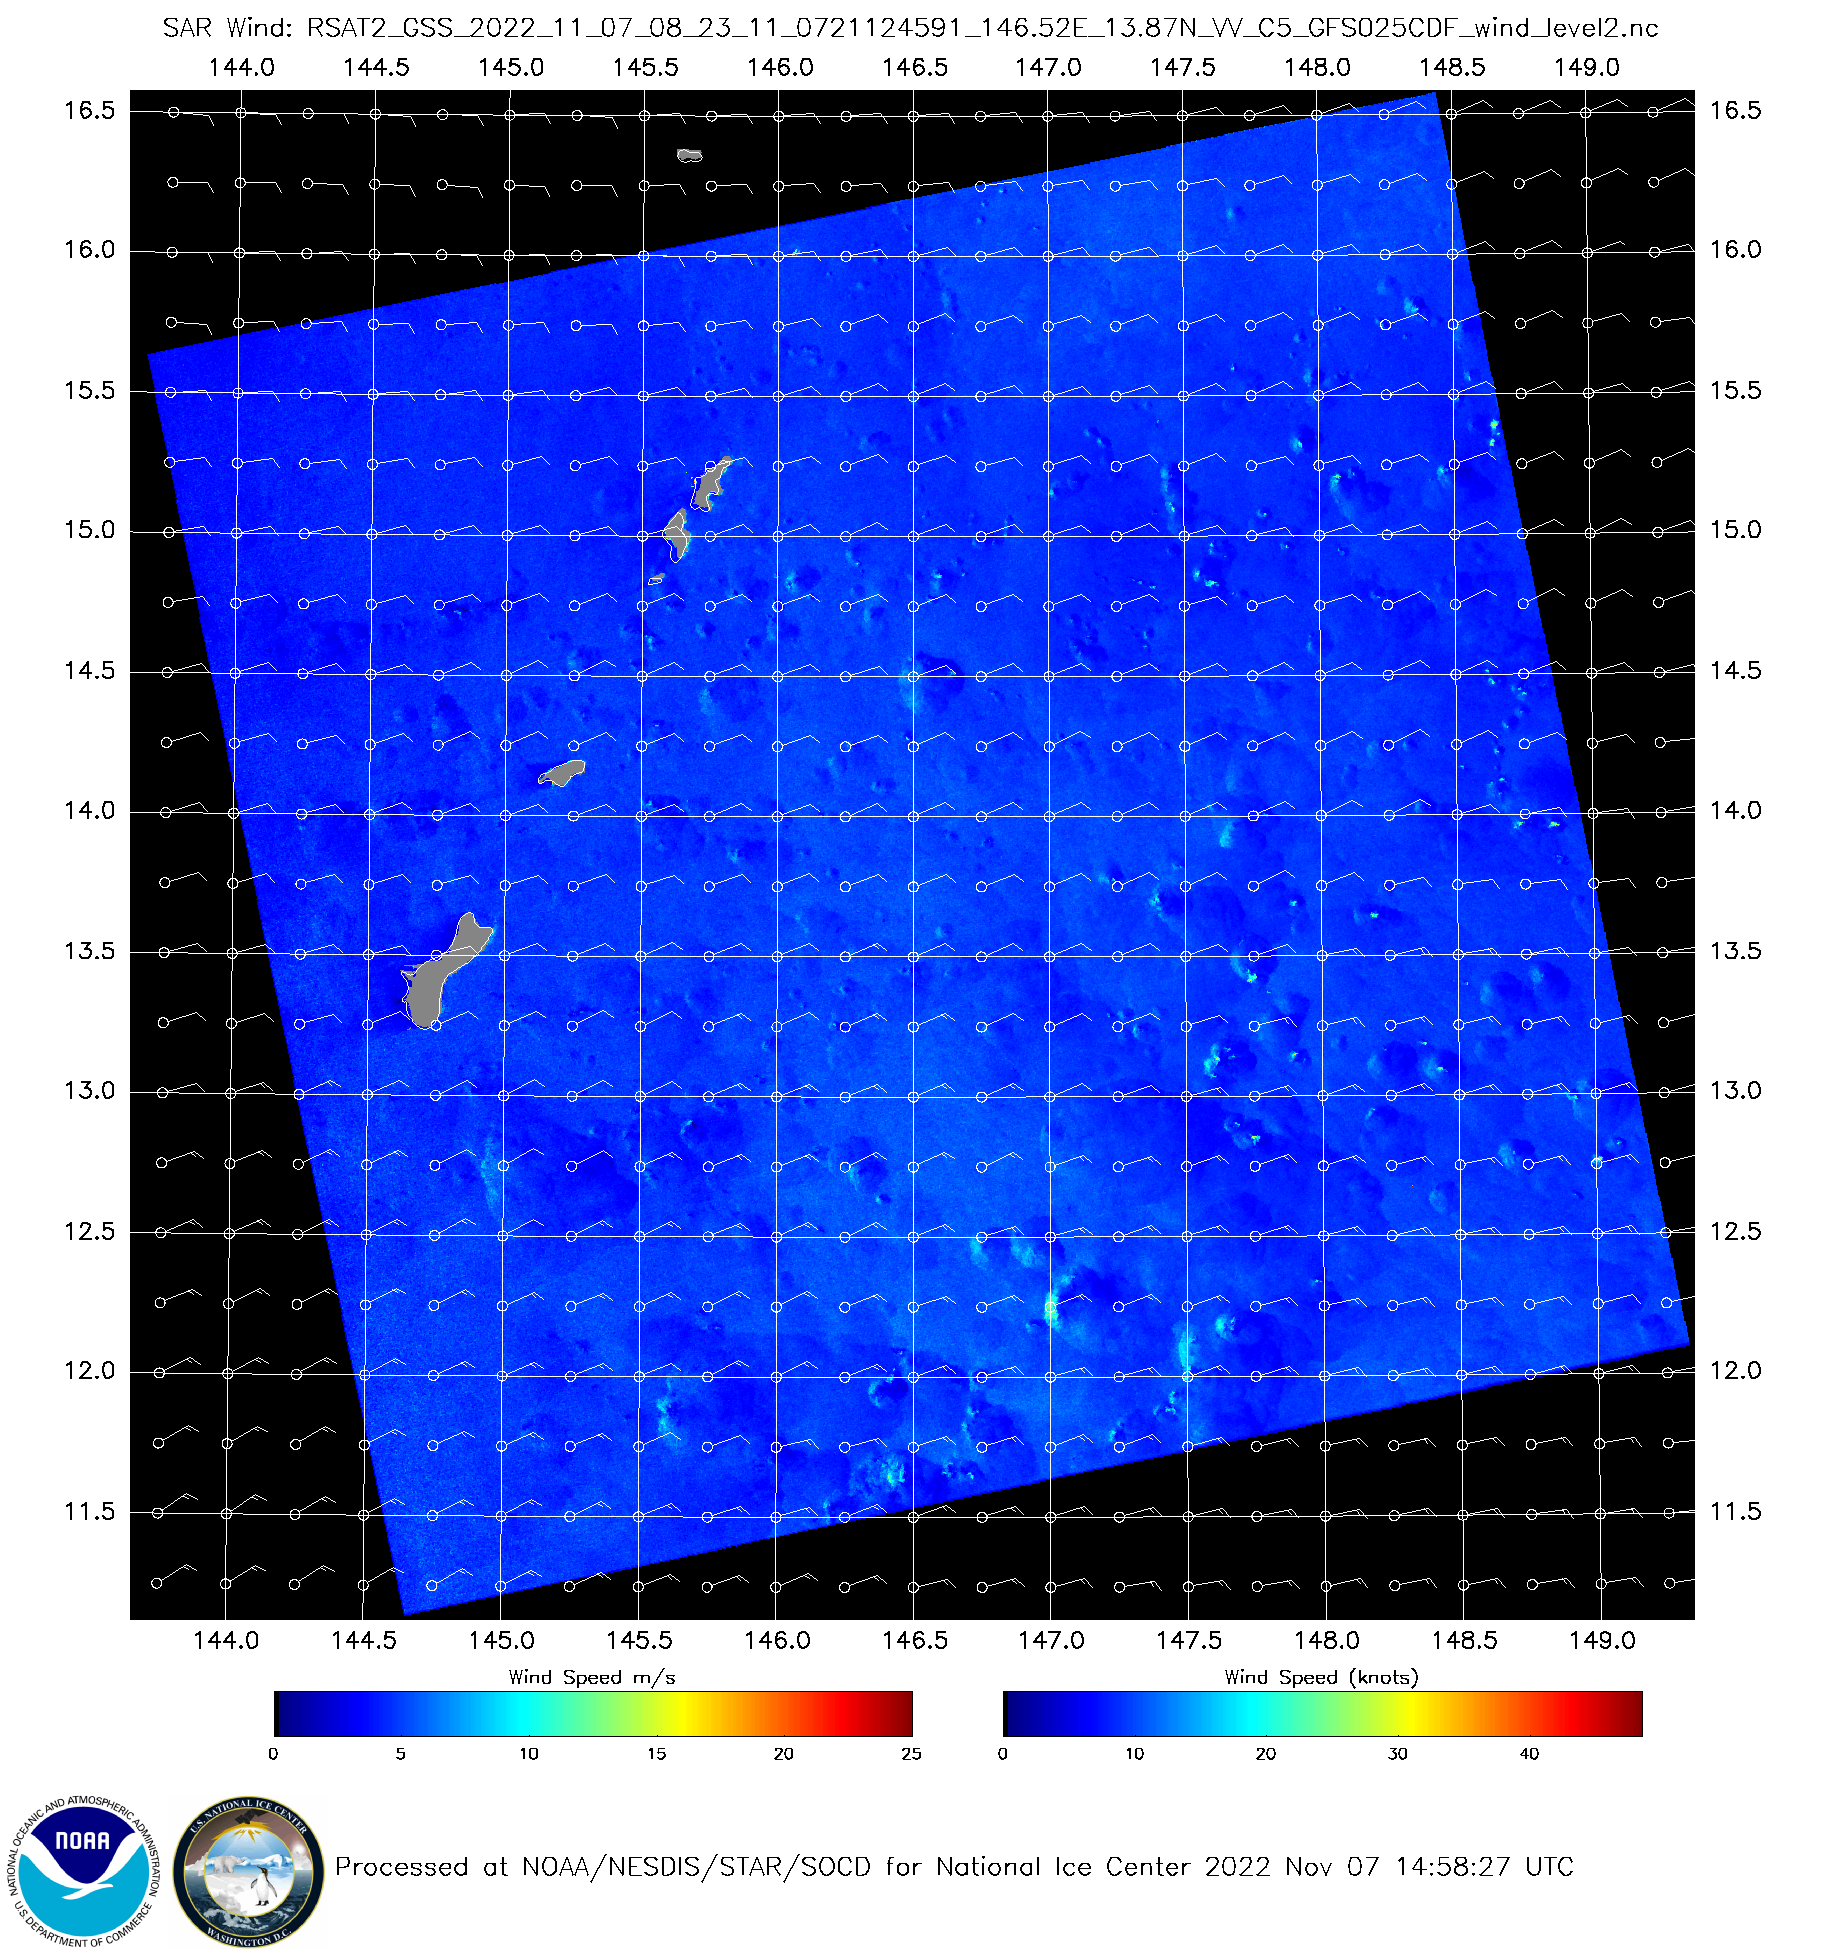
Another RADARSAT-2 pass occurred at 0823 UTC on 7 November. The toggle with Himawari-8 infrared imagery is shown below. Again, weaker winds are shown downwind of the islands (in this case, to the west of the islands as winds have shifted to a more easterly direction; click here to see the wind analysis and the NRCS analysis, both from this website) To the east of Guam are numerous dipoles of strong/weak winds associated with showers.
Himawari-8 Clean Window infrared (Channel 13, 10.4 µm) and SAR Winds, 0820 UTC on 7 November 2022 (Click to enlarge)
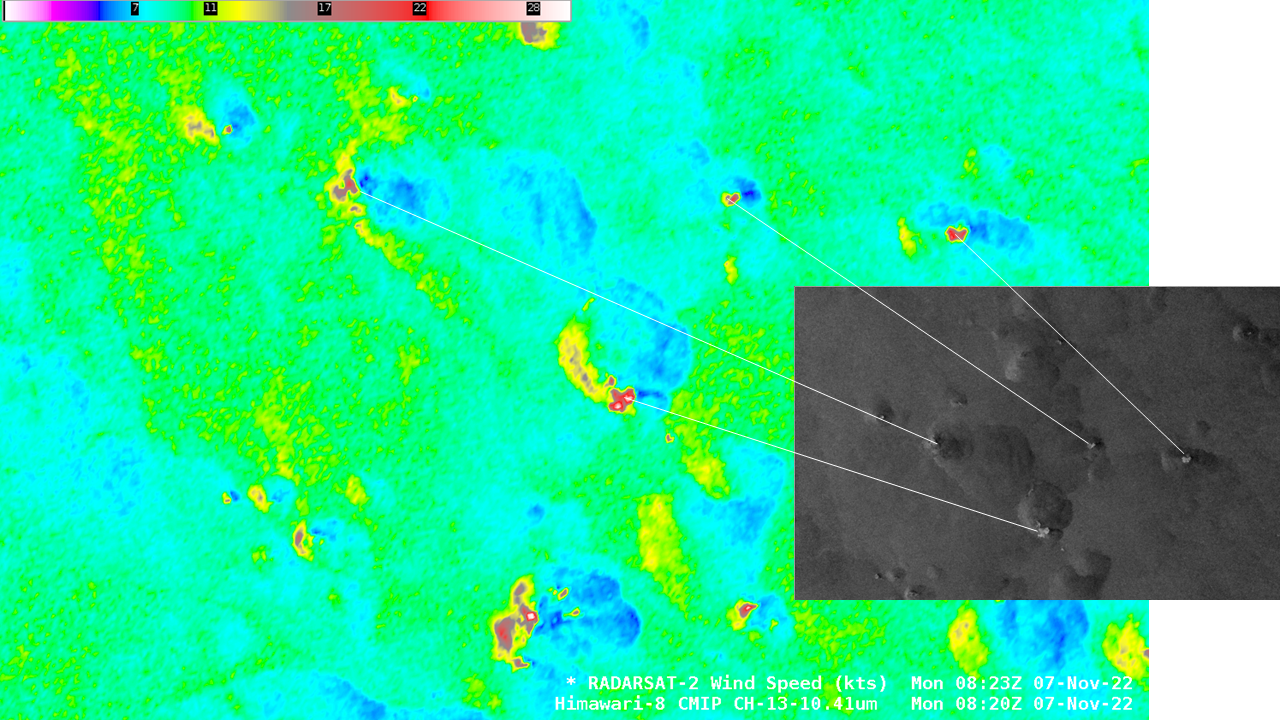
The toggle below zooms in on the shower activity near 13.5oN, 147.75oE, to the east of Guam. Stronger winds (10-15 knots, yellow and brown in the enhancement) are apparent to the east of the cooler clouds that are mostly likely tradewind cumulus showers. The strongest winds, 20+ knots might be associated with ice in clouds. Himawari-8 Band 13 brightness temperatures over the showers are in general not sub-freezing (the exception being the cyan and blue enhancements where brightness temperatures are from -5o to -8o C. The small NRCS image underneath the toggle (snipped from here), however, shows some bright feathered regions that suggest ice is present in small (perhaps smaller than the Himawari-8 infrared resolution) regions within the clouds (this image references NRCS features with the zoomed-in SAR wind image shown below)
Himawari-8 Clean Window infrared (Channel 13, 10.4 µm) and SAR Winds, 0820 UTC on 7 November 2022, centered on 13.5 N, 147.75 E (Click to enlarge)NRCS imagery for a small region centered near 13.5 N, 147.75 E (Click to enlarge)
Note that the very large signals persist just to the west of Saipan — and there’s one more ship, apparently!
SAR WInds around Saipan, 0823 UTC on 7 November 2022 (Click to enlarge)


