This website works best with a newer web browser such as Chrome, Firefox, Safari or Microsoft
Edge. Internet Explorer is not supported by this website.
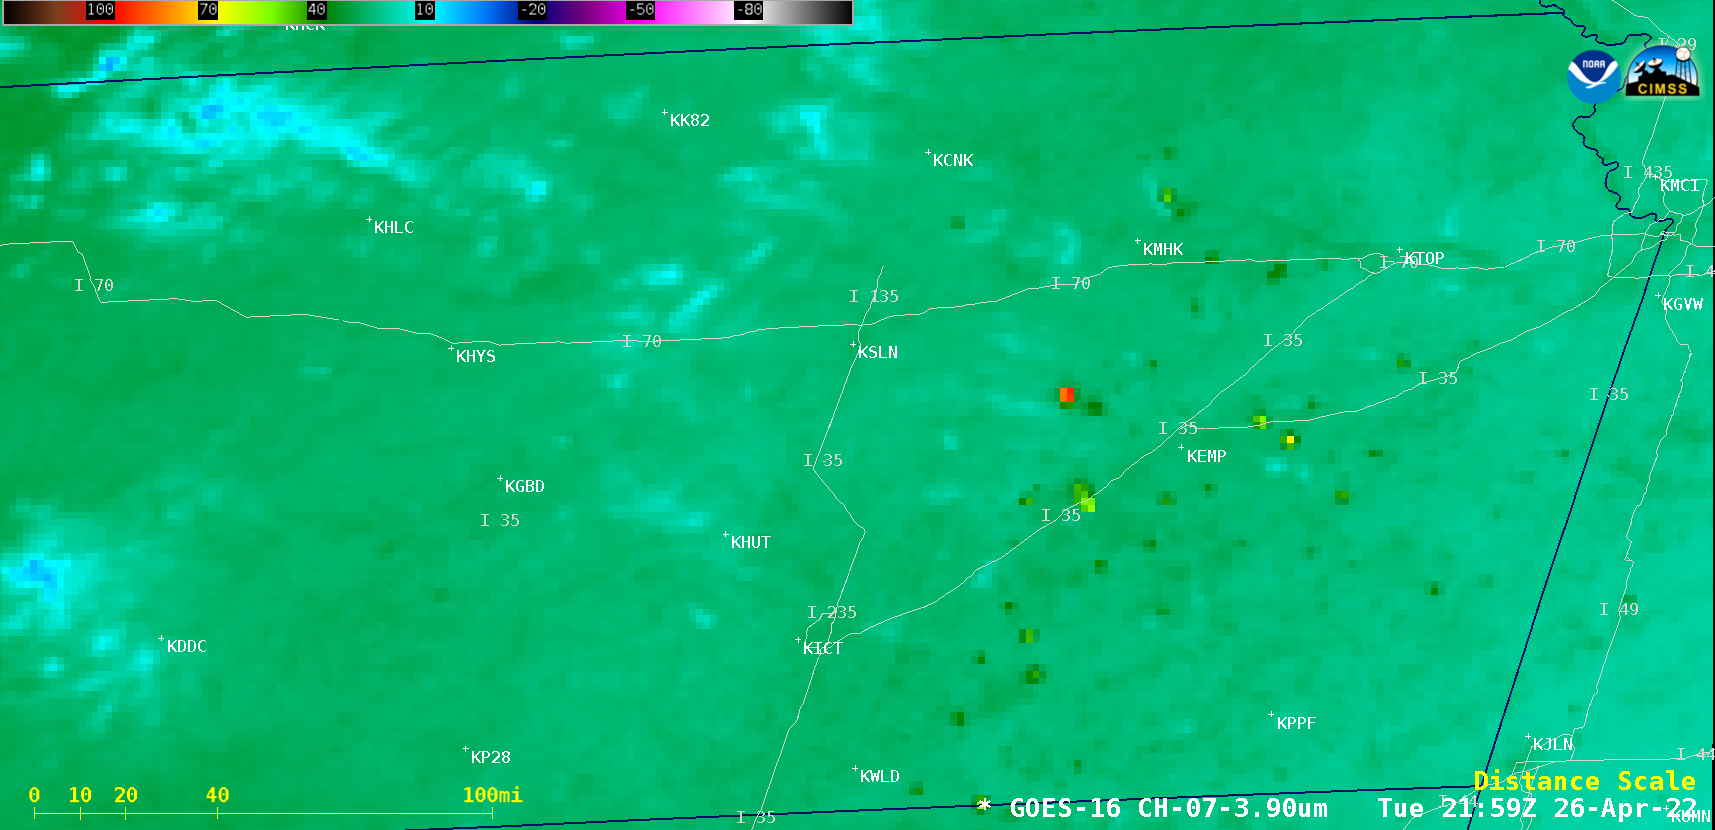
1-minute Mesoscale Domain Sector GOES-16 (GOES-East) Shortwave Infrared (3.9 µm) images (above) showed the thermal signatures of numerous prescribed burns across the Flint Hills of eastern Kansas on 26 April 2022. Although the majority of the fires burned only briefly, some exhibited very rapid increases in their 3.9 µm infrared brightness temperature... Read More
GOES-16 Shortwave Infrared (3.9 µm) images [click to play animated GIF | MP4]
1-minute Mesoscale Domain Sector GOES-16 (GOES-East) Shortwave Infrared (3.9 µm) images (above) showed the thermal signatures of numerous prescribed burns across the Flint Hills of eastern Kansas on 26 April 2022. Although the majority of the fires burned only briefly, some exhibited very rapid increases in their 3.9 µm infrared brightness temperature — for example, the hottest fire went from 30oC to 98oC in 20 minutes, and another fire went from 12oC to 89oC in just 5 minutes.
Such prescribed burns occur every Spring in this region — other examples include April 2019 and April 2010 .
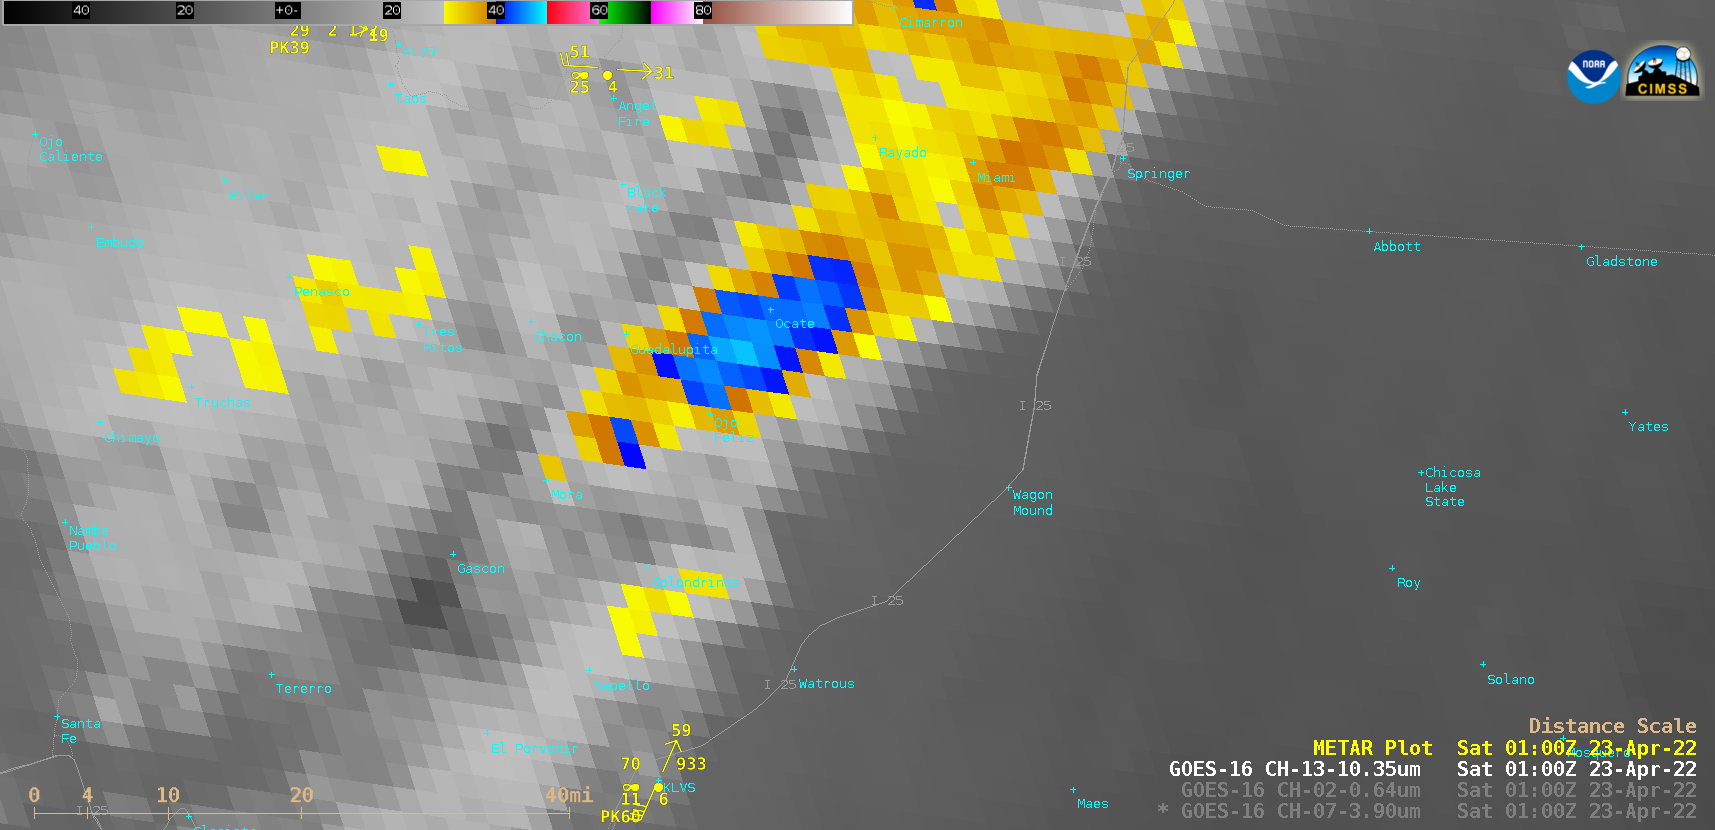
1-minute Mesoscale Domain Sector GOES-16 (GOES-East) Shortwave Infrared (3.9 µm), “Red” Visible (0.64 µm) and “Clean” Infrared Window (10.35 µm) images (above) showed that the Calf Canyon Fire in New Mexico produced a pyrocumulonimbus (pyroCb) cloud on 22 April 2022. This large fire burned very hot, with 3.9 µm Shortwave Infrared brightness temperatures reaching 138.71ºC — the... Read More
GOES-16 Shortwave Infrared (3.9 µm), “Red” Visible (0.64 µm) and “Clean” Infrared Window (10.35 µm) images [click to play animated GIF | MP4]
1-minute Mesoscale Domain Sector GOES-16 (GOES-East) Shortwave Infrared (3.9 µm), “Red” Visible (0.64 µm) and “Clean” Infrared Window (10.35 µm) images (above) showed that the Calf Canyon Fire in New Mexico produced a pyrocumulonimbus (pyroCb) cloud on 22 April 2022. This large fire burned very hot, with 3.9 µm Shortwave Infrared brightness temperatures reaching 138.71ºC — the saturation temperature of ABI Band 7 detectors. Very strong winds contributed to the rapid intensification and spread of this wildfire — the peak wind gust at nearby Las Vegas (KLVS) was 74 mph (NWS Albuqueque PNS).
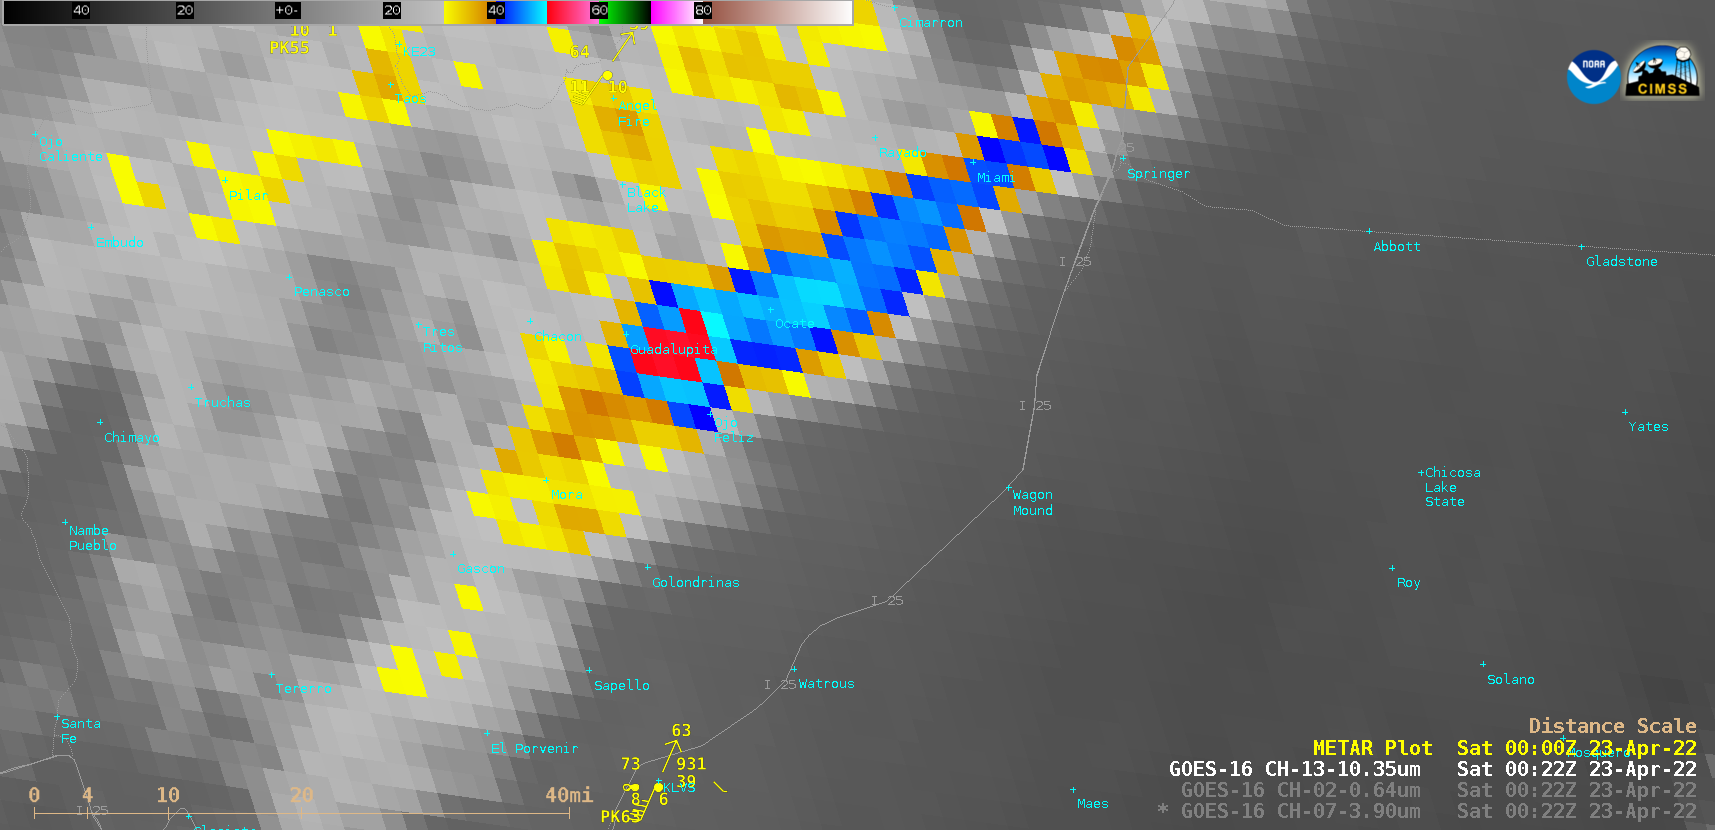
10.35 µm images indicated that the pyrocumulus cloud-top infrared brightness temperatures first reached the -40ºC pyroCb threshold at 2334 UTC (below).
GOES-16 Shortwave Infrared (3.9 µm), “Red” Visible (0.64 µm) and “Clean” Infrared Window (10.35 µm) images at 2334 UTC [click to enlarge]
Cloud-top infrared brightness temperatures subsequently cooled to a minimum of -53ºC around 0022 UTC — which corresponded to an altitude of around 11.7 km according to rawinsonde data from Albuquerque (below).
Plot of 00 UTC rawinsonde data from Albuquerque, New Mexico [click to enlarge]
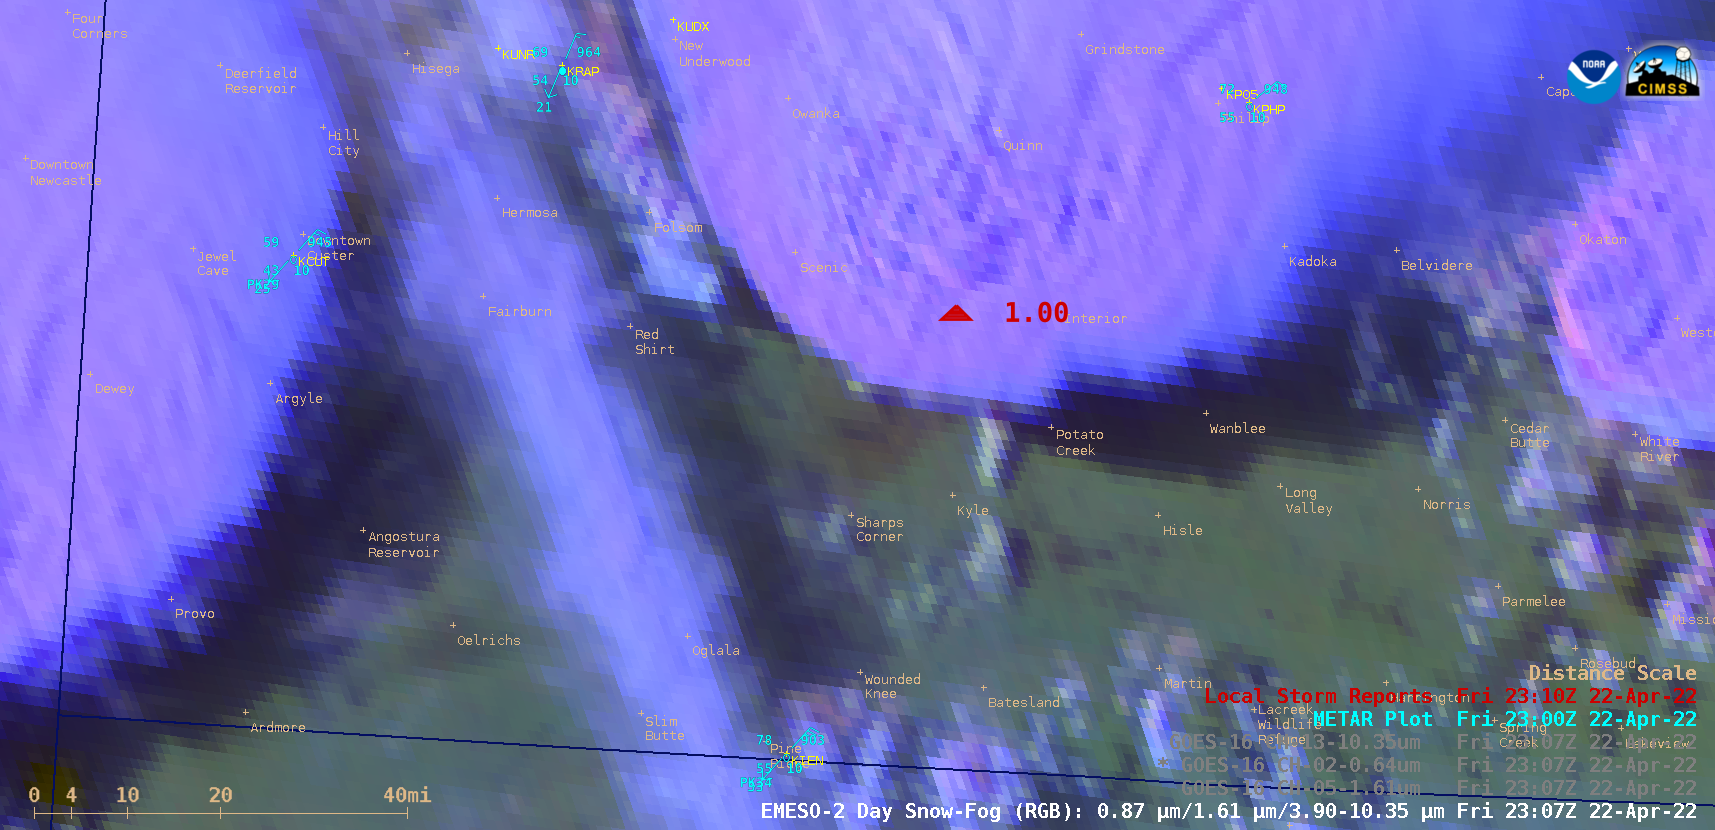
1-minute Mesoscale Domain Sector GOES-16 (GOES-East) Day Snow-Fog RGB and Near-Infrared “Snow/Ice” (1.61 µm) images (above) showed subtle signatures of a swath of hail covering the ground (initial storm report) — shades of red in the RGB images. and darker shades of gray in the 1.61 µm images — in the wake of a severe... Read More
GOES-16 Day Snow-Fog RGB and Near-Infrared “Snow/Ice” (1.61 µm) images, with time-matched Local Storm Reports of hail plotted in red [click to play animated GIF | MP4]
1-minute Mesoscale Domain Sector GOES-16 (GOES-East)Day Snow-Fog RGB and Near-Infrared “Snow/Ice” (1.61 µm) images (above) showed subtle signatures of a swath of hail covering the ground (initial storm report) — shades of red in the RGB images. and darker shades of gray in the 1.61 µm images — in the wake of a severe thunderstorm that was moving northeastward across western South Dakota late in the day on 22 April 2022. The combination of fading daylight and high clouds (and their shadows) passing overhead restricted the amount of time that this hail swath signature could be seen.
A slightly modified version of the Day Snow-Fog RGB — created using Geo2Grid — provided more contrast, making the hail swath a bit easier to see (below).
GOES-16 Day Snow-Fog RGB images [click to play animated GIF | MP4]
The corresponding 1-minute GOES-16 “Red” Visible (0.64 µm) and “Clean” Infrared Window (10.35 µm) images (below) revealed that this severe thunderstorm exhibited a prominent Above-Anvil Cirrus Plume (reference | VISIT training).
GOES-16 “Red” Visible (0.64 µm) and “Clean” Infrared Window (10.35 µm) images, with time-matched Local Storm Reports of hail plotted in red [click to play animated GIF | MP4]
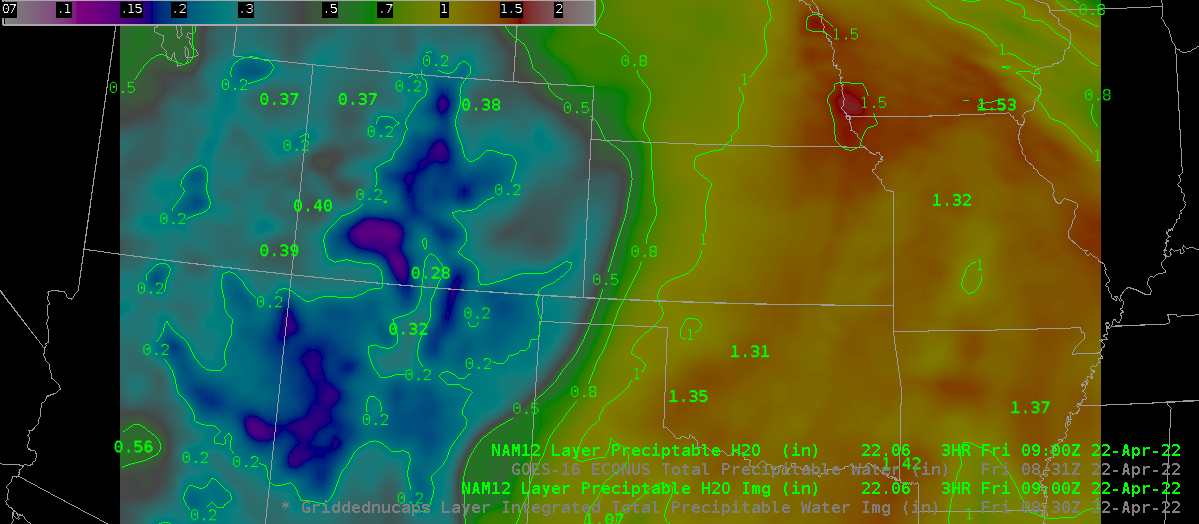
A dryline over the United States High Plains will serve as a focus for convective development later in the day on 22 April. (Click here for the 1300 UTC Convective Outlook). What tools are available to view gradients of Total Precipitable Water, and how do they compare? The toggle above... Read More
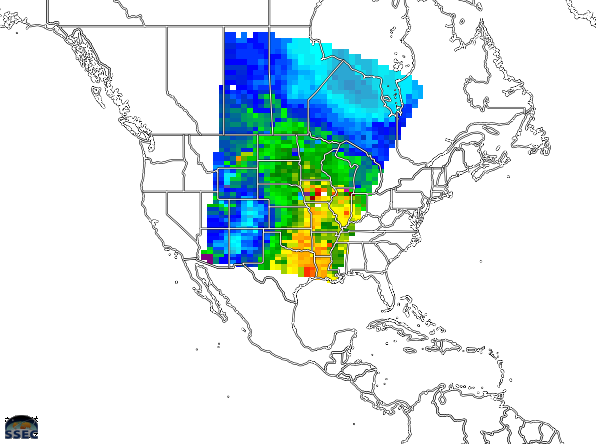
NUCAPS Estimates and GOES-16 Estimates of Total Precipitable Water, ca. 0830 UTC on 22 April 2022 (Click to enlarge)
A dryline over the United States High Plains will serve as a focus for convective development later in the day on 22 April. (Click here for the 1300 UTC Convective Outlook). What tools are available to view gradients of Total Precipitable Water, and how do they compare? The toggle above compares Gridded NUCAPS fields of TPW and roughly coincident GOES-16 derived Total Precipitable Water. (TPW can be viewed online here). A zoomed-in version of the image above is shown below (including an image showing NUCAPS Sounding Availability points). Note that NUCAPS gives values in regions of clouds. GOES-R has a higher spatial resolution. A user might use both to take advantage of the strengths of both sensors.
NUCAPS Estimates and GOES-16 Estimates of Total Precipitable Water, ca. 0830 UTC on 22 April 2022 (Click to enlarge)
Of course, a benefit of GOES-R over NUCAPS values is that GOES-R estimates can animate. The 2-hour animation below shows a relatively stationary gradient over the High Plains from Texas northward through Kansas.
GOES-16 TPW, 0801- 1001 UTC on 22 April 2022 (Click to enlarge)
SPC Mesoanalyses at 0800 and 1000 UTC, below, similarly show a relatively stationary gradient. Perhaps the strength of the gradient is different in the analysis below compared to the satellite-based esimates above, but the different enhancements and map projections makes it difficult to make a direct comparison!
SPC Mesoanalysis of Total Precipitable Water, 0800 and 1000 UTC on 22 April 2022 (Click to enlarge)
The NAM-12 image of TPW below also shows a tight gradient over the High Plains.
NAM-12 analysis of Total Precipitable water at 0900 UTC, 22 April 2022 (Click to enlarge)
RealEarth display of gridded NUCAPS estimates of Total Precipitable Water, 0828 UTC on 22 April 2022 (Click to enlarge)GOES-16 Total Precipitable Water and Split Window DIfference, 1716 UTC on 22 April 2022 (click to enlarge)
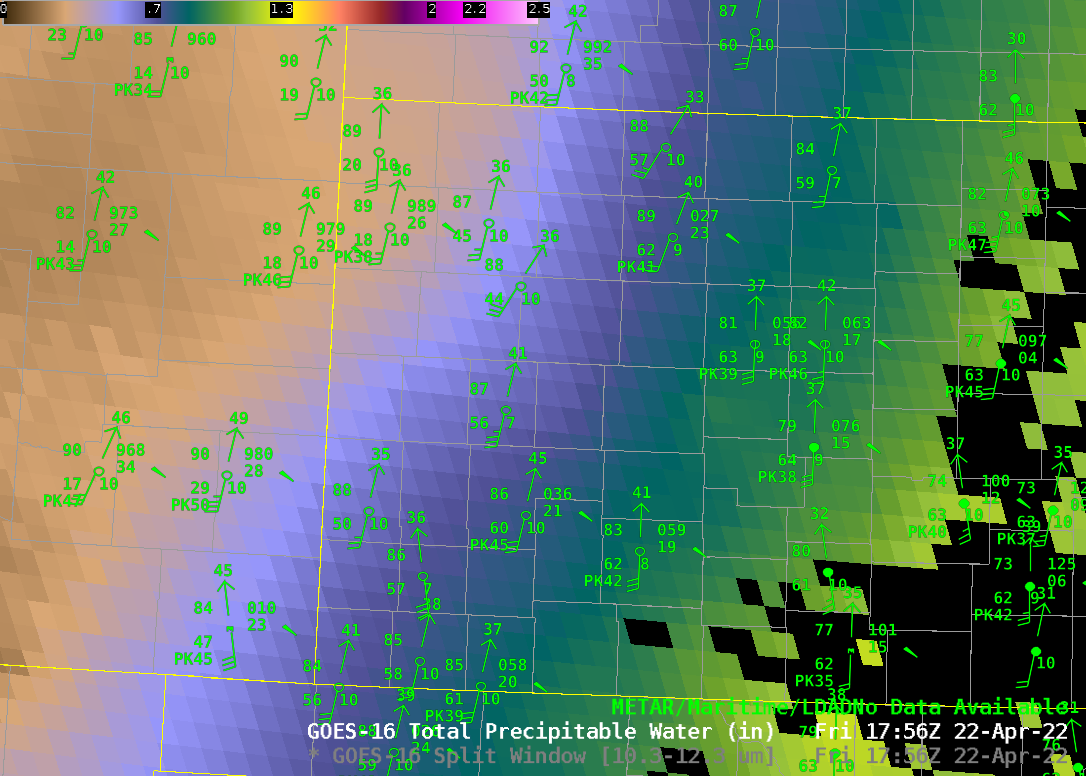
The GOES-16 Total Precipitable Water at 1716 UTC, above, is a bit less concentrated over western Kansas. The image is also toggling with the Split Window Difference (10.3 µm- 12.3 µm) enhanced such that dark regions have more moisture. No appreciable gradient in moisture that might focus convection is apparent. (The 1630 UTC Convective Outlook has not appreciably changed from 1300 UTC). Note below how well the surface dewpoint gradients and TPW gradient match!
GOES-16 TPW and Surface METAR reports, 1756 UTC on 22 April 2022 (Click to enlarge)
Continue to monitor the evolving moisture distribution using the resources above as the afternoon progresses.


