Fires in the Plains
![GOES-16 Shortwave Infrared (3.9 µm) and Fire Temperature product [click to play animation | MP4]](https://cimss.ssec.wisc.edu/satellite-blog/wp-content/uploads/sites/5/2019/04/190408_goes16_shortwaveInfrared_fireTemperature_Plains_fires_anim.gif)
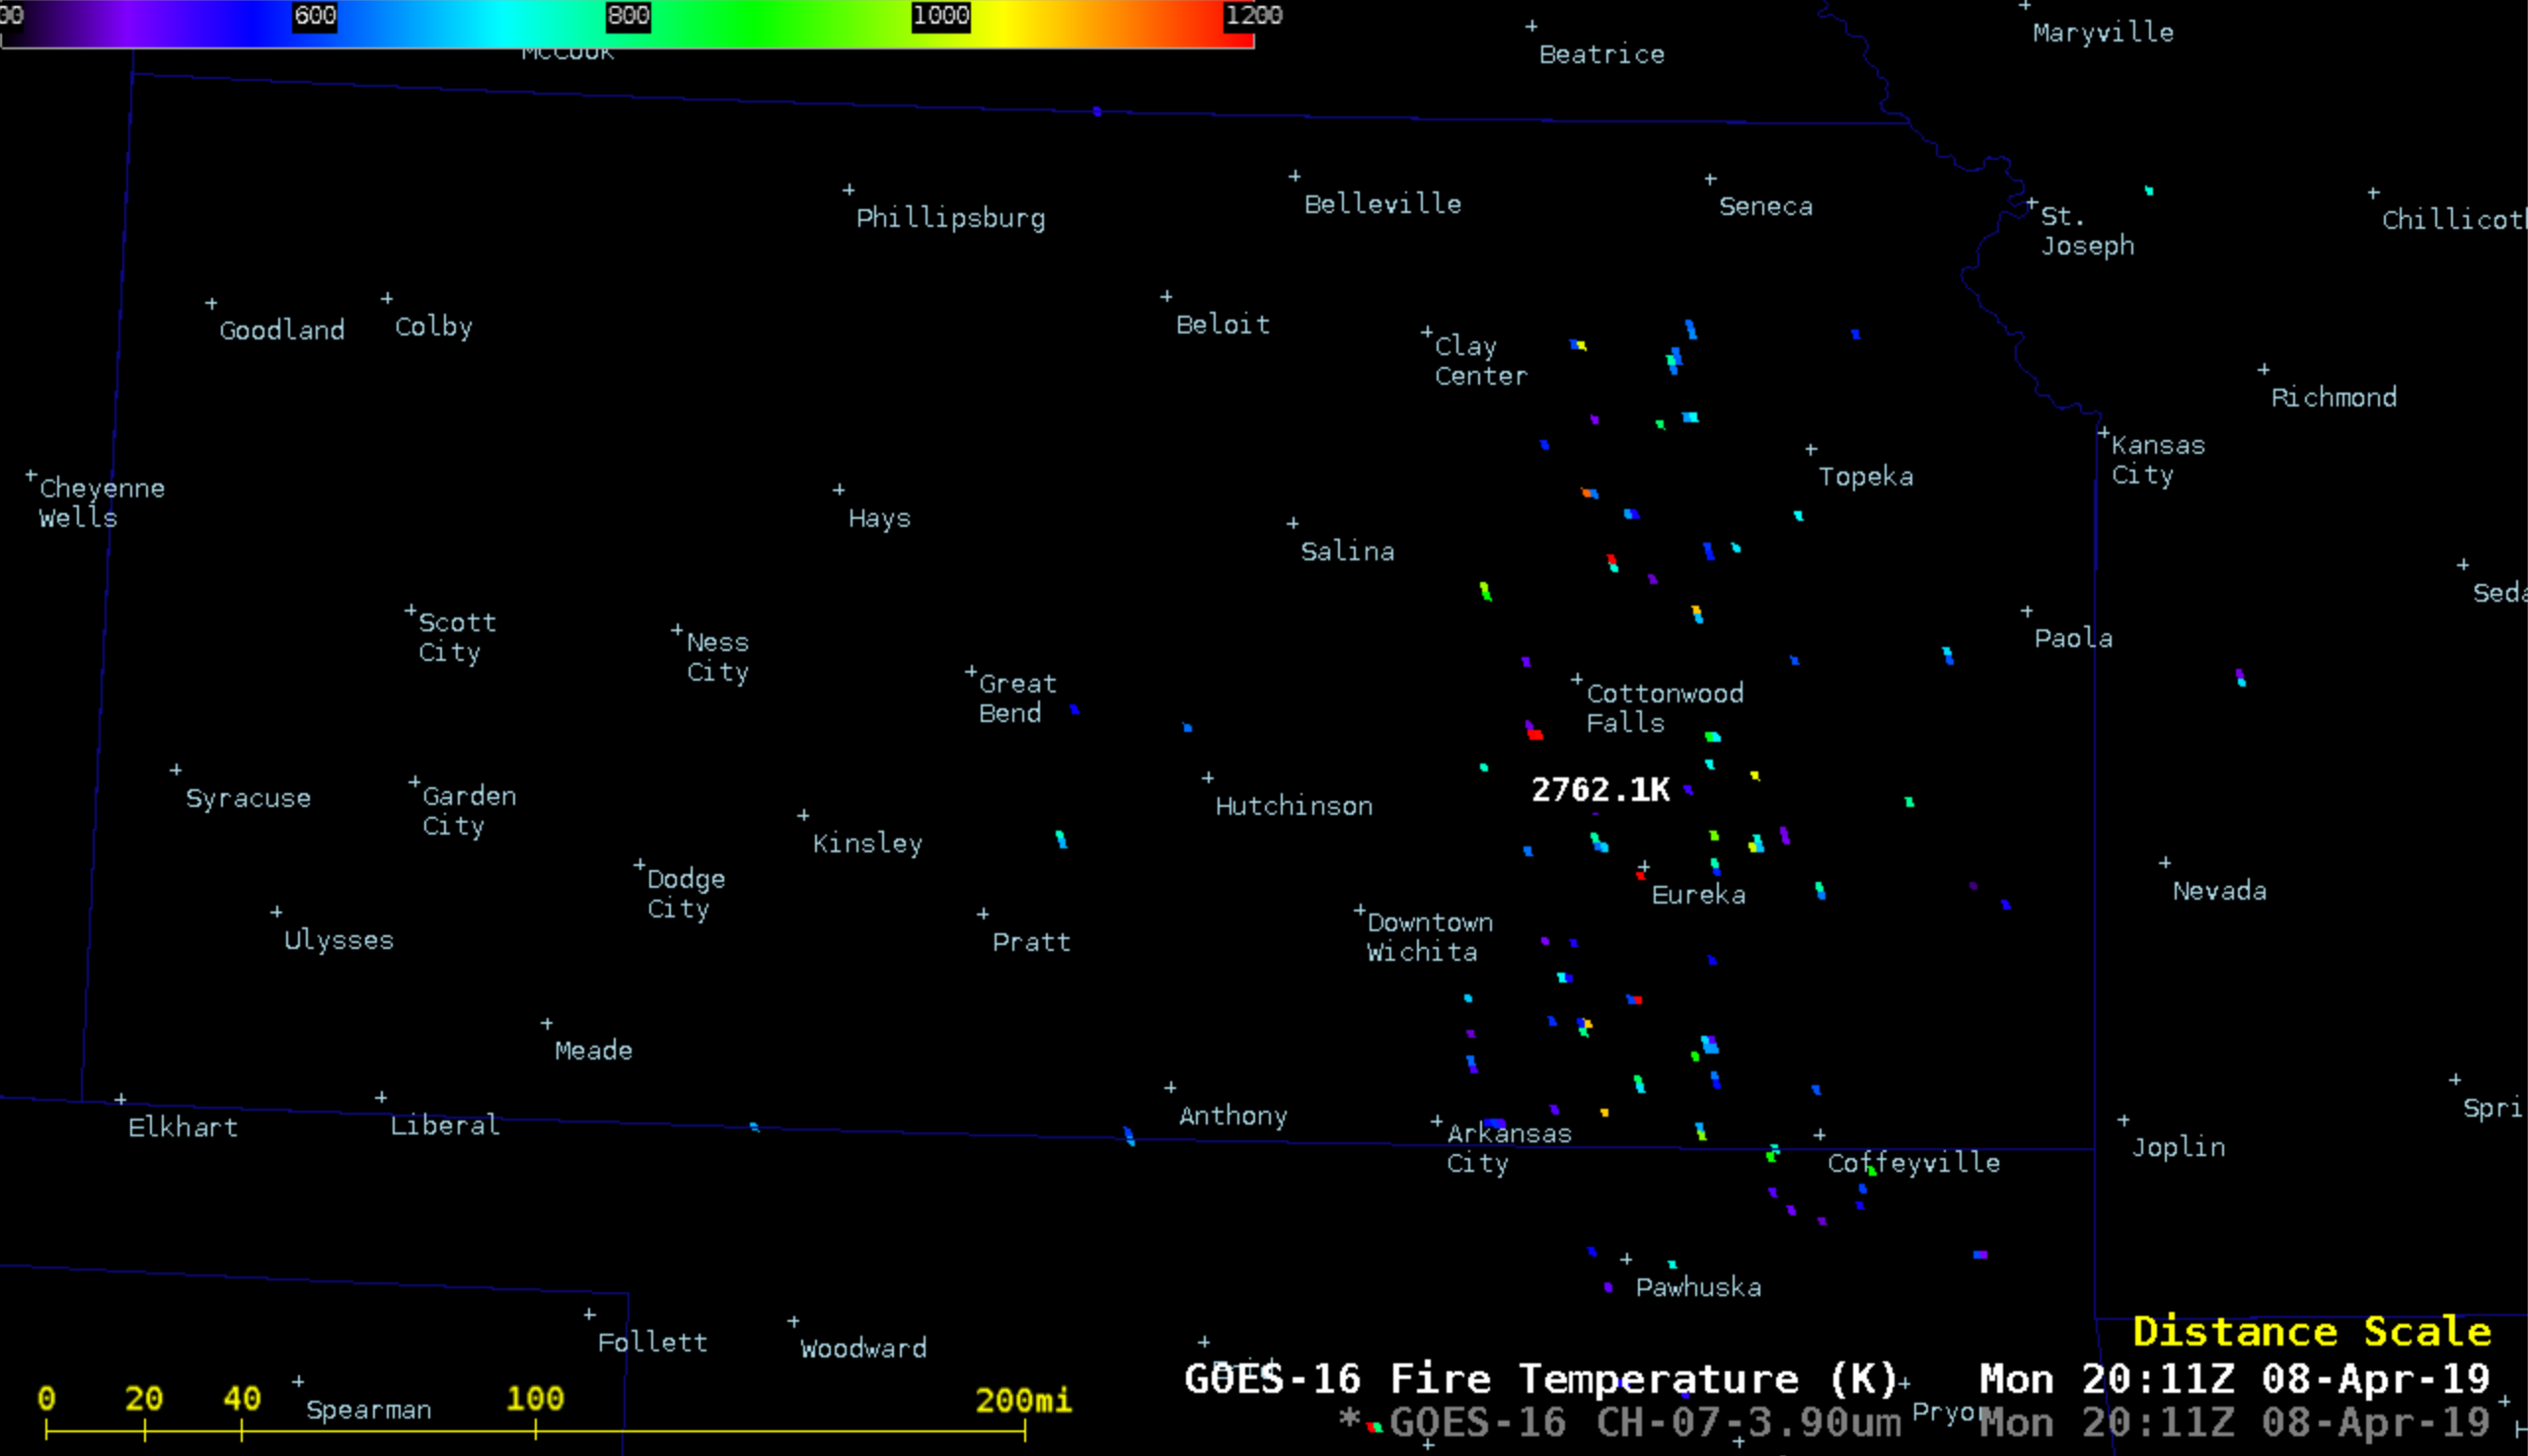
GOES-16 Shortwave Infrared (3.9 µm) and Fire Temperature product [click to play animation | MP4]
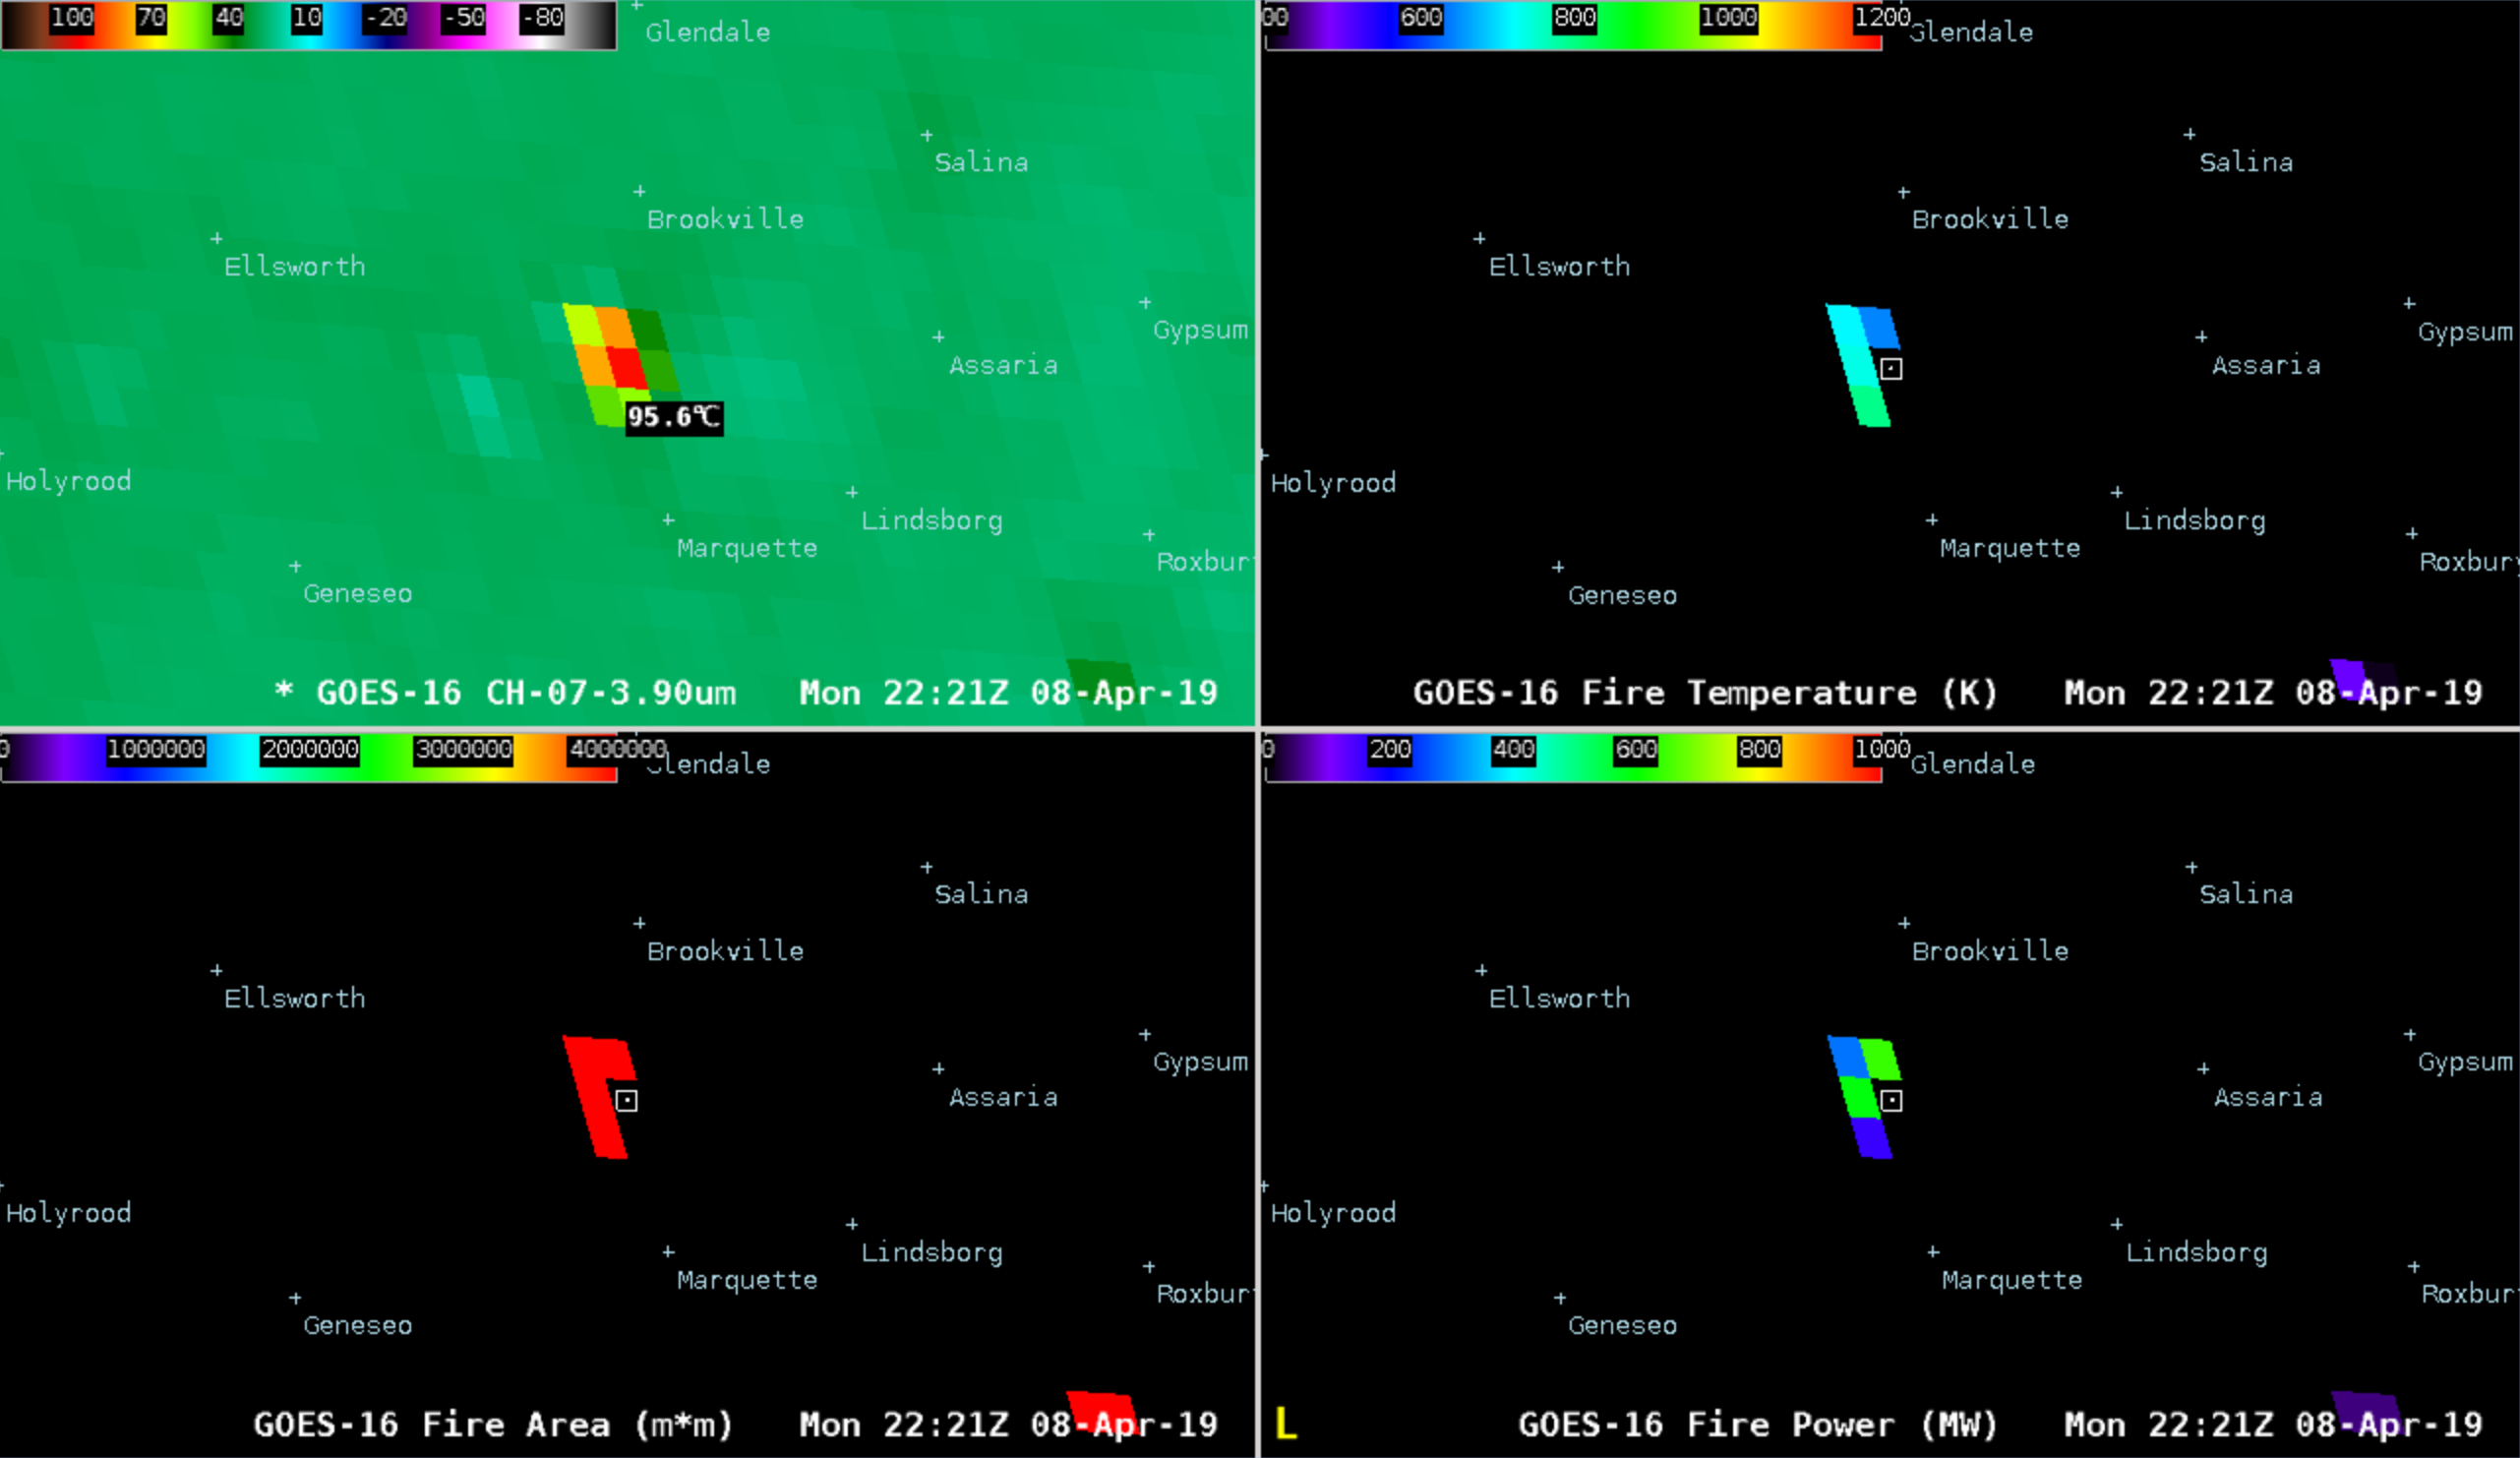
One fire southwest of Salina, Kansas began to exhibit a prominent 3.9 µm thermal anomaly after 22 UTC, attaining a peak infrared brightness temperature of 95.6ºC (or 204ºF); a closer view of that fire is shown using GOES-16 Shortwave Infrared images along with Fire Temperature, Fire Area and Fire Power products (below). Note that during much of the time (for example, at 2221 UTC) there were no Fire Temperature, Fire Area or Fire Power values processed for the hottest 3.9 µm fire pixel — this is because the fire was producing a thick smoke plume, and the smoke-filled (on Visible imagery) hot pixel was flagged by the GOES Fire Detection and Characterization Algorithm (FDCA) Cloud Mask as a “cloudy pixel”. Beginning in May 2019, an updated algorithm will begin to produce the Fire Power parameter for all types of fire pixel (Processed fire, Saturated fire, Cloud-contaminated fire, and High/Medium/Low-probability fires), but the Fire Temperature and Fire Size parameters will only be available for the Processed fire category.
![GOES-16 Shortwave Infrared (3.9 µm, upper left), Fire Temperature (upper right), Fire Area (lower left) and Fire Power (lower right) [click to play animation | MP4]](https://cimss.ssec.wisc.edu/satellite-blog/wp-content/uploads/sites/5/2019/04/190408_goes16_shortwaveInfrared_fdca_Plains_fires_anim.gif)
GOES-16 Shortwave Infrared (3.9 µm, upper left), Fire Temperature (upper right), Fire Area (lower left) and Fire Power (lower right) [click to play animation | MP4]
![Sequence of MODIS and VIIRS Shortwave Infrared (3.7 µm) images from 1822-2001 UTC [click to enlarge]](https://cimss.ssec.wisc.edu/satellite-blog/wp-content/uploads/sites/5/2019/04/190408_modis_viirs_shortwaveInfrared_Plains_fires_anim.gif)
Sequence of MODIS and VIIRS Shortwave Infrared (3.7 µm) images from 1822-2001 UTC [click to enlarge]
![GOES-16 "Red" Visible (0.64 µm) images [click to play animation | MP4]](https://cimss.ssec.wisc.edu/satellite-blog/wp-content/uploads/sites/5/2019/04/190408_goes16_visible_Plains_fires_anim.gif)
GOES-16 “Red” Visible (0.64 µm) images [click to play animation | MP4]
===== 09 April Update ====
![NOAA-20 VIIRS Day/Night Band (0.7 µm) and Shortwave Infrared (3.74 µm) images [click to enlarge]](https://cimss.ssec.wisc.edu/satellite-blog/wp-content/uploads/sites/5/2019/04/190409_noaa20_viirs_shortwaveInfrared_dayNightBand_KS_fires_anim.gif)
NOAA-20 VIIRS Day/Night Band (0.7 µm) and Shortwave Infrared (3.74 µm) images [click to enlarge]