This website works best with a newer web browser such as Chrome, Firefox, Safari or Microsoft
Edge. Internet Explorer is not supported by this website.
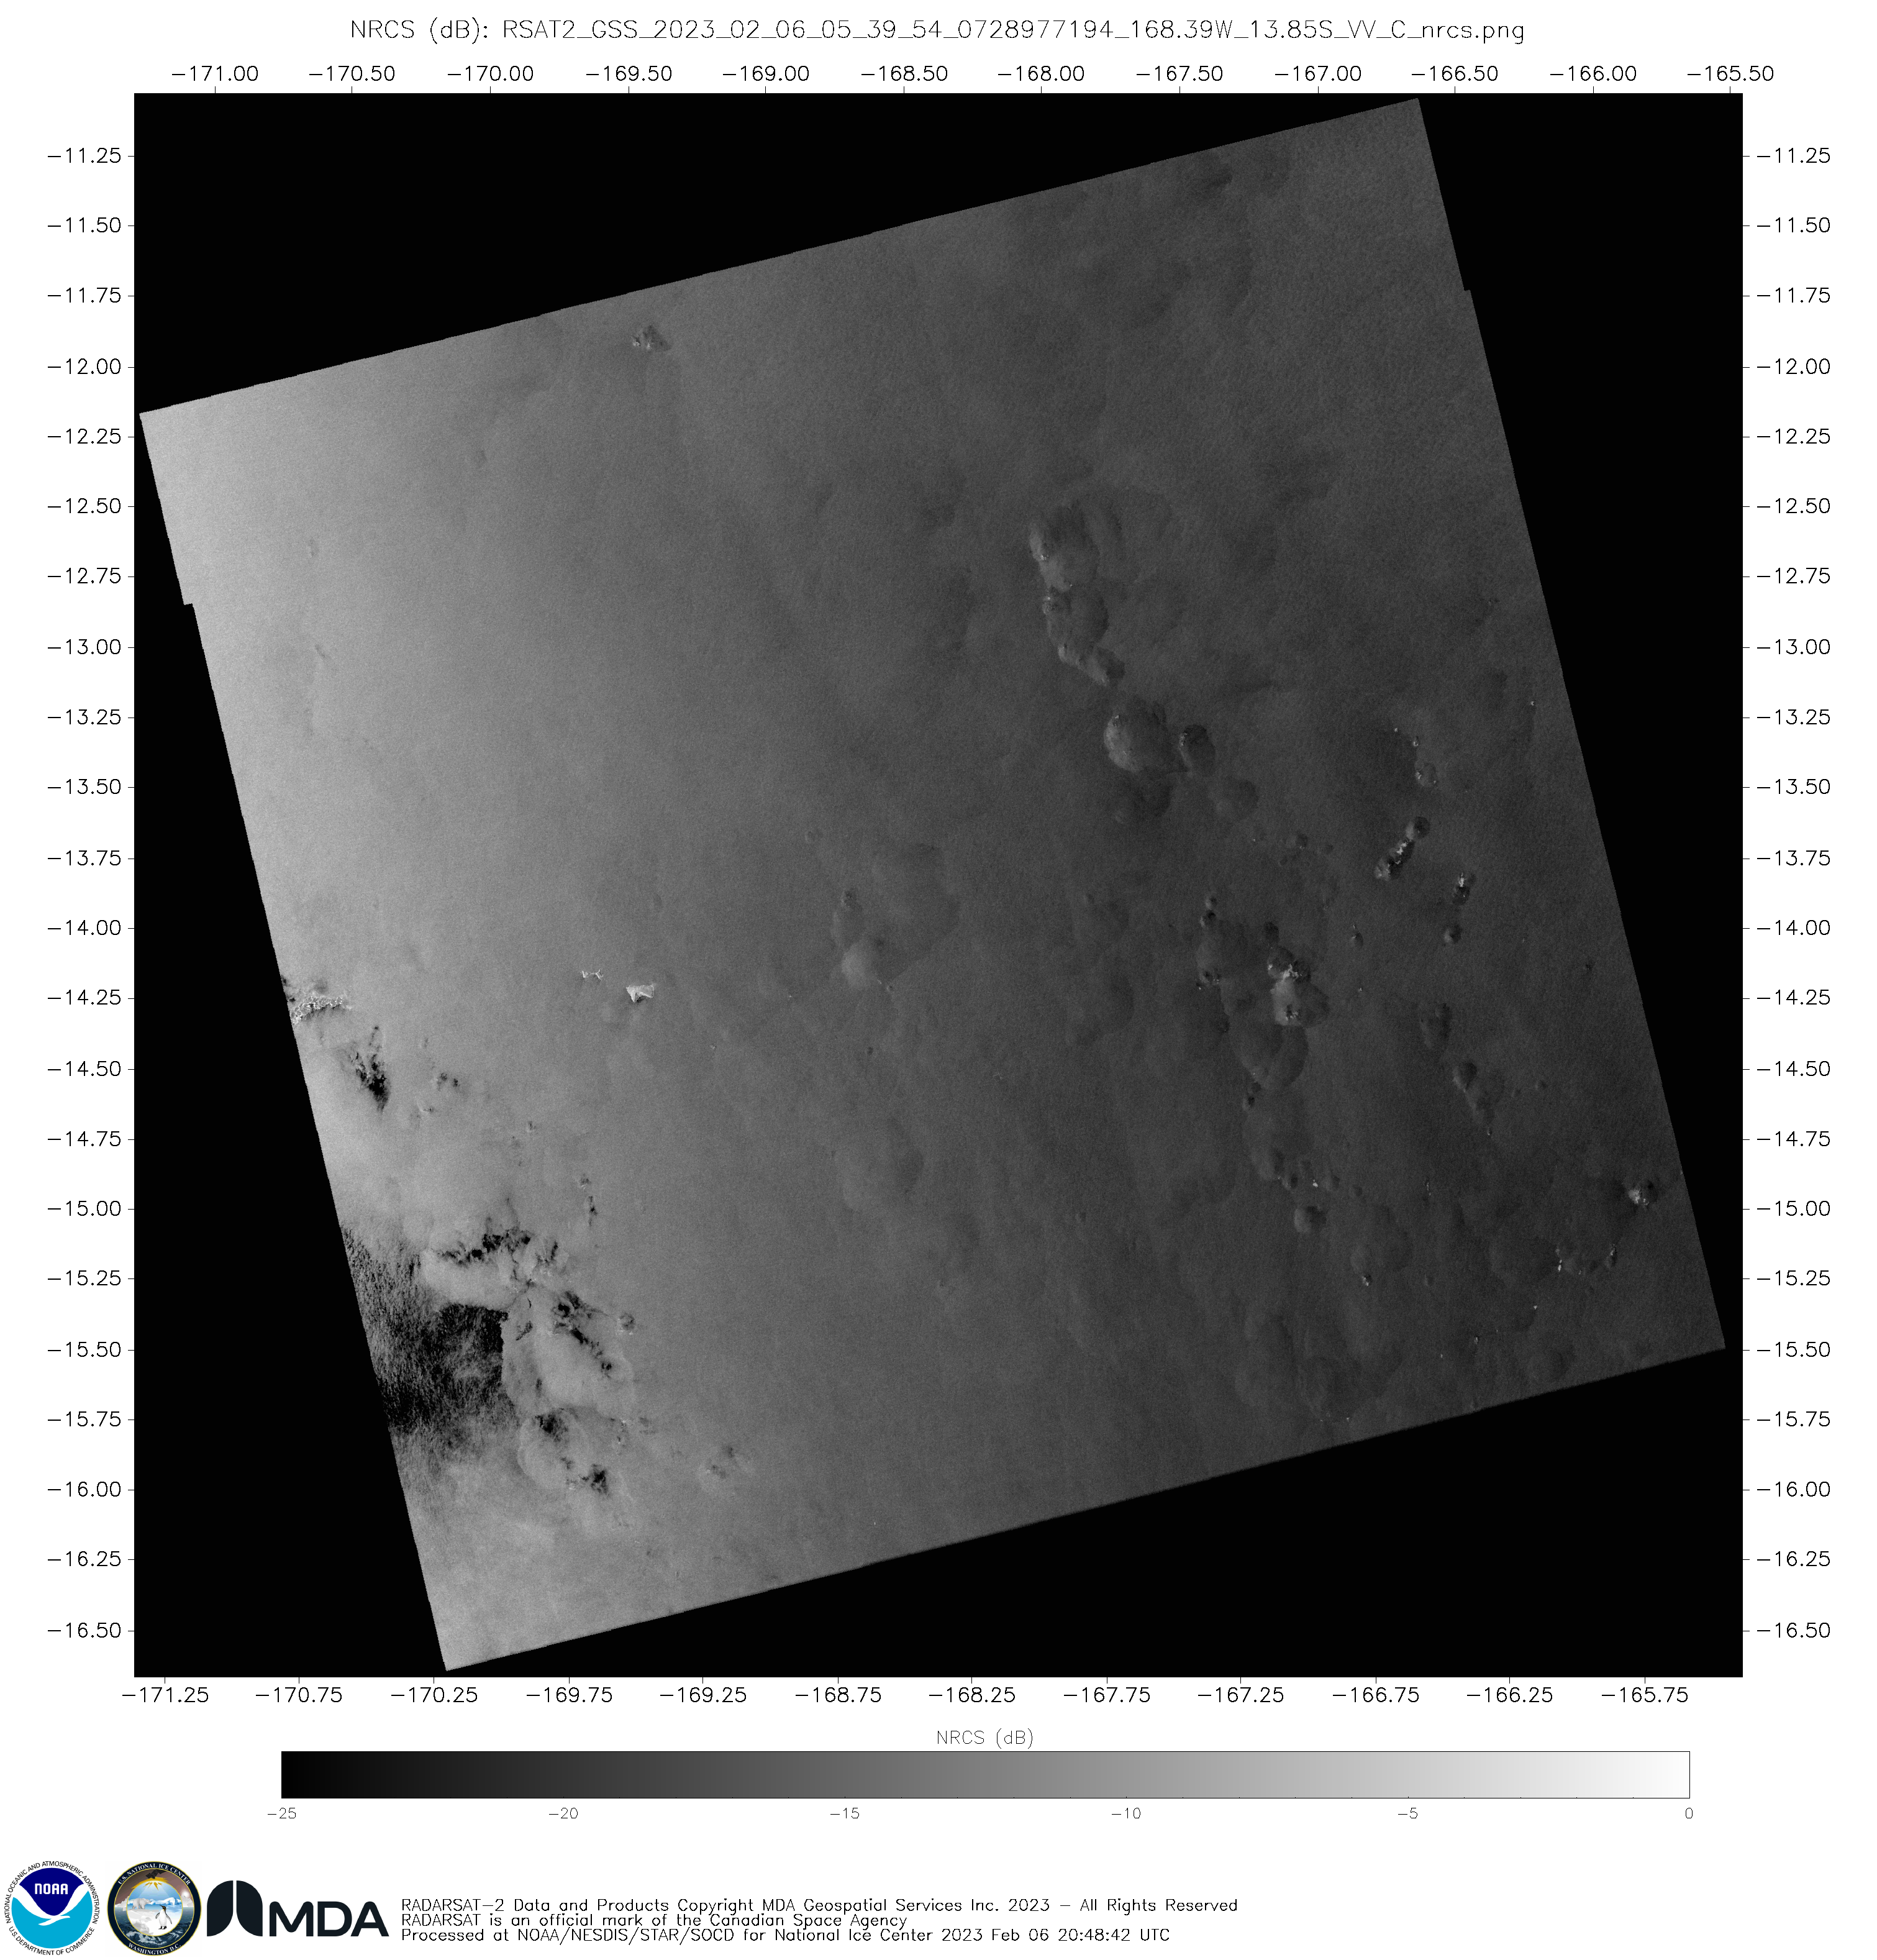
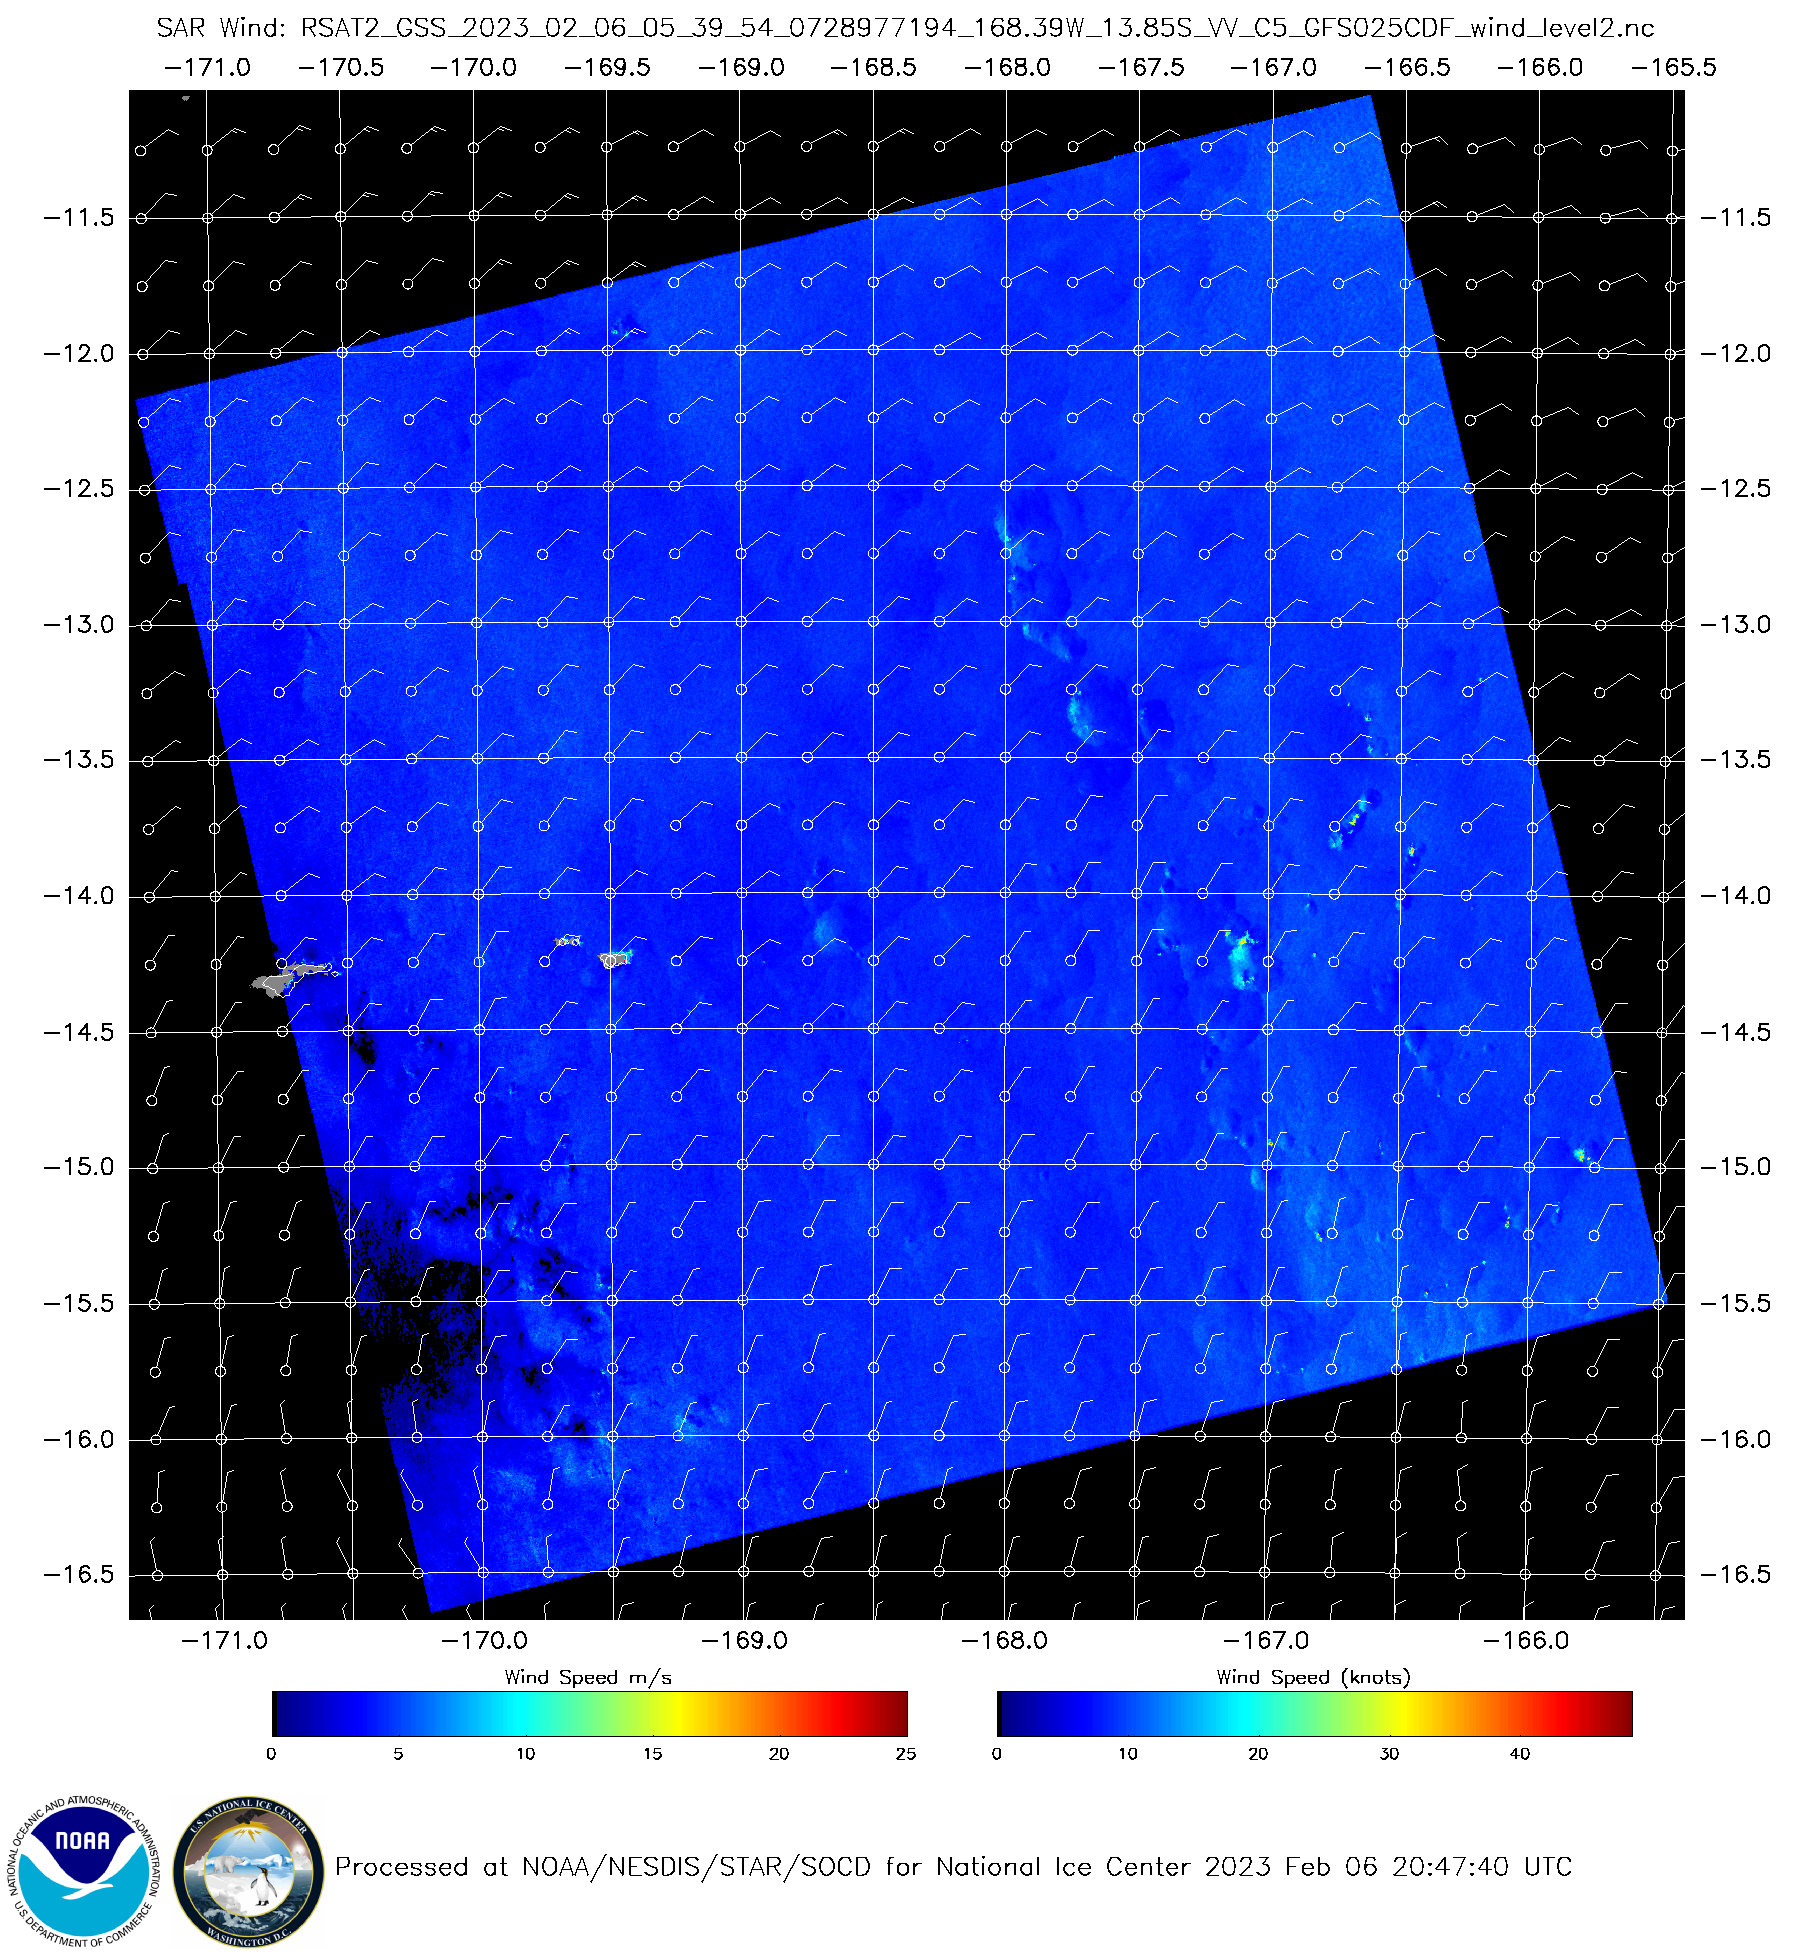
Synthetic Aperture Radar (SAR) RADARSAT-2 observations continue in/around the South Pacific Ocean surrounding American Samoa. On 6 February, observations occurred at 0543 and 1640 UTC. The toggle below compares the 0540 UTC Band 13 Clean Window infrared (10.3 µm) image with overlain SAR winds (color-enhanced with the AWIPS ‘gridded data’... Read More
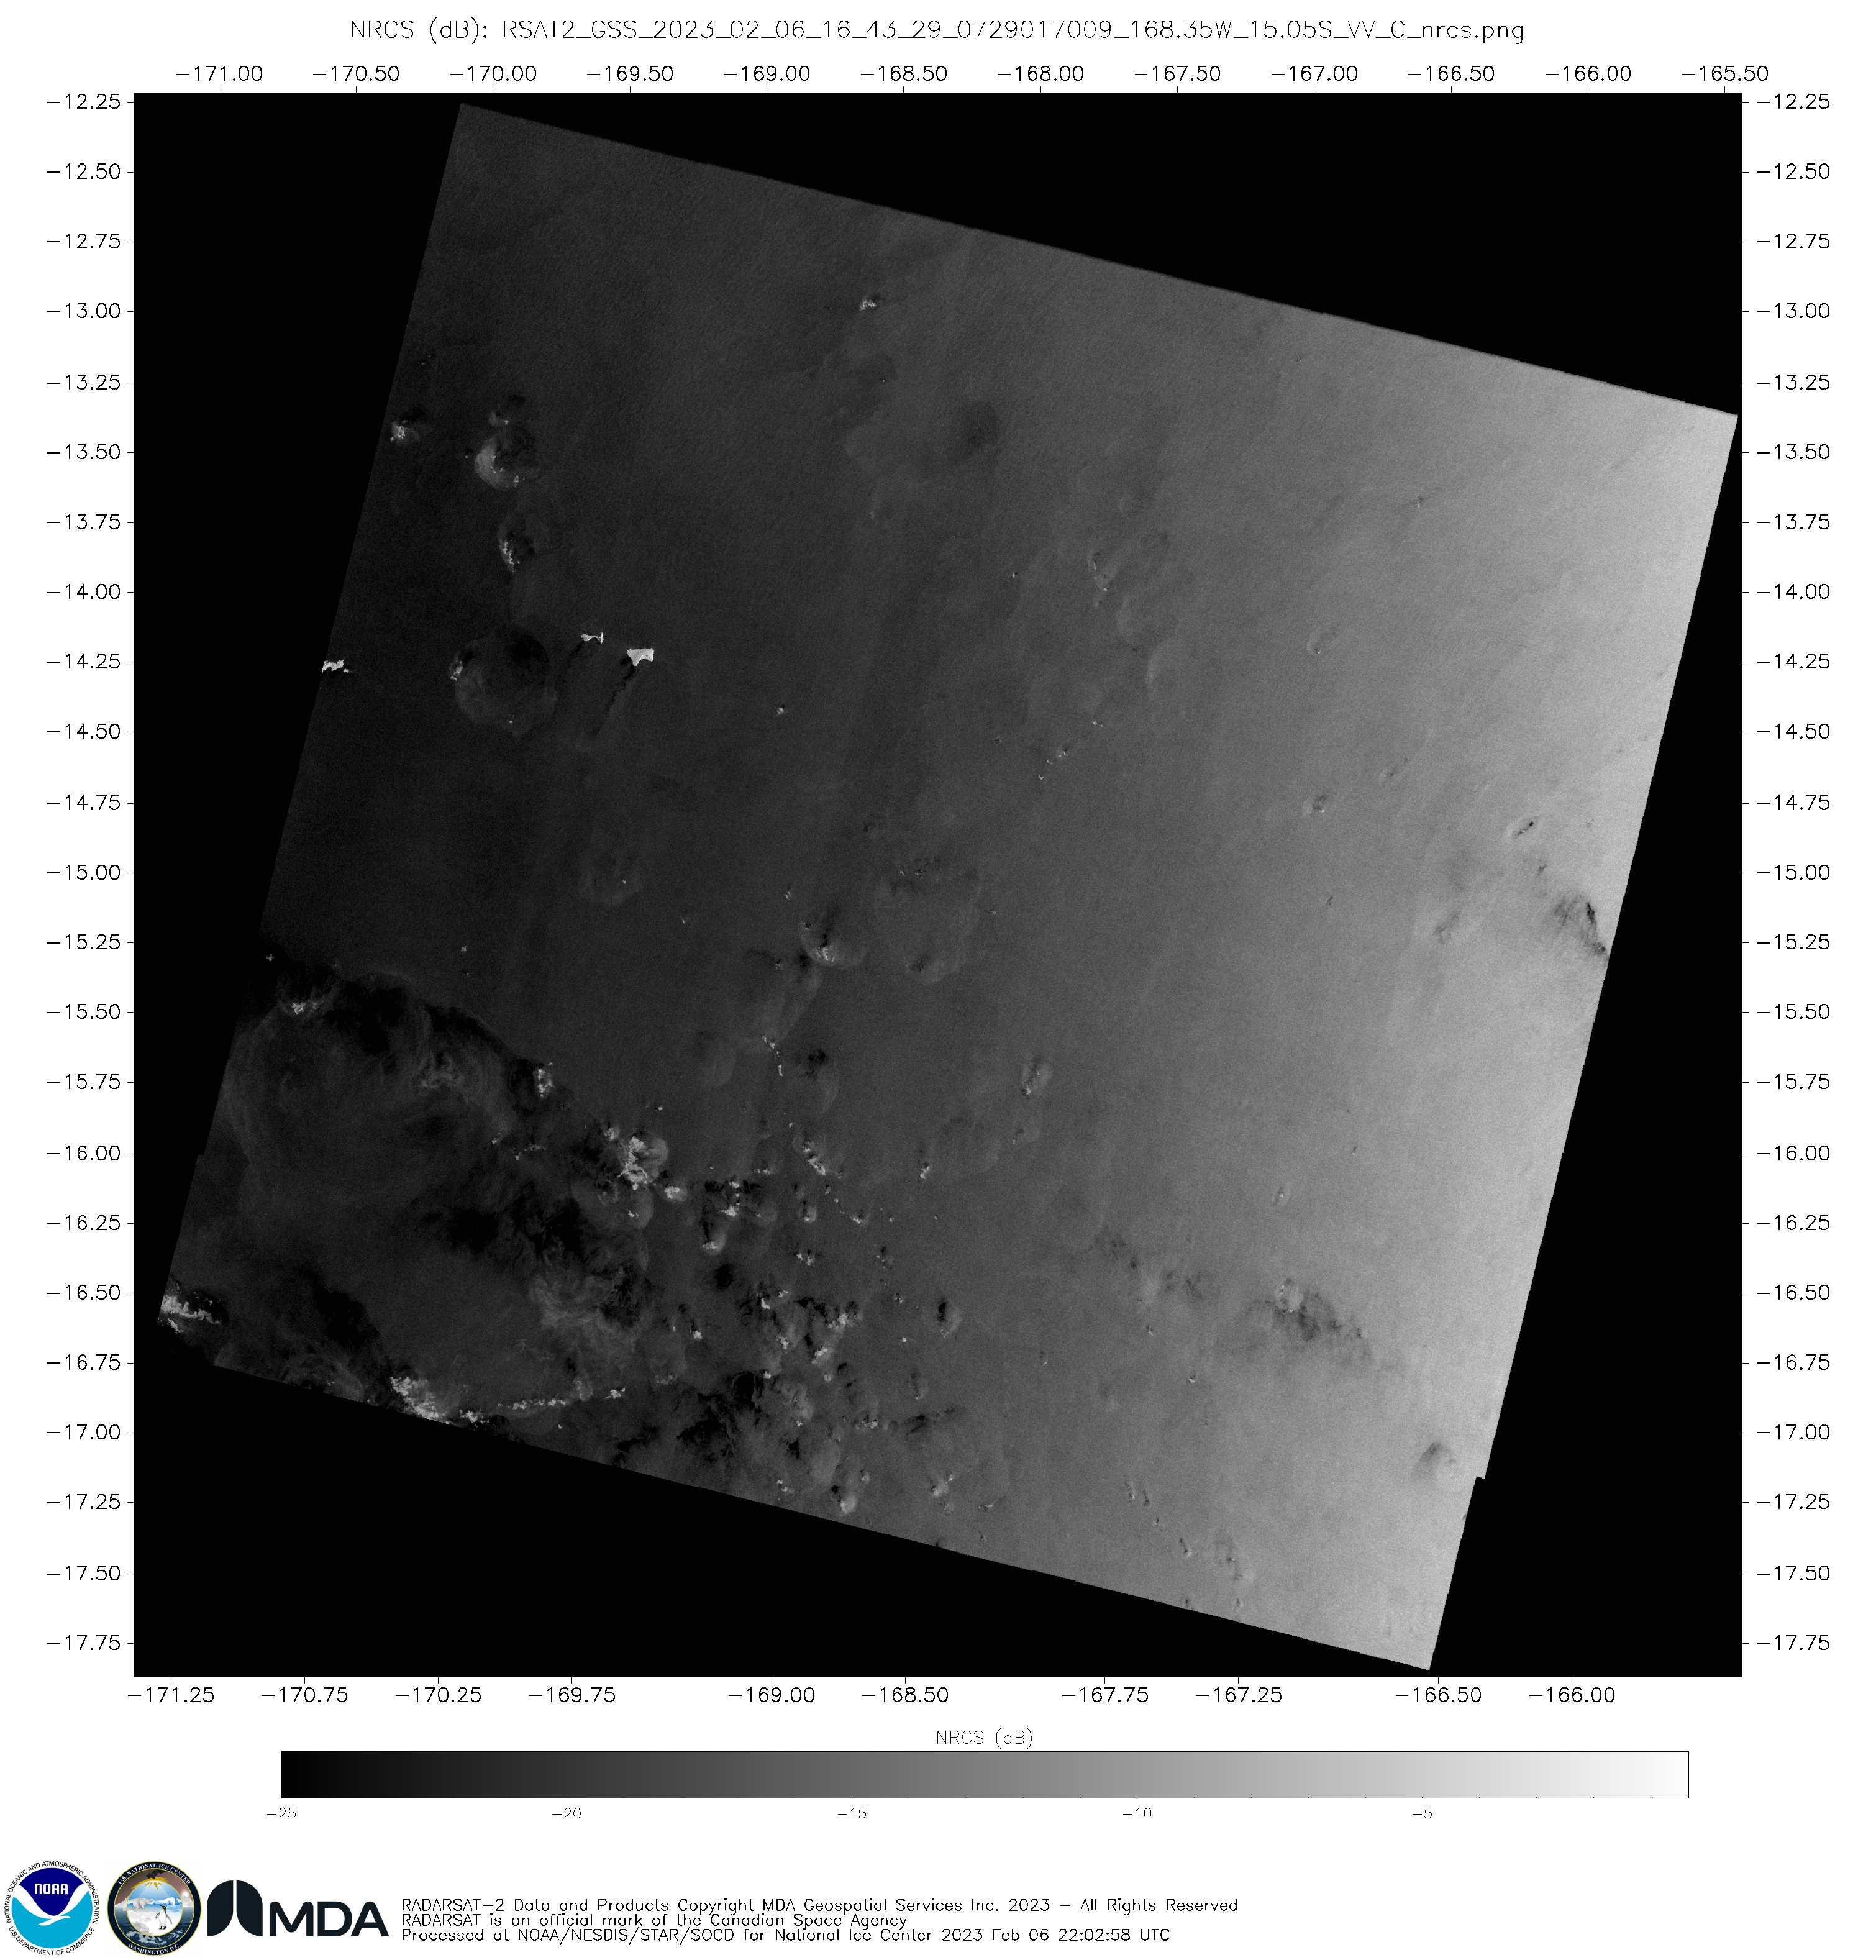
Synthetic Aperture Radar (SAR) RADARSAT-2 observations continue in/around the South Pacific Ocean surrounding American Samoa. On 6 February, observations occurred at 0543 and 1640 UTC. The toggle below compares the 0540 UTC Band 13 Clean Window infrared (10.3 µm) image with overlain SAR winds (color-enhanced with the AWIPS ‘gridded data’ enhancement, with values from 0-50 knots). This was a day with wind speeds around 10-12 knots over the ocean, with exception of a few lines of stronger winds. As with previous events, the strongest winds in these SAR analyses are likely related to highly reflective ice in the clouds. (Here is a toggle of the wind analysis and the Normalized Radar Cross Section NRCS analysis taken from this website; ice shows up as very bright white feathery structures in the NRCS imagery).
GOES-18 ABI Clean Window Infrared (Band 13, 10.3 µm) Imagery and RADARSAT-2 SAR Winds, 0540 UTC on 6 February 2023 (click to enlarge)
The Shortwave Infrared (ABI Band 7, 3.9) mp4 animation, below, (from the CSPP Geosphere site; here’s the direct link) shows the persistent westward motion of cloud features.
GOES-18 Band 7 Shortwave Infrared (3.9 µm) imagery, 0400 – 0710 on 6 February 2023
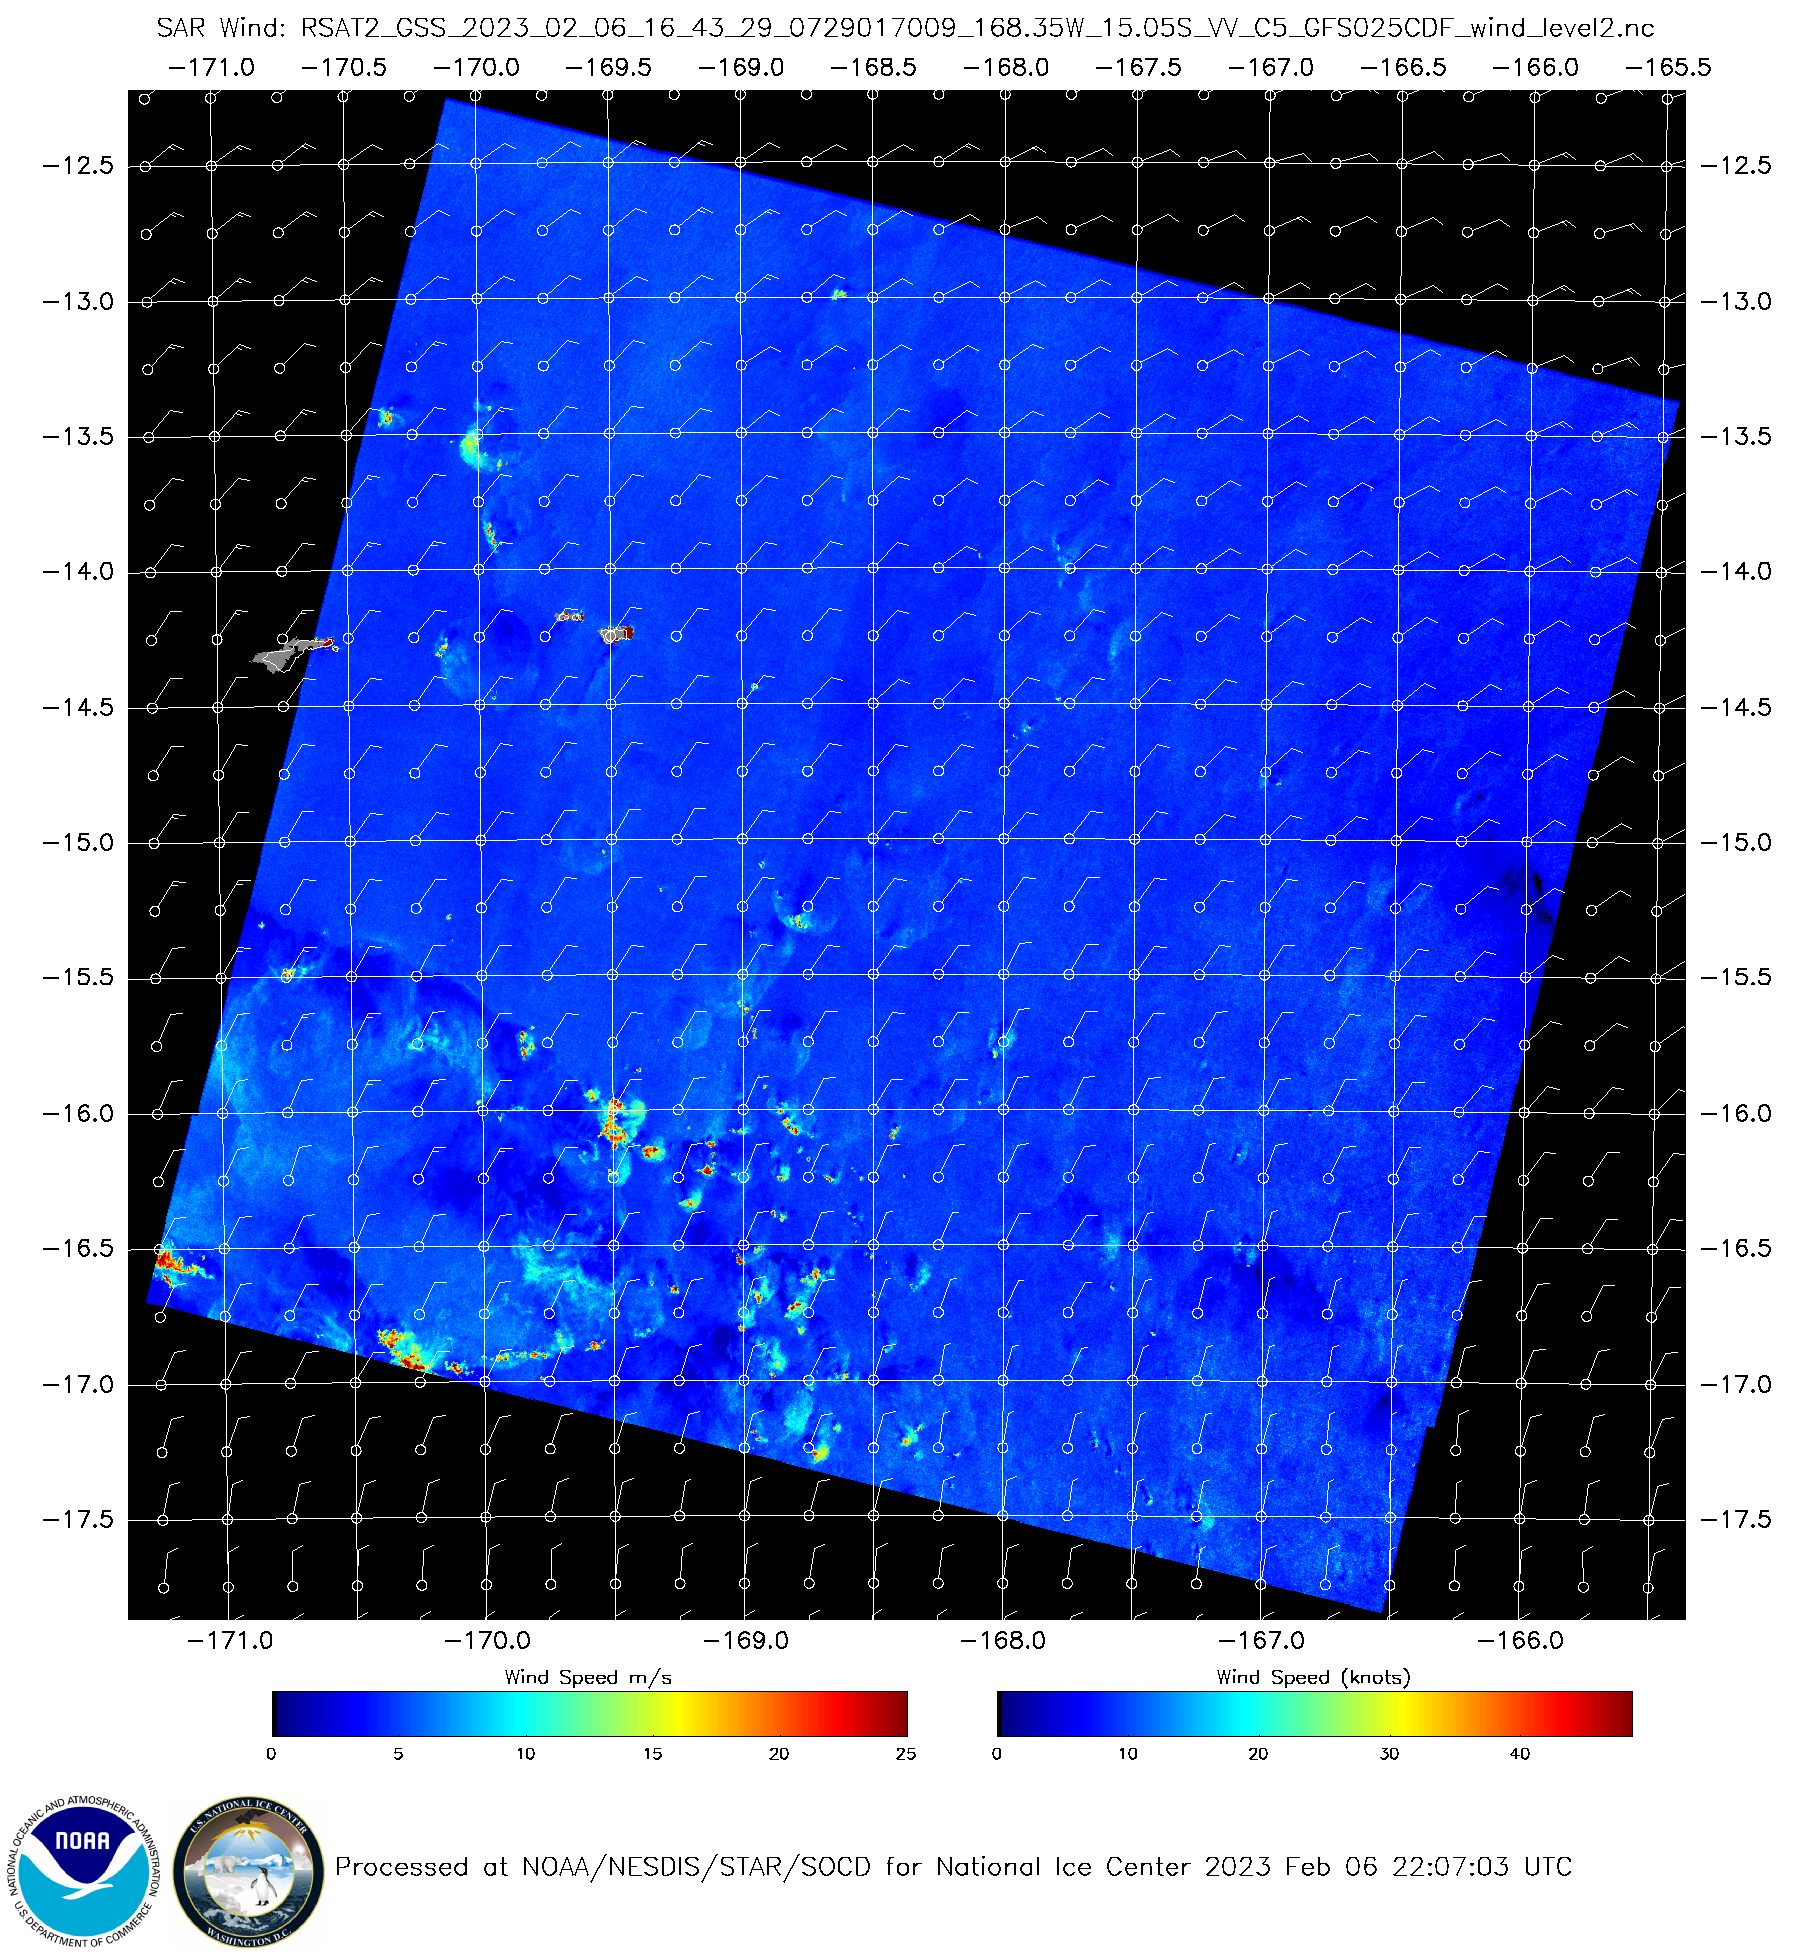
RADARSAT-2 also overflew American Samoa at 1643 UTC on 6 February. The toggle below shows the derived SAR wind speed and the GOES-18 Clean Window infrared (Band 13, 10.3 µm) imagery at that time. As with the morning pass, the strongest winds here are associated with ice crystals within the clouds, identifiable in the NRCS imagery (link to original imagery).
RADARSAT-2 Derived SAR Wind Speeds and GOES-18 Clean Window infrared (Band 13, 10.3 µm) imagery, 1640 UTC on 6 February 2023 (Click to enlarge)
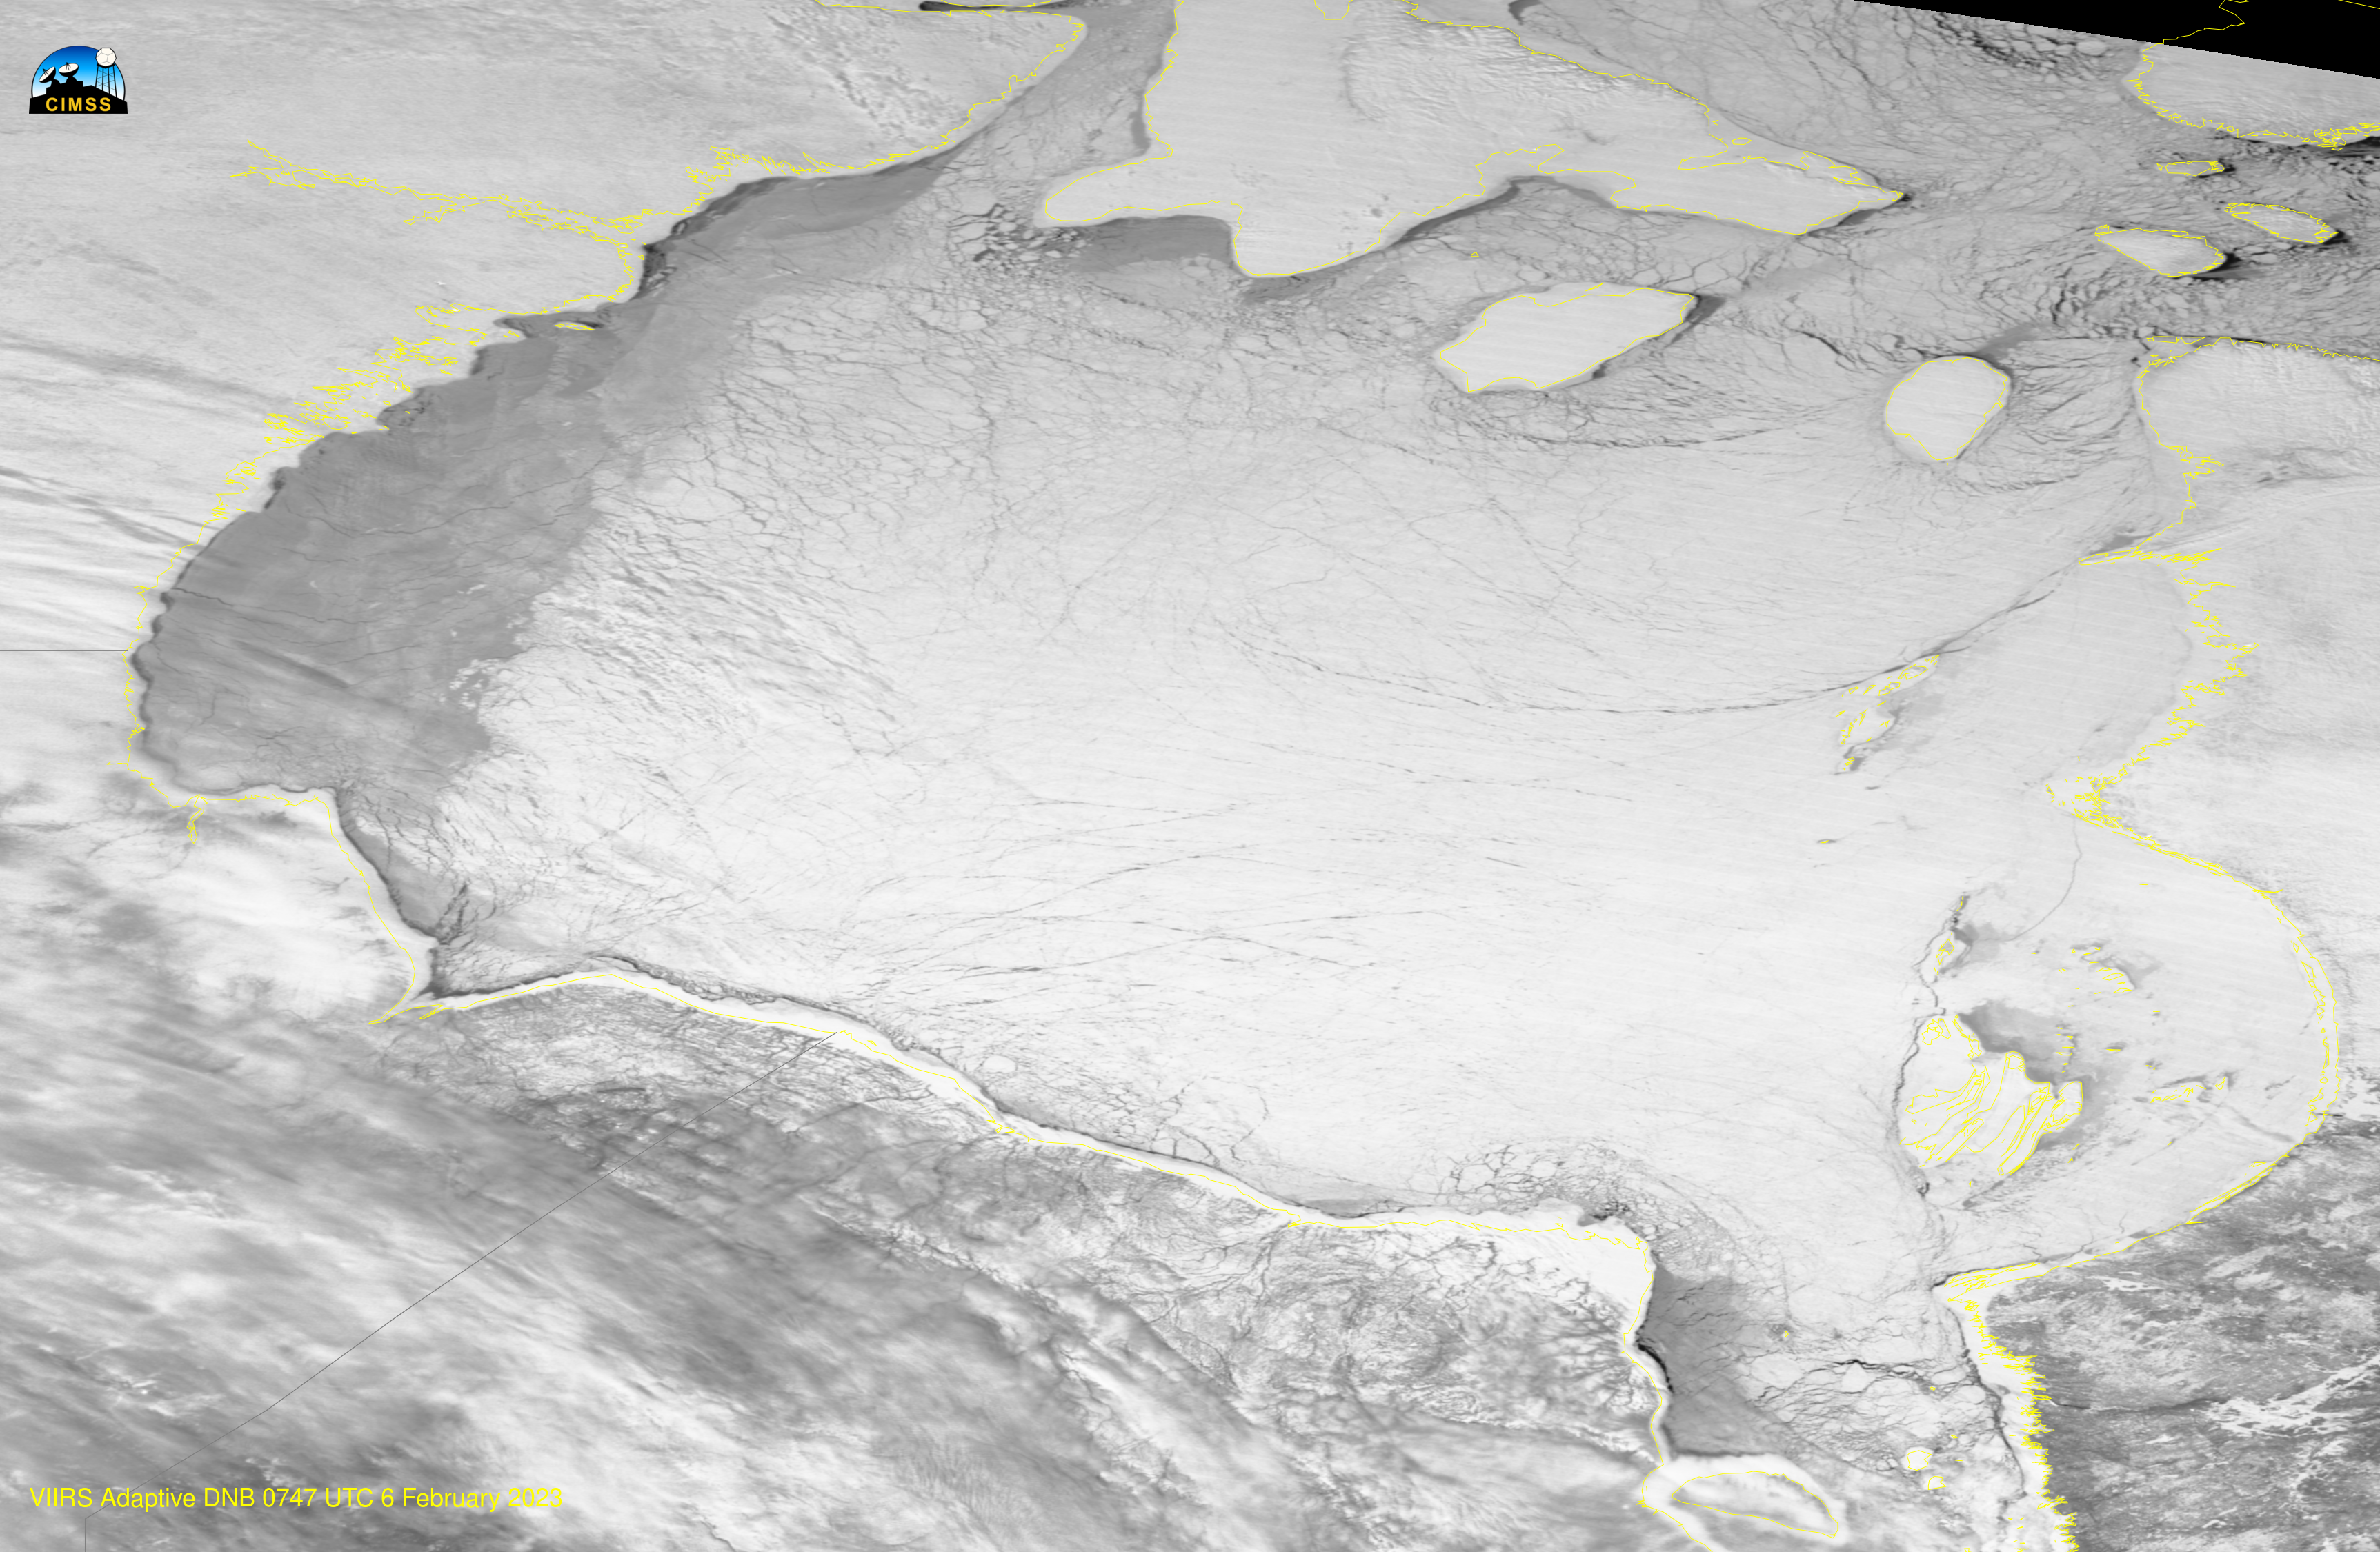
NOAA-20 Adaptive Daynight band visible (0.70 µm) imagery, 0747 UTC on 6 February 2023 (click to enlarge)
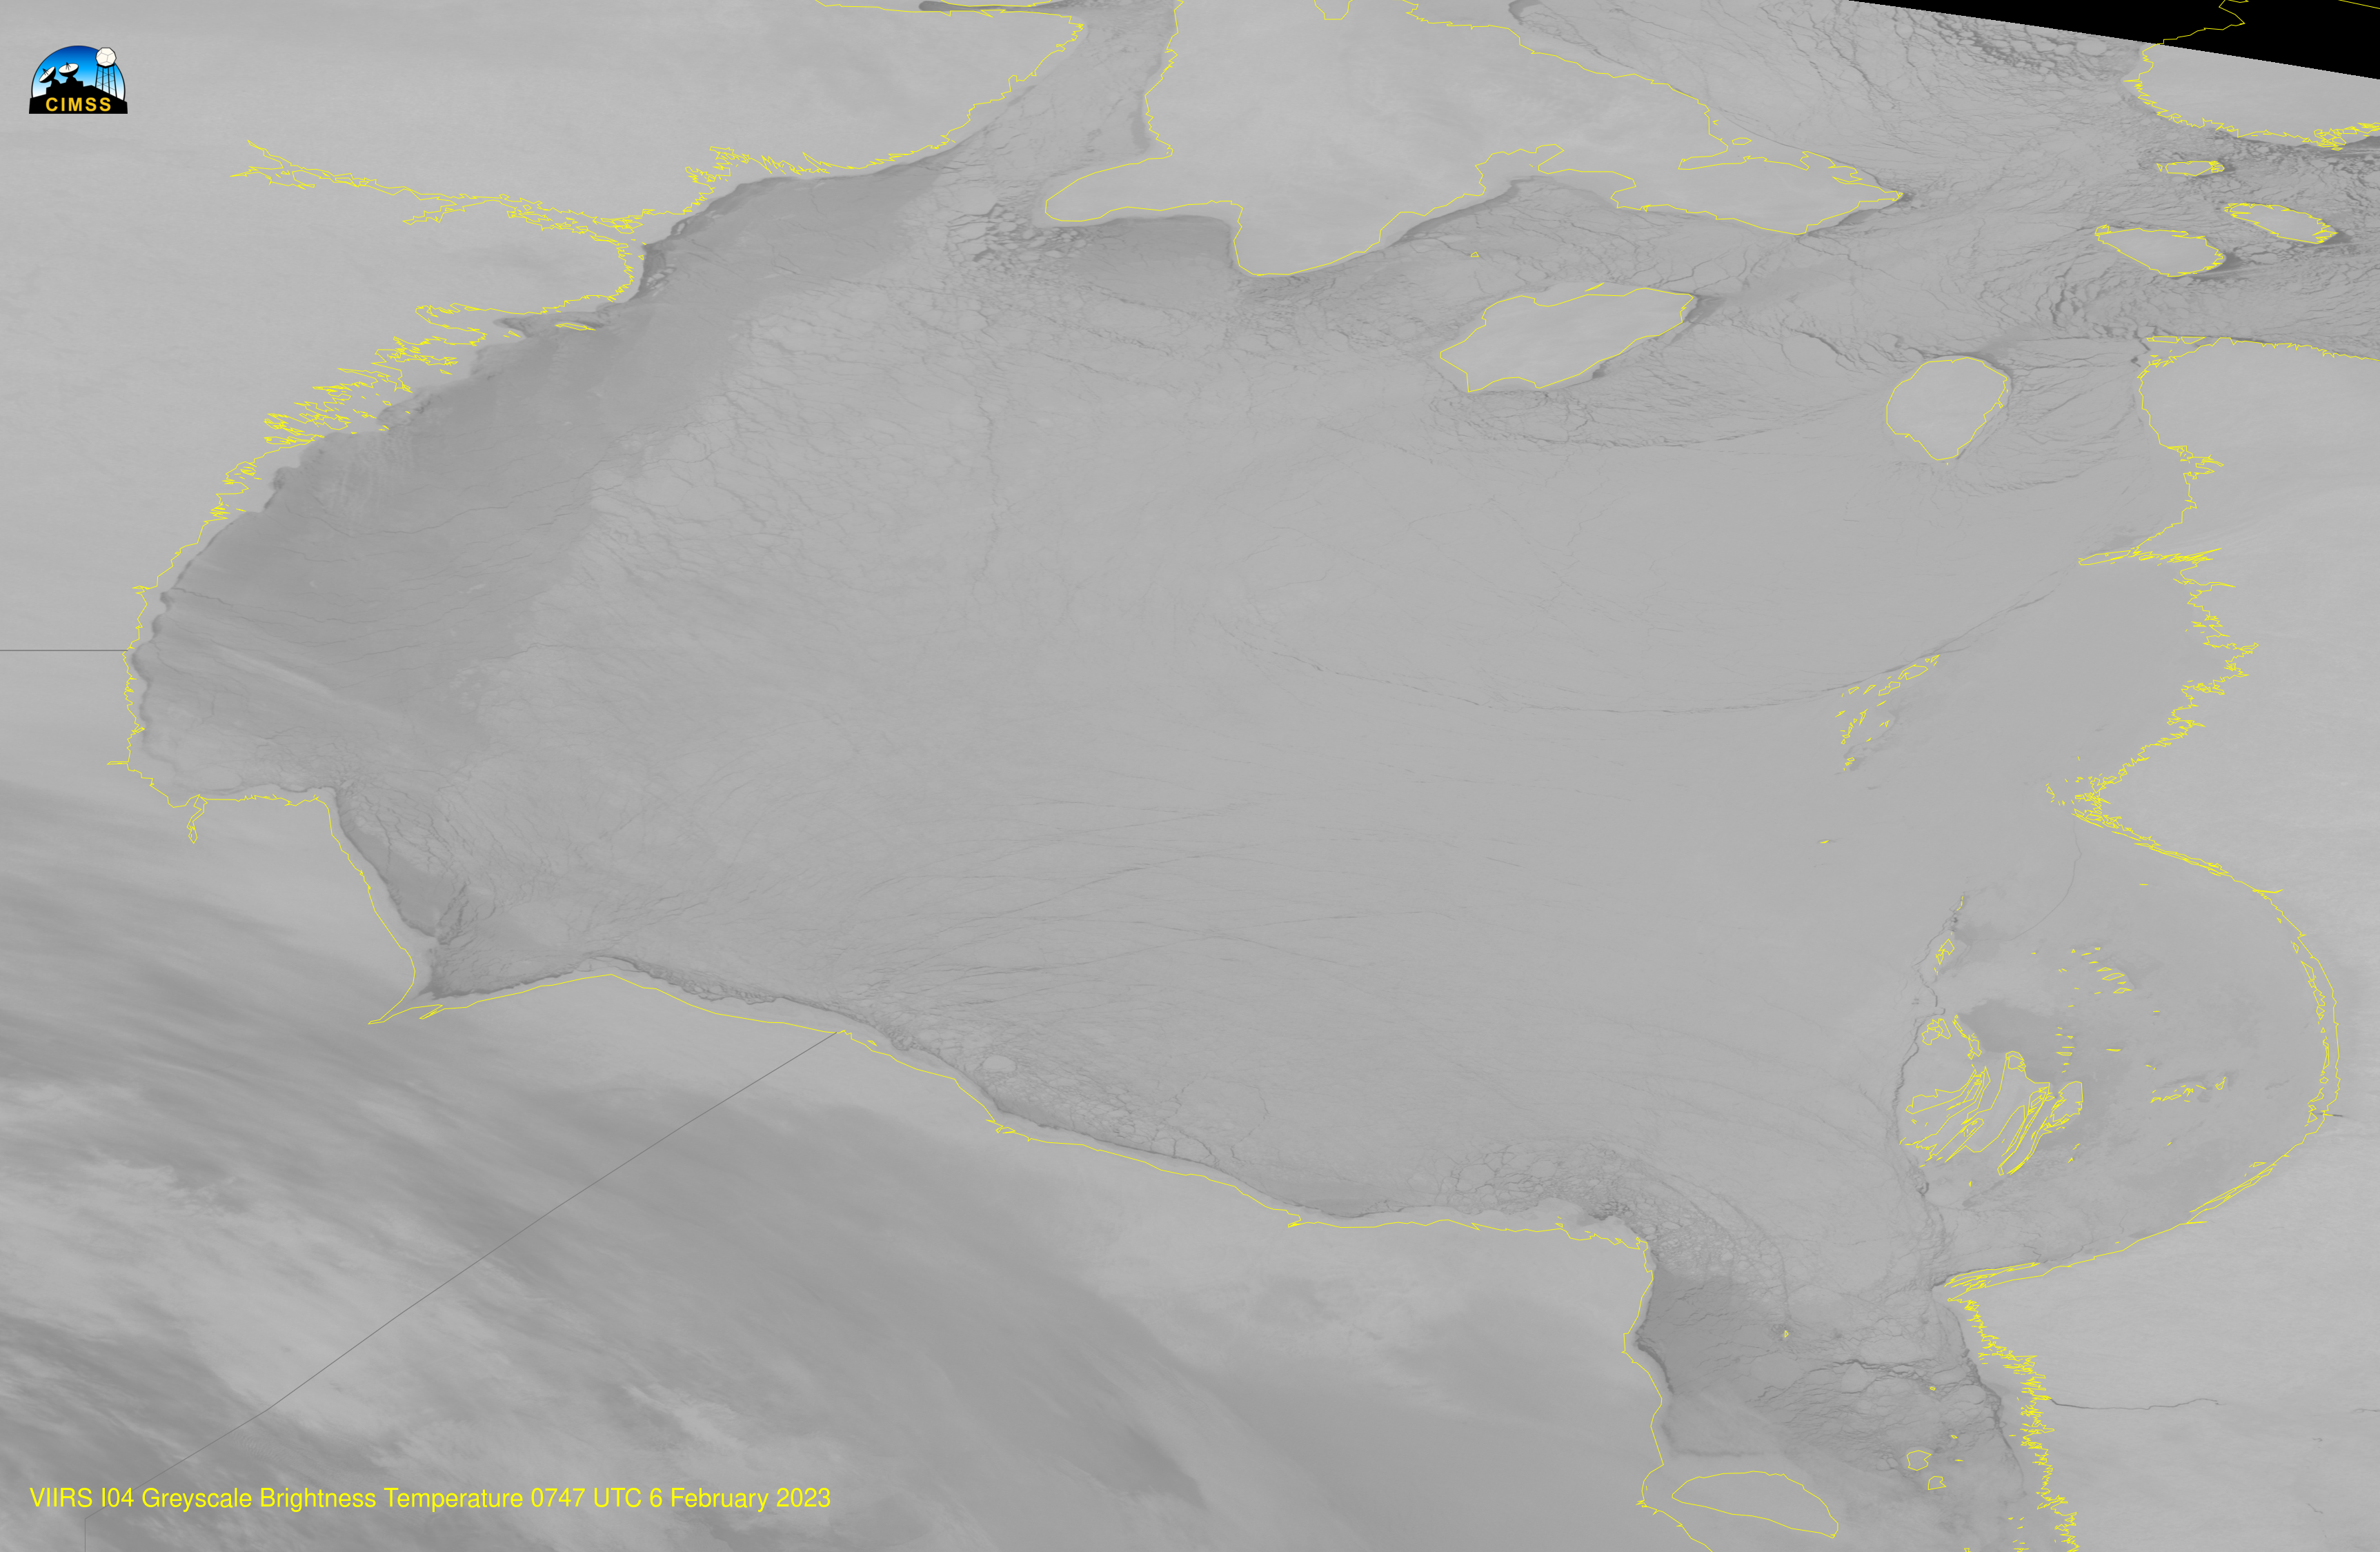
Daynight band imagery from the CIMSS Direct Broadcast antenna (processed by CSPP software) early on 6 February 2023 showed a curious region of darker reflectance over western Hudson Bay (VIIRS imagery is available from this temporary file; microwave imagery from ATMS at the same time is available from this temporary file). The toggle below, between the VIIRS I04 (3.74 µm) brightness temperature and the Dynamic Day Night Band imagery, shows that the darker ice is a warmer temperature, i.e., a darker shade of grey.
NOAA-20 Dynamic Daynight band visible (0.70 µm) imagery and VIIRS I04 infrared (3.74 µm) Brightness Temperature, 0747 UTC on 6 February 2023 (click to enlarge)
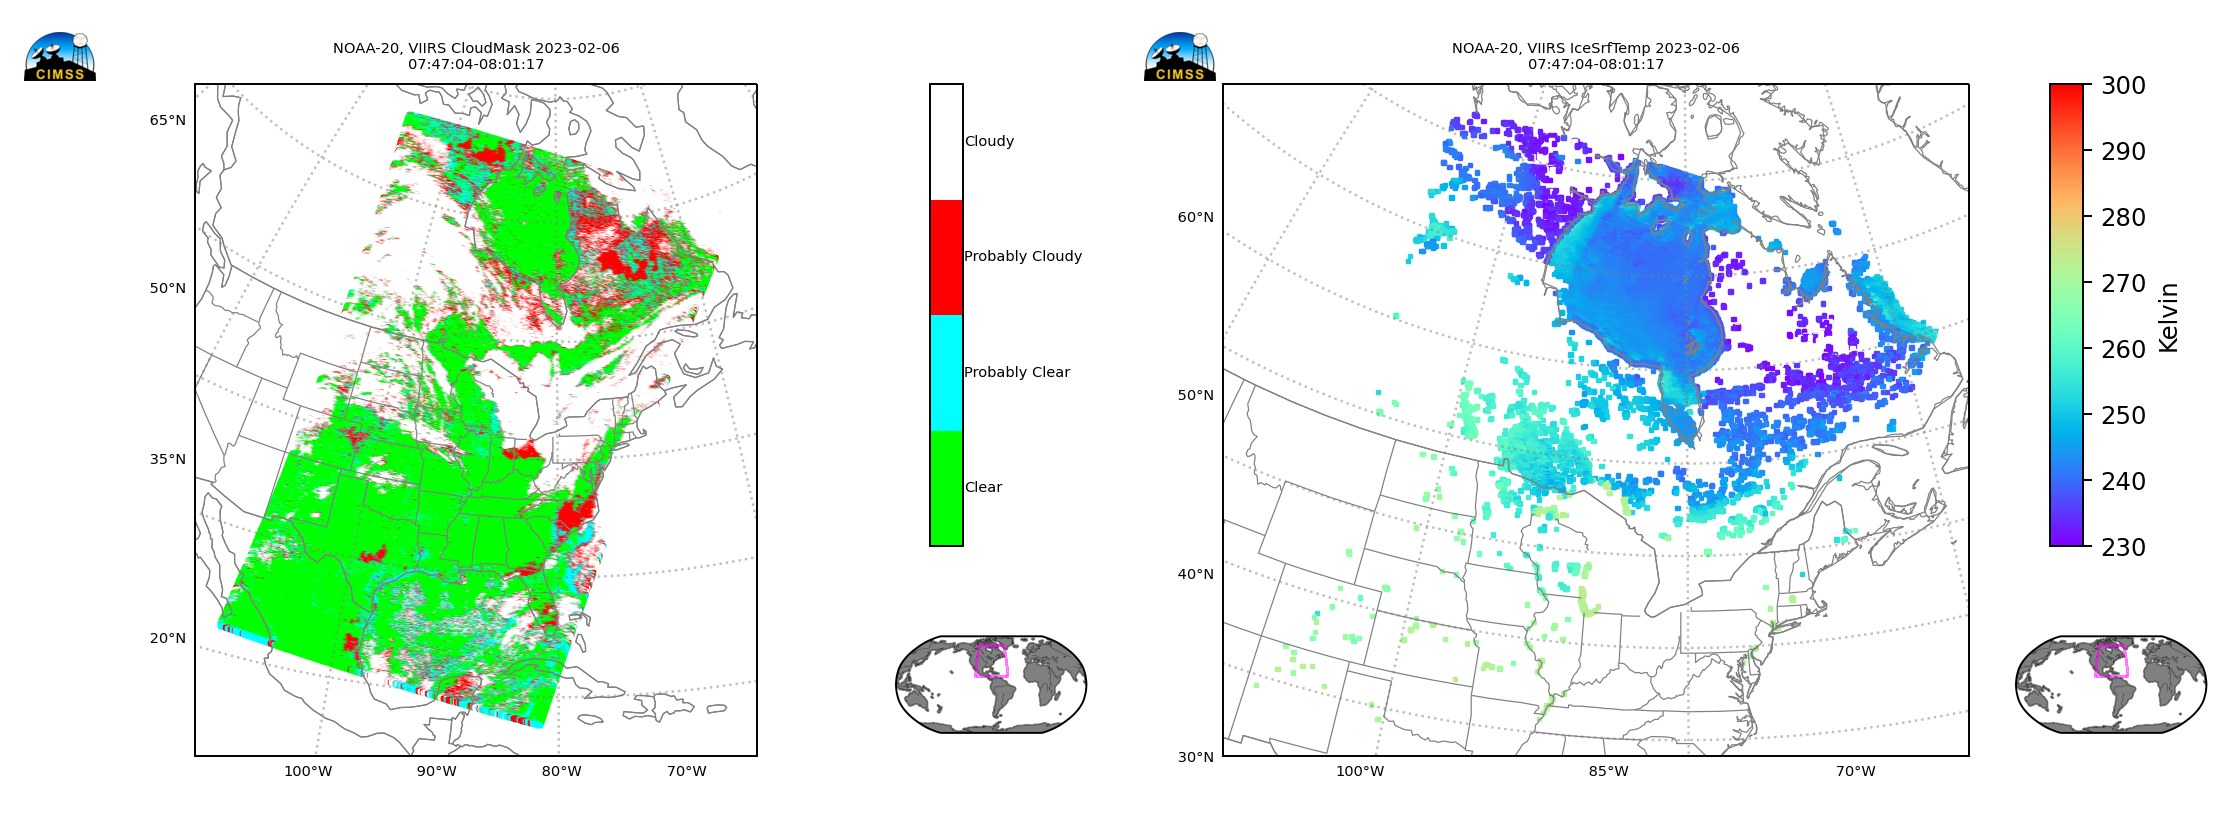
Products created from VIIRS and ATMS imagery on board NOAA-20 also show the curious ice difference over western Hudson Bay, For example, the Ice Surface Temperature, shown below with the VIIRS cloud mask, shows warmer ice surface temperatures over western Hudson Bay.
NOAA-20 VIIRS Cloud Mask (left) and Ice Surface Temperature (right), 0747 UTC on 6 February 2023 (Click to enlarge)
Microwave imagery from the Advanced Technology Microwave Sounder (ATMS) at the same time (for window channels) also shows warmer brightness temperatures over western Hudson Bay. An interesting question is why — and why do these brightness temperatures also mean less reflectance?
Microwave brightness temperatures from ATMS channels 3, 4, 5, 16, 17, 18, 19, 20 (Click to enlarge)
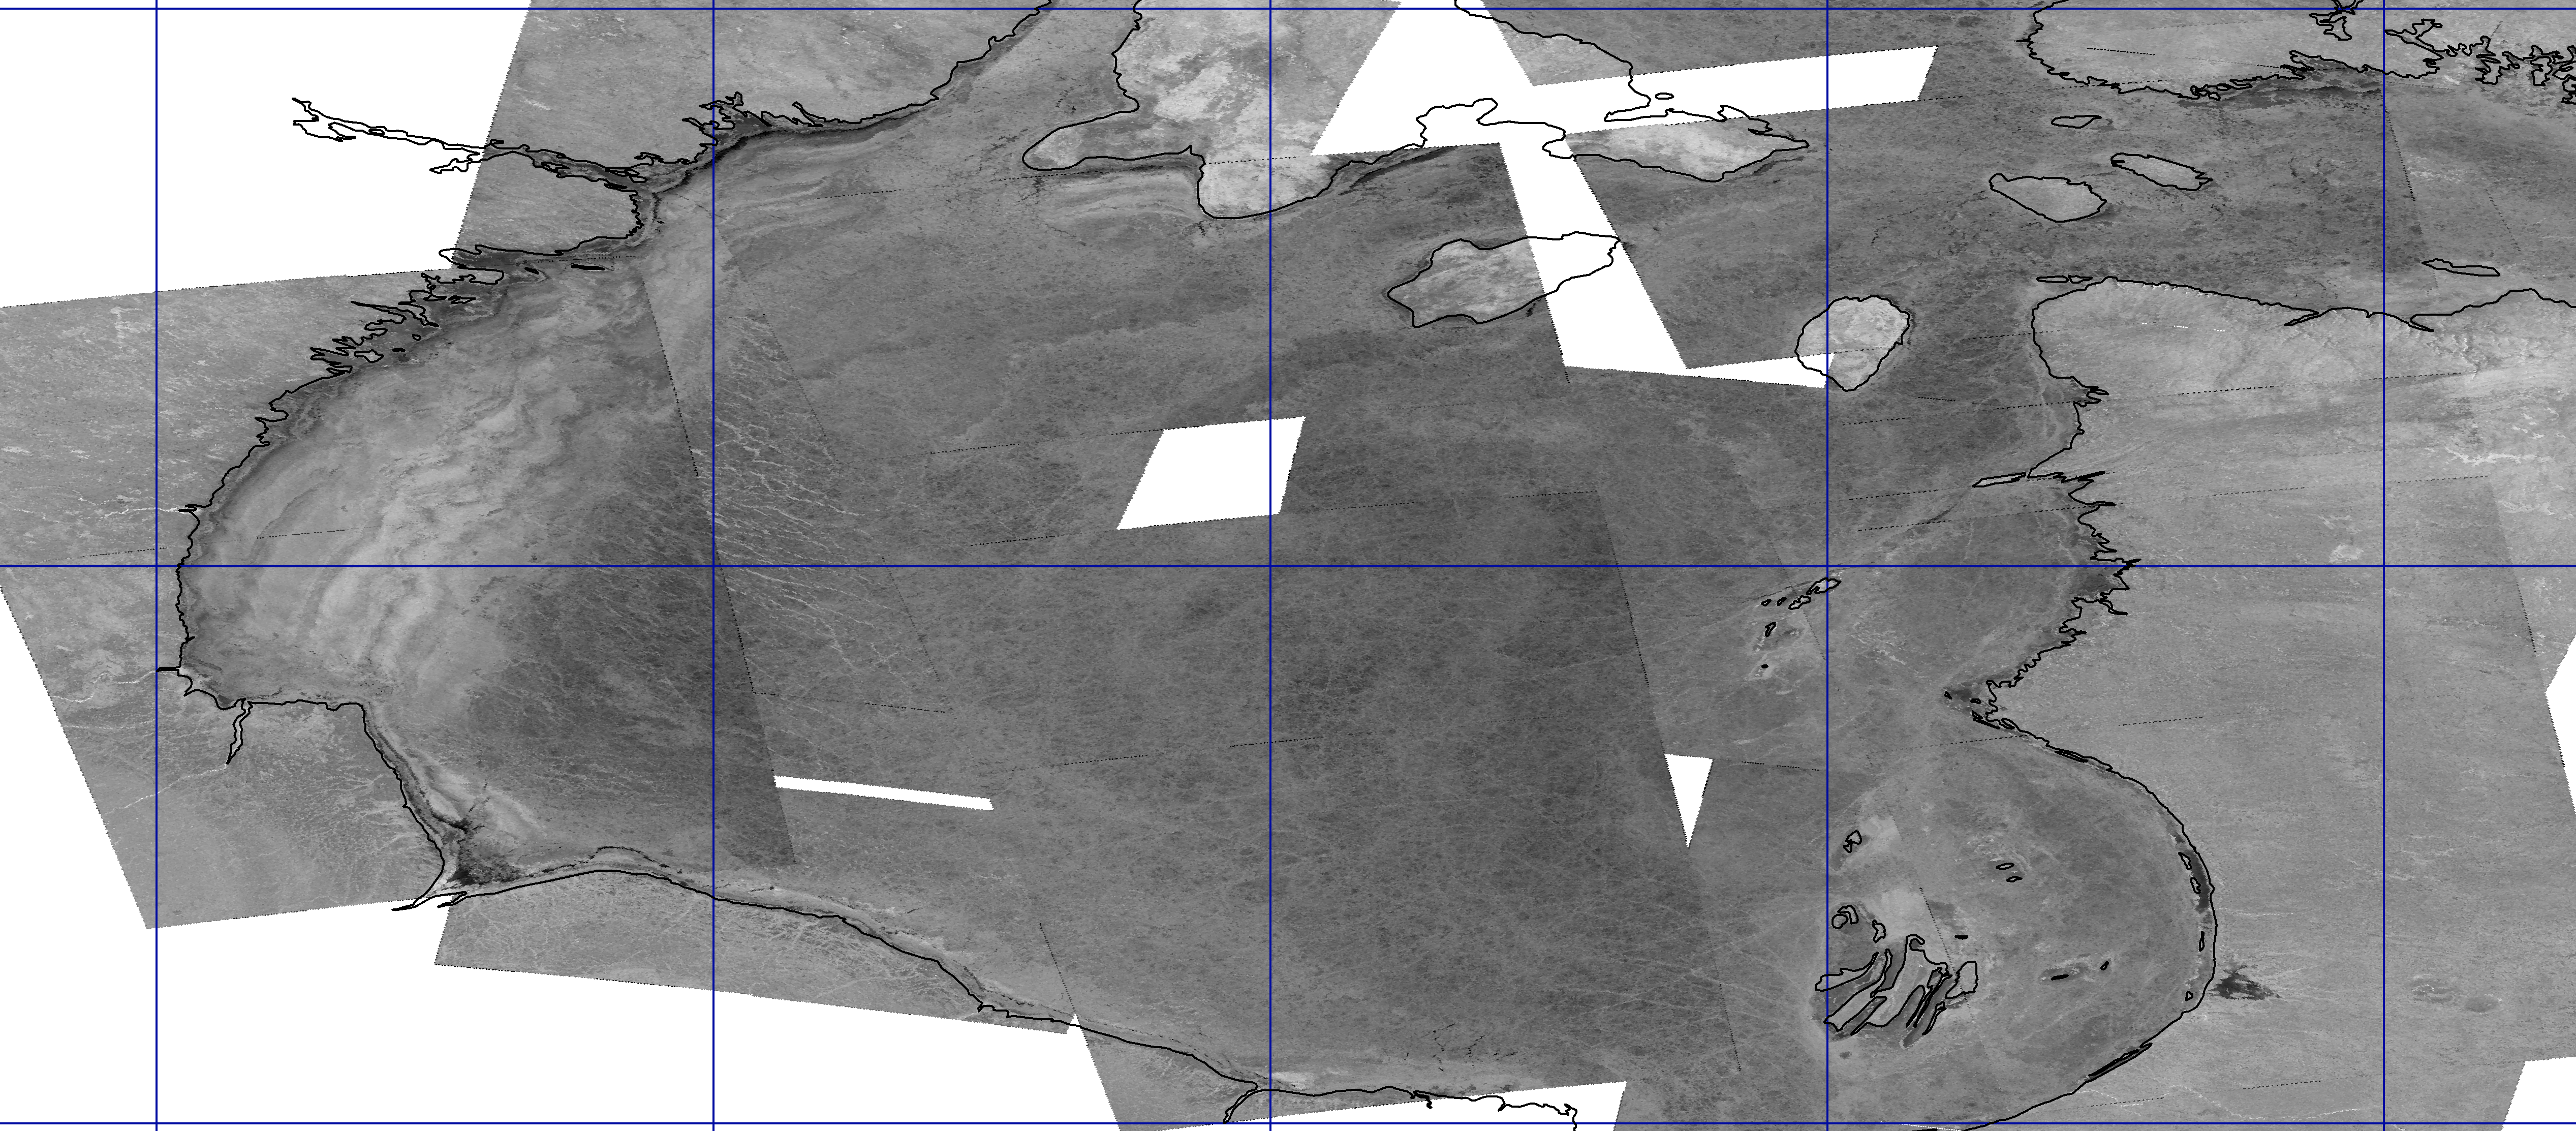
Visible (daytime) imagery from the previous day from the 1746 UTC NOAA-20 (from here) overpass hints at a possible reason. The 1.61 µm imagery over the western part of the Hudson Bay is a bit darker — suggestive of less reflectance either because of snow age, or because of past freezing rain/ice pellet accumulation. The difference apparent in the Day Night band is also apparent in the VIIRS Day time visible imagery toggling below (and here). The difference in the surface inferred by the changes in the 1.61 µm imagery would affect the emission of infrared imagery on the following night, leading to the differences in brightness temperatures observed.
NOAA-20 VIIRS I01 (0.64 µm) and I03 (1.61 µm) imagery, 1746 UTC on 5 february 2023 (Click to enlarge)
Brad Vrolijk, a forecaster in eastern Canada, notes via email that a more plausible explanation is persistent northwesterly winds in the region. The animation of 0900 UTC surface analyses (from 24 January to 6 February) below does show a surface pressure analysis consistent with northwesterly winds around persistent Low Pressure over that would result in a scouring of snow from the western part of the bay, and that would affect the reflectance.
0900 UTC Surface analyses, 24 January – 6 February 2023 (Click to enlarge)
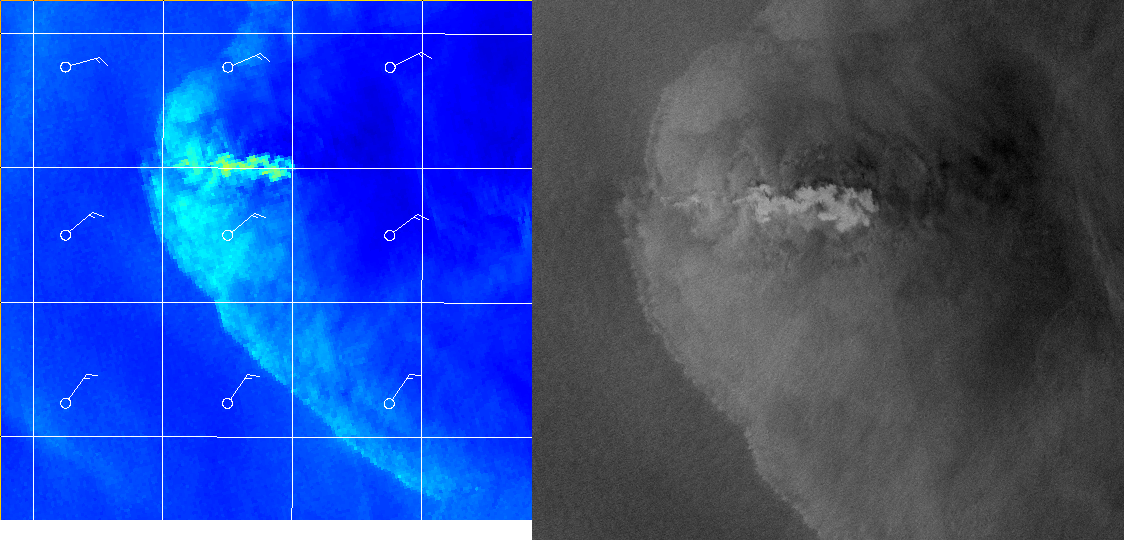
The NOAA/STAR Water Surface Conditions / Synthetic Aperture Radar (WSC/SAR) Team sent the following composite SAR Ice image over Hudson Bay (Thanks!!): the brighter region over western Hudson Bay shows rougher ice there.
Composite SAR Ice Analysis, 5 February 2023 (Click to enlarge)
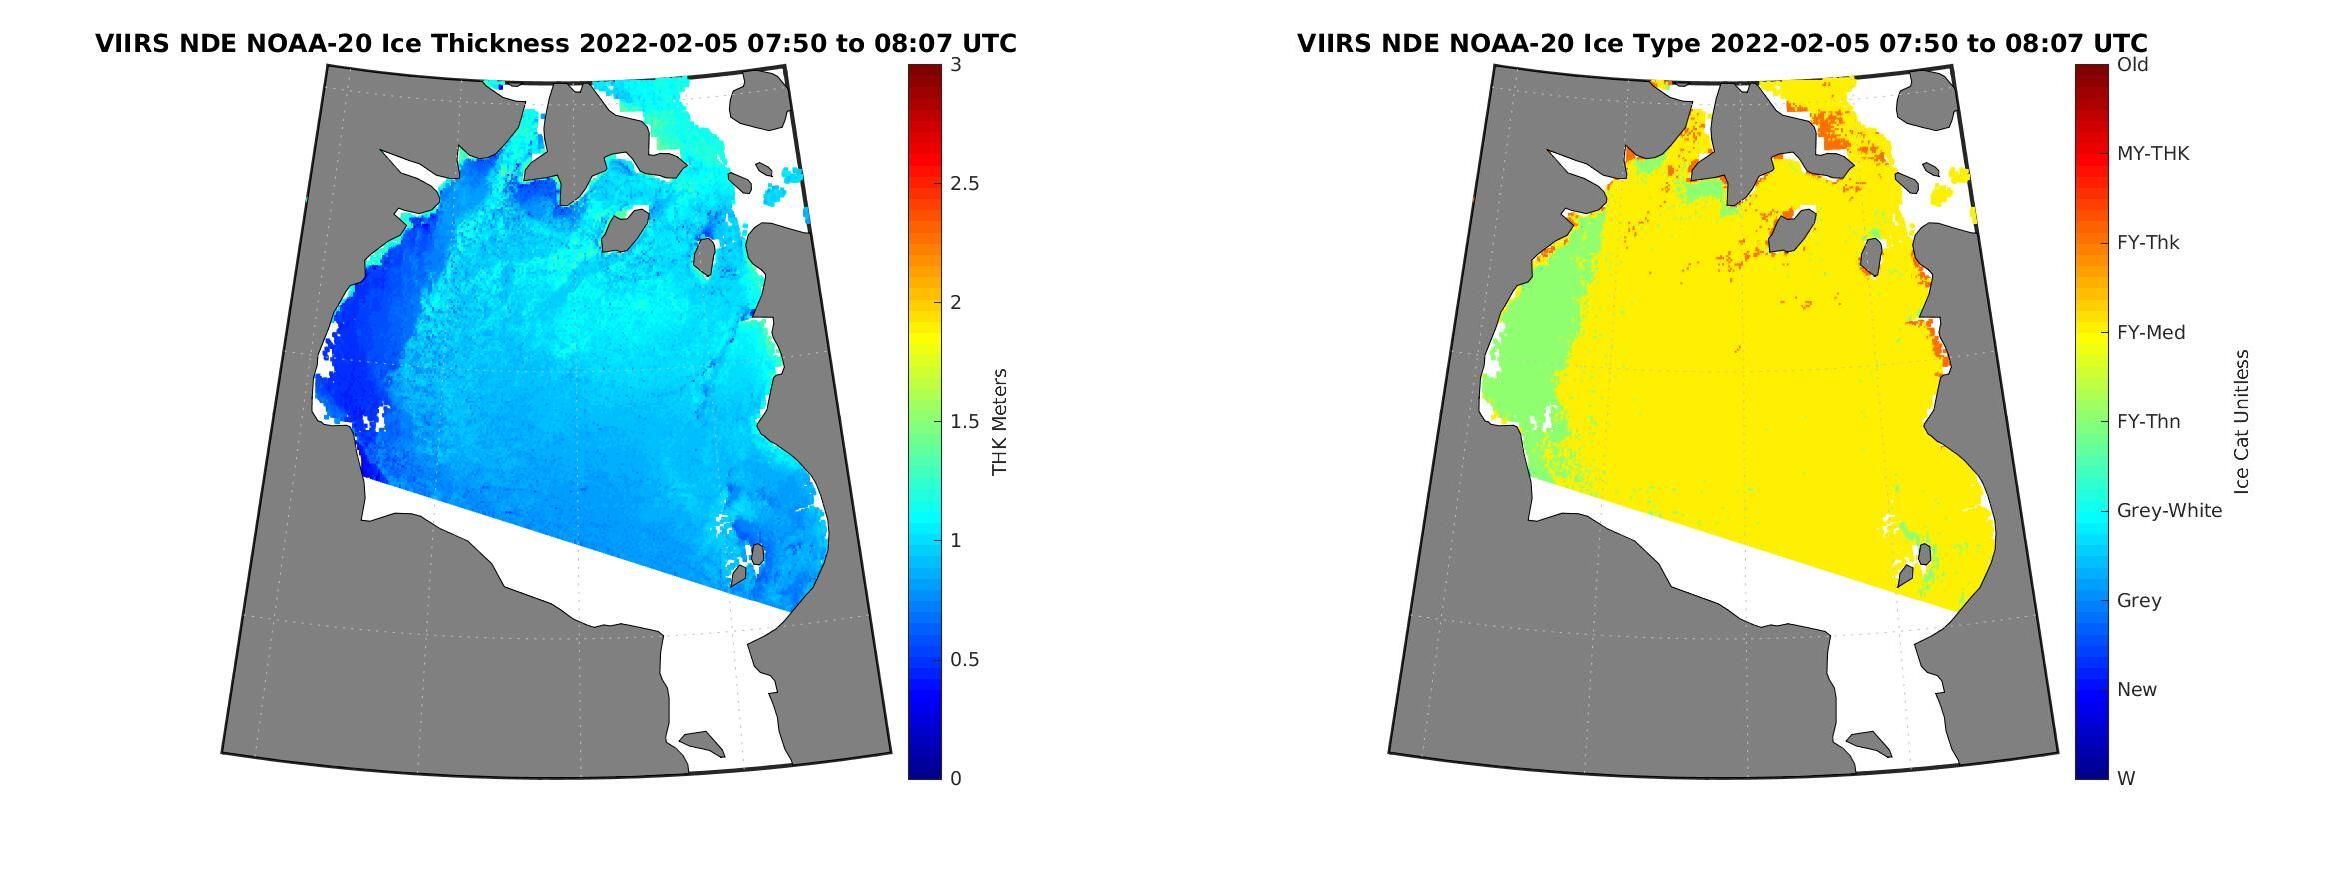
VIIRS ice products also include Sea Ice Thickness and Sea Ice Age, as shown below from 5 February. Note that these two products are controlled in part by the Ice Surface Temperature, shown above. The darker ice over western Hudson Bay is both thinner (dark blue v. cyan to the east) and younger (green v. yellow to the east). (Images courtesy Rich Dworak, CIMSS).
VIIRS Ice Thickness (left) and Ice Type (right) from the morning passes on 5 February 2023 (Click to enlarge)
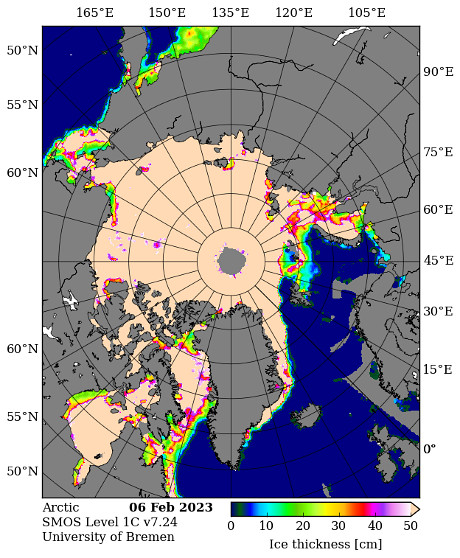
SMOS satellite observations of sea ice thickness also show thinner ice over western Hudson Bay. The image below is taken from this website.
SMOS Sea Ice Thickness observations, valid on 06 February 2023 (Click to enlarge)
Added, March 2023: The National Sea Ice Data Center (NSIDC) had a news article on this feature (link) as part of a discussion on the Kivalliq polynya.
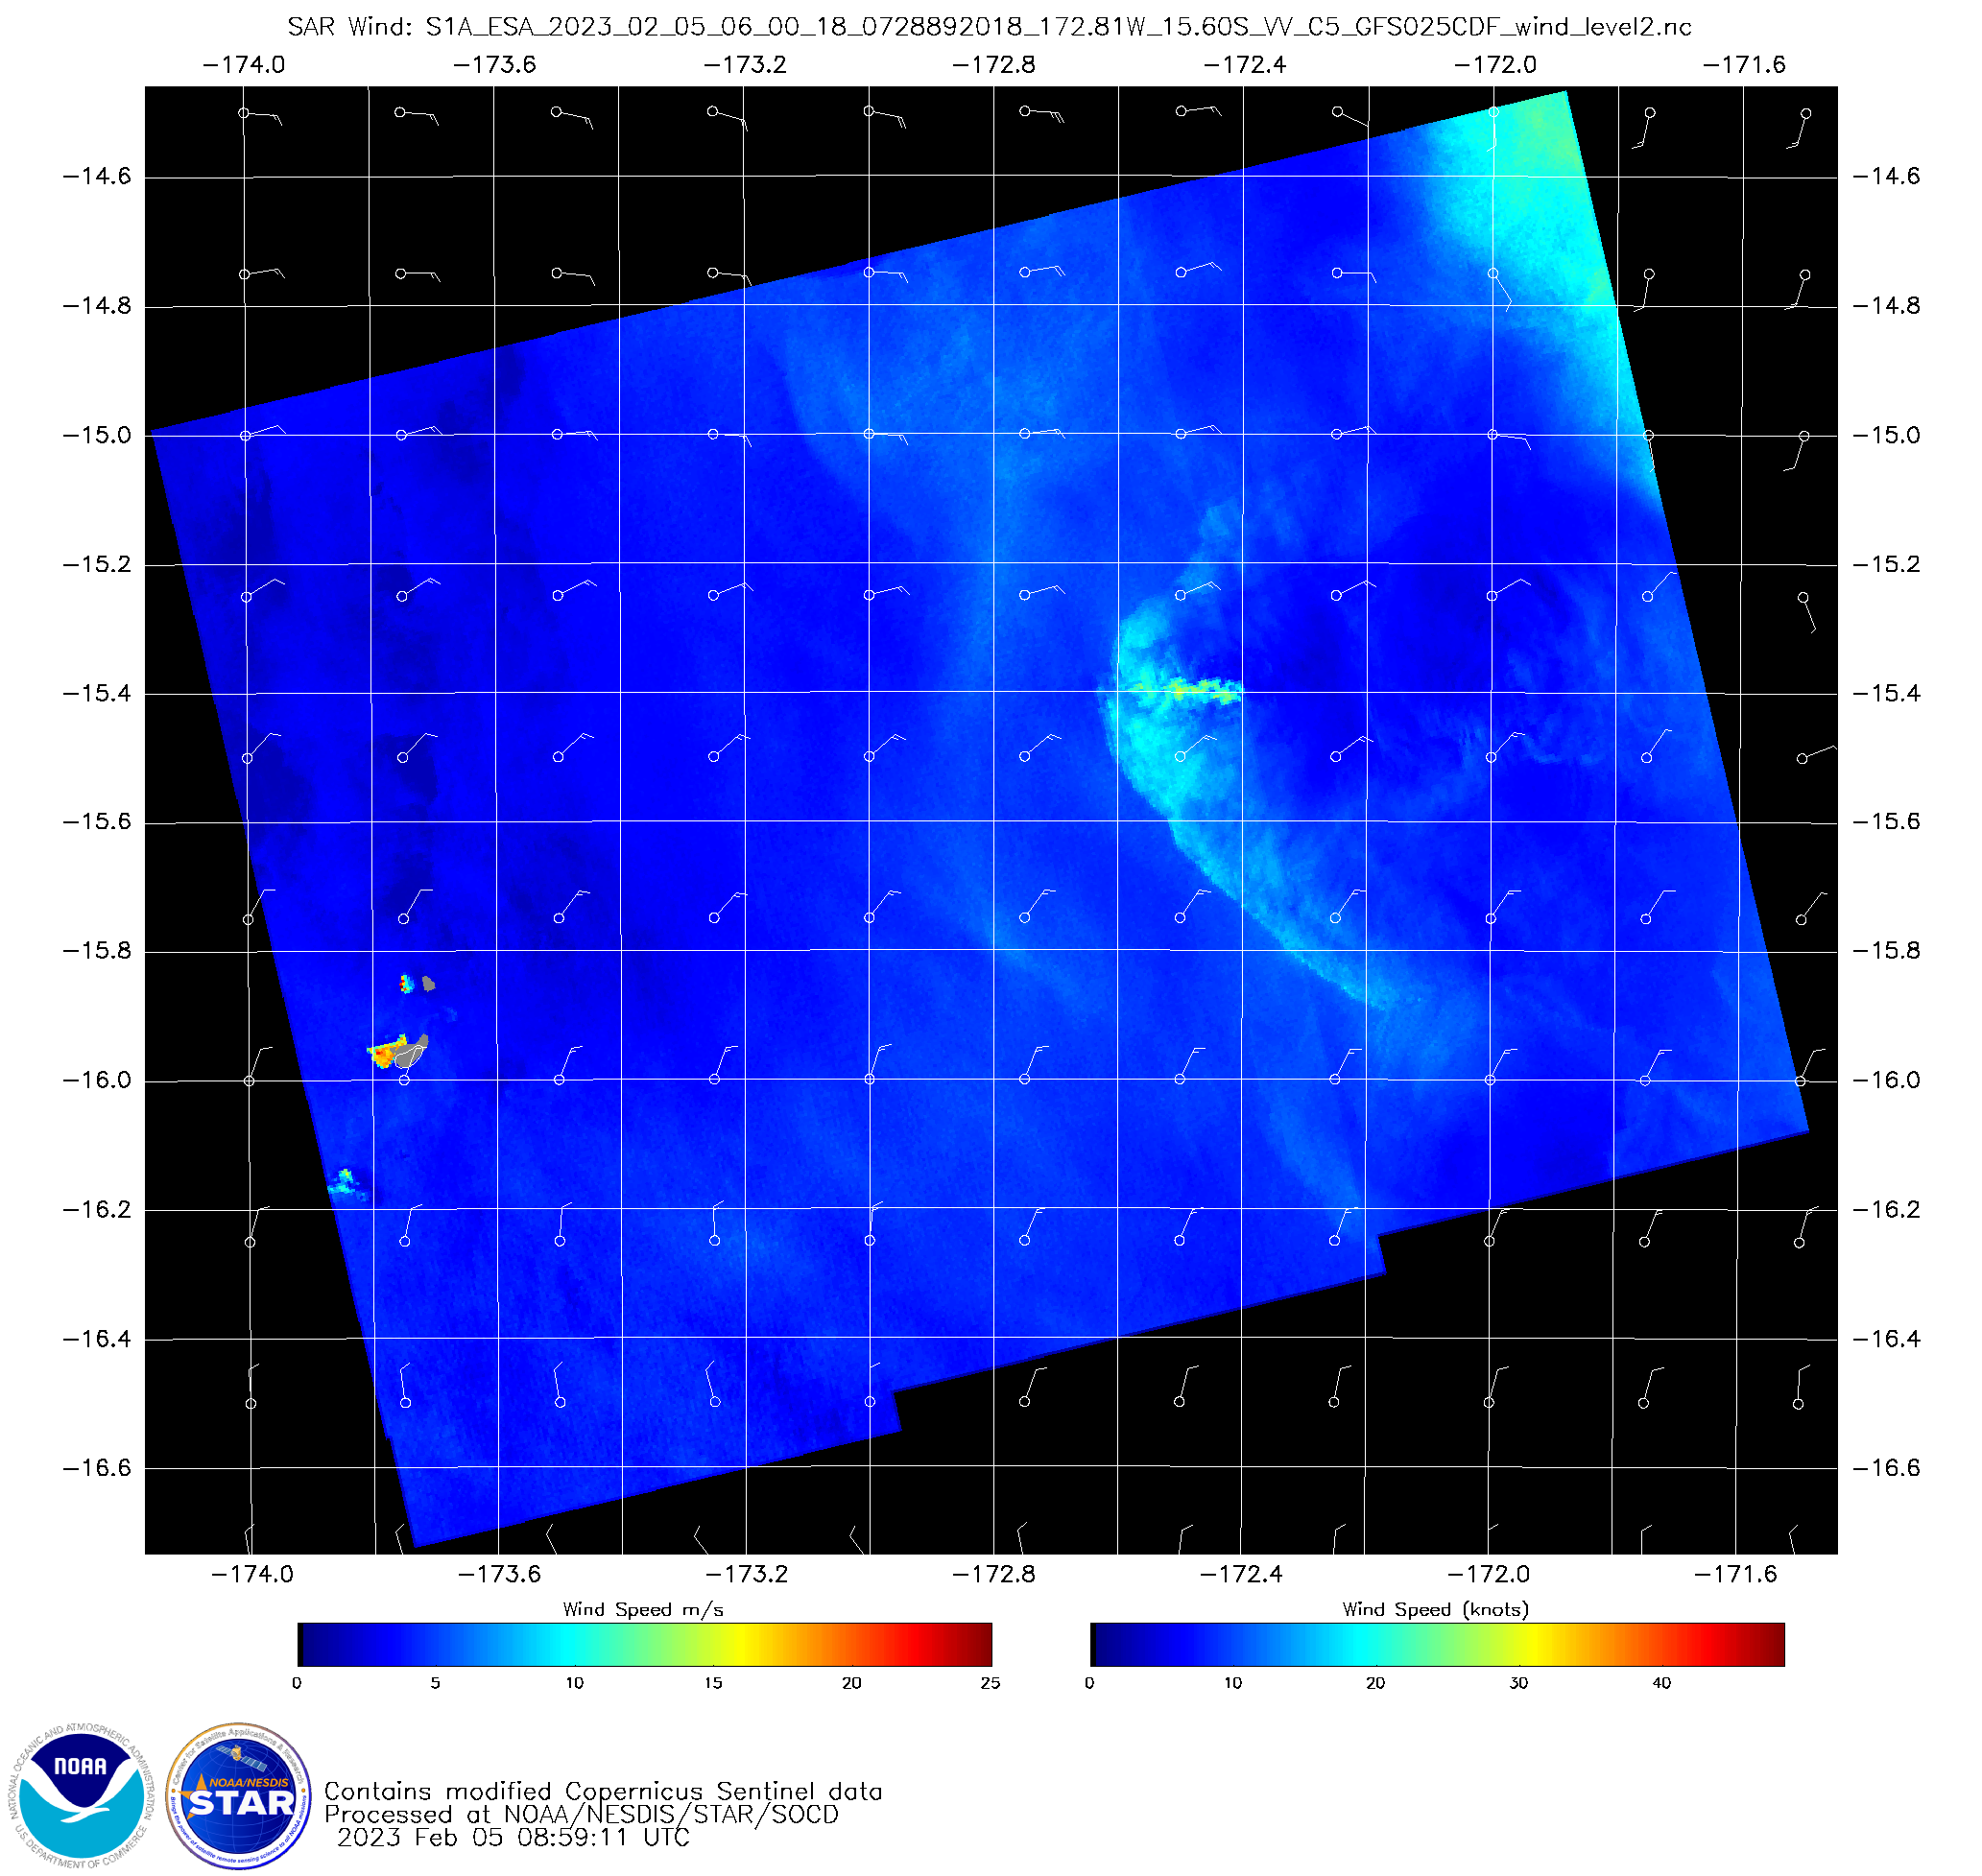
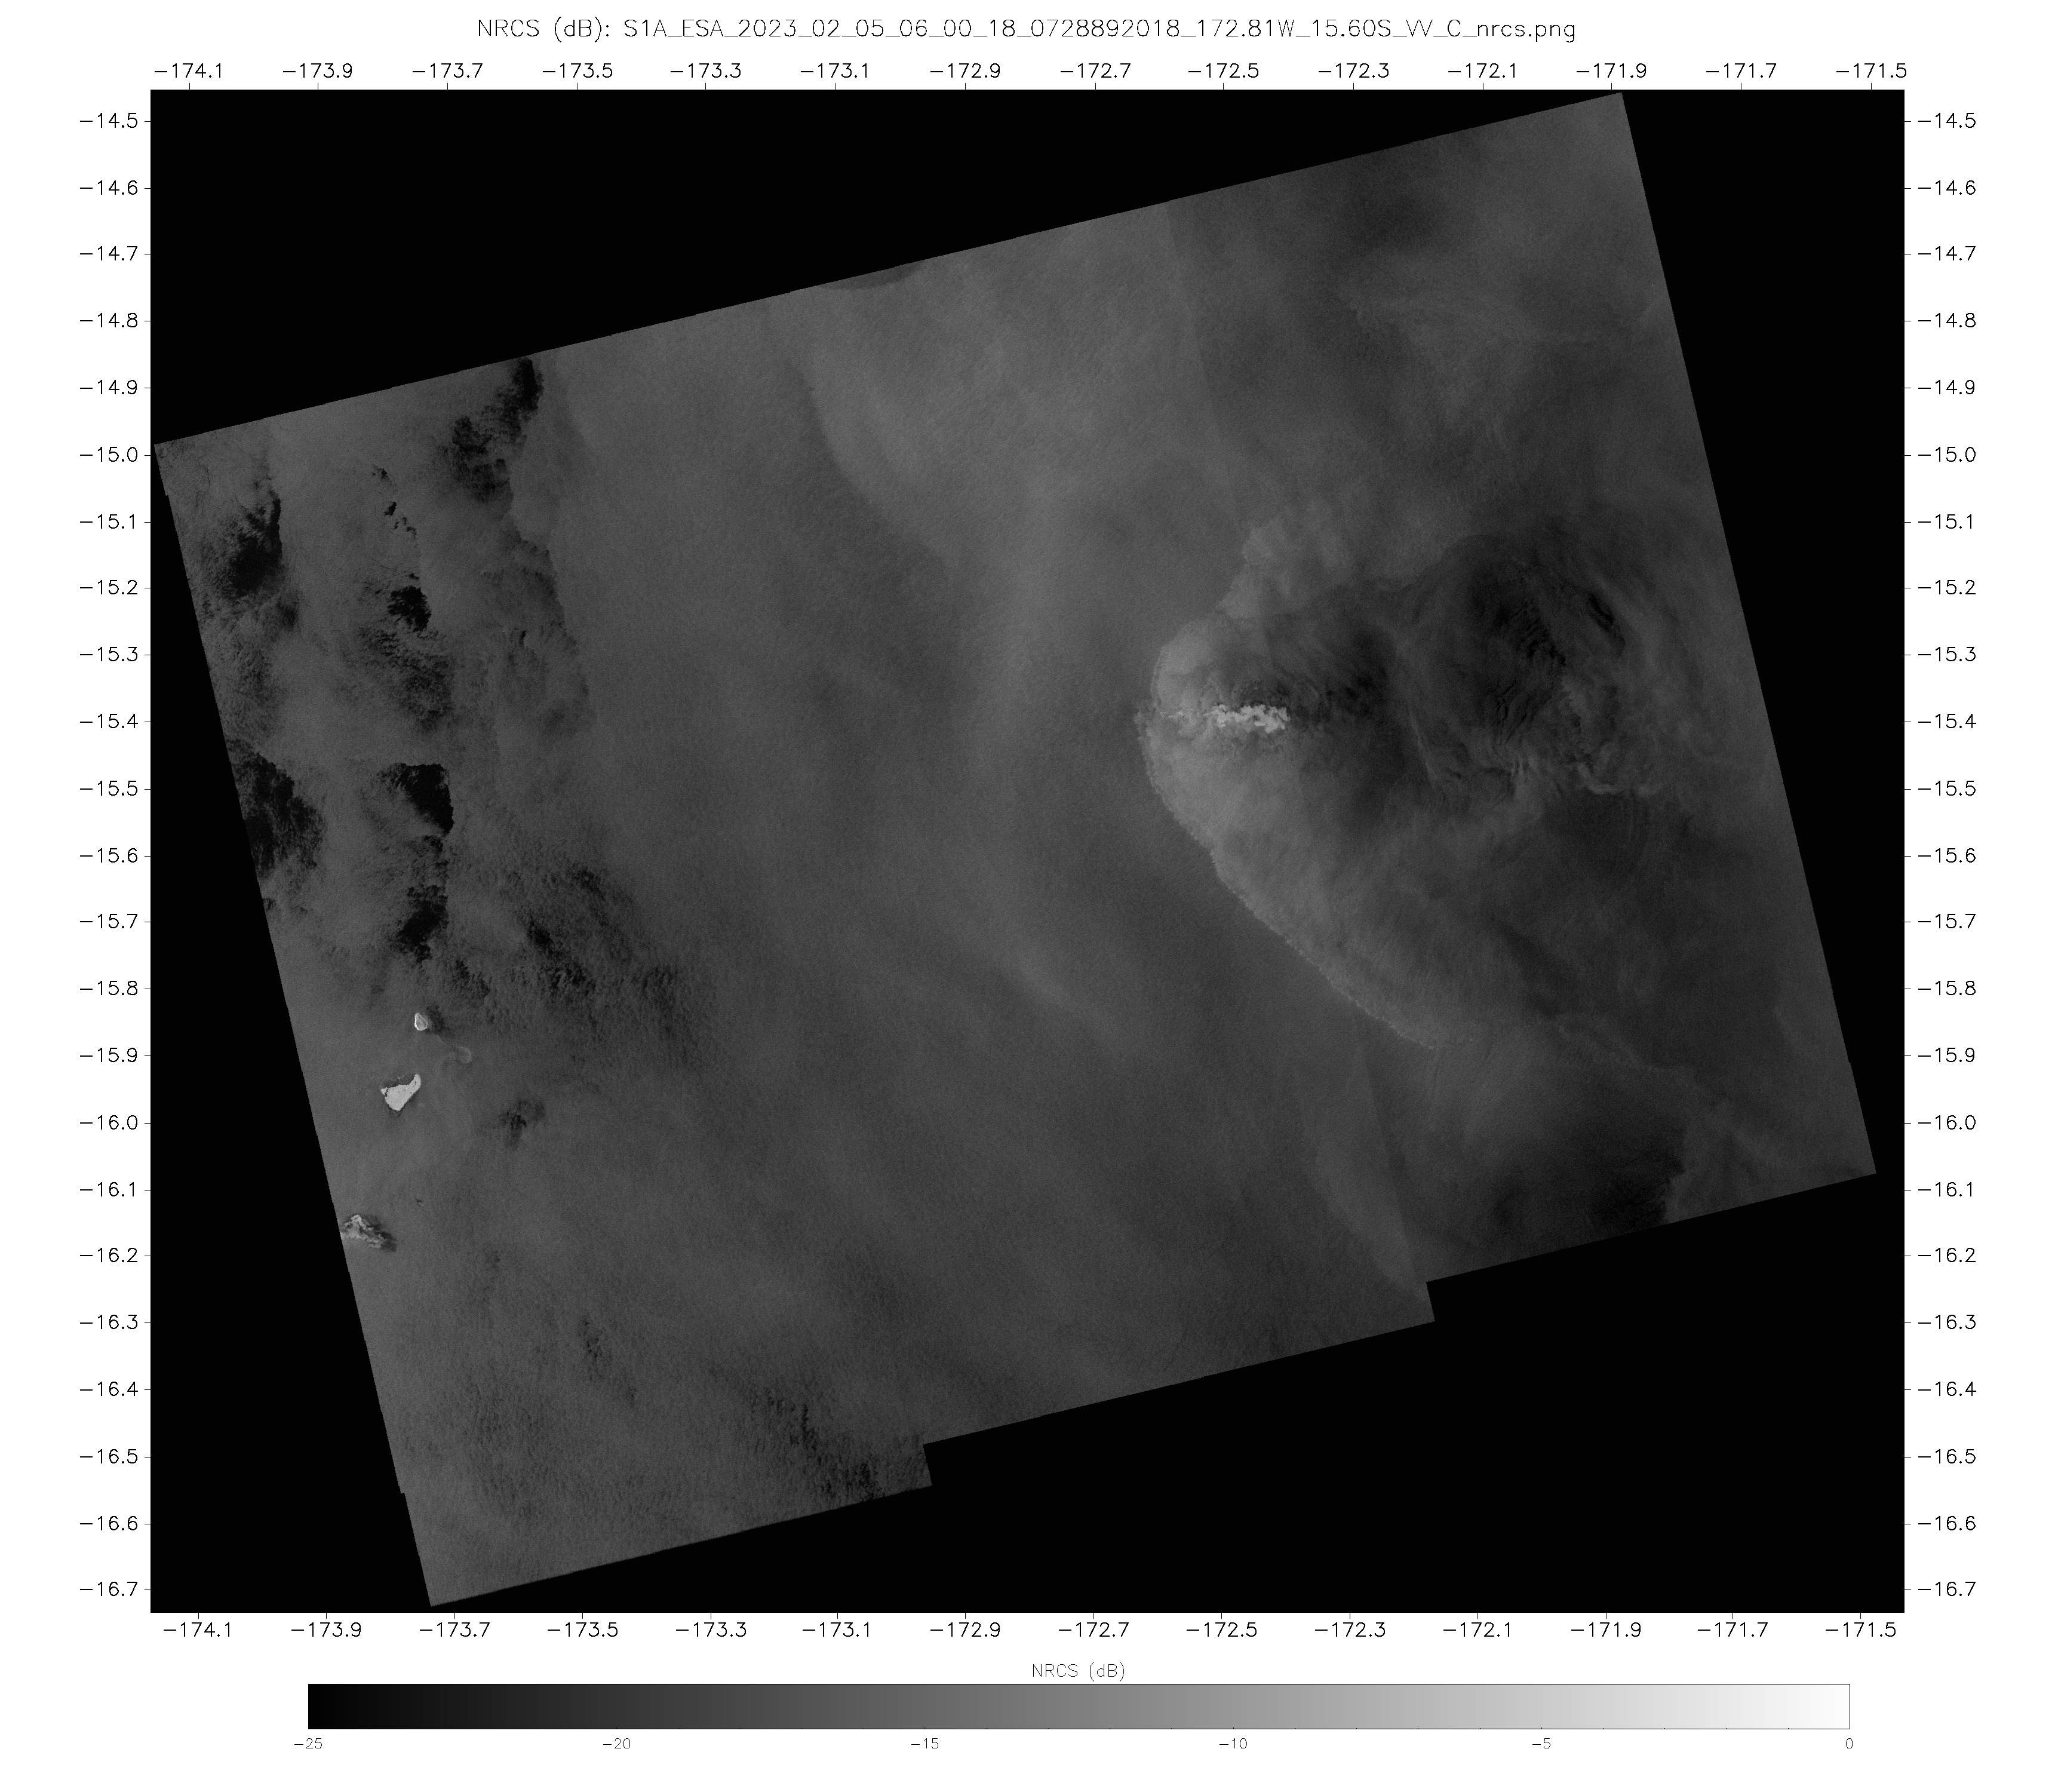
As noted previously, NOAA/STAR has arranged for special Synthetic Aperture Radar (SAR) wind observations over American Samoa during the month of February. Sentinel-1A SAR also provides occasional observations in and around the Samoan islands. The toggle above compares (using imagery from this website) derived wind speed and Normalized Radar Cross Section (NRCS) at 0600 UTC on 5... Read More
Sentinel 1A Derived Wind Speed and Normalized Radar Cross Section, 06:00:18 on 5 February 2023 (click to enlarge)
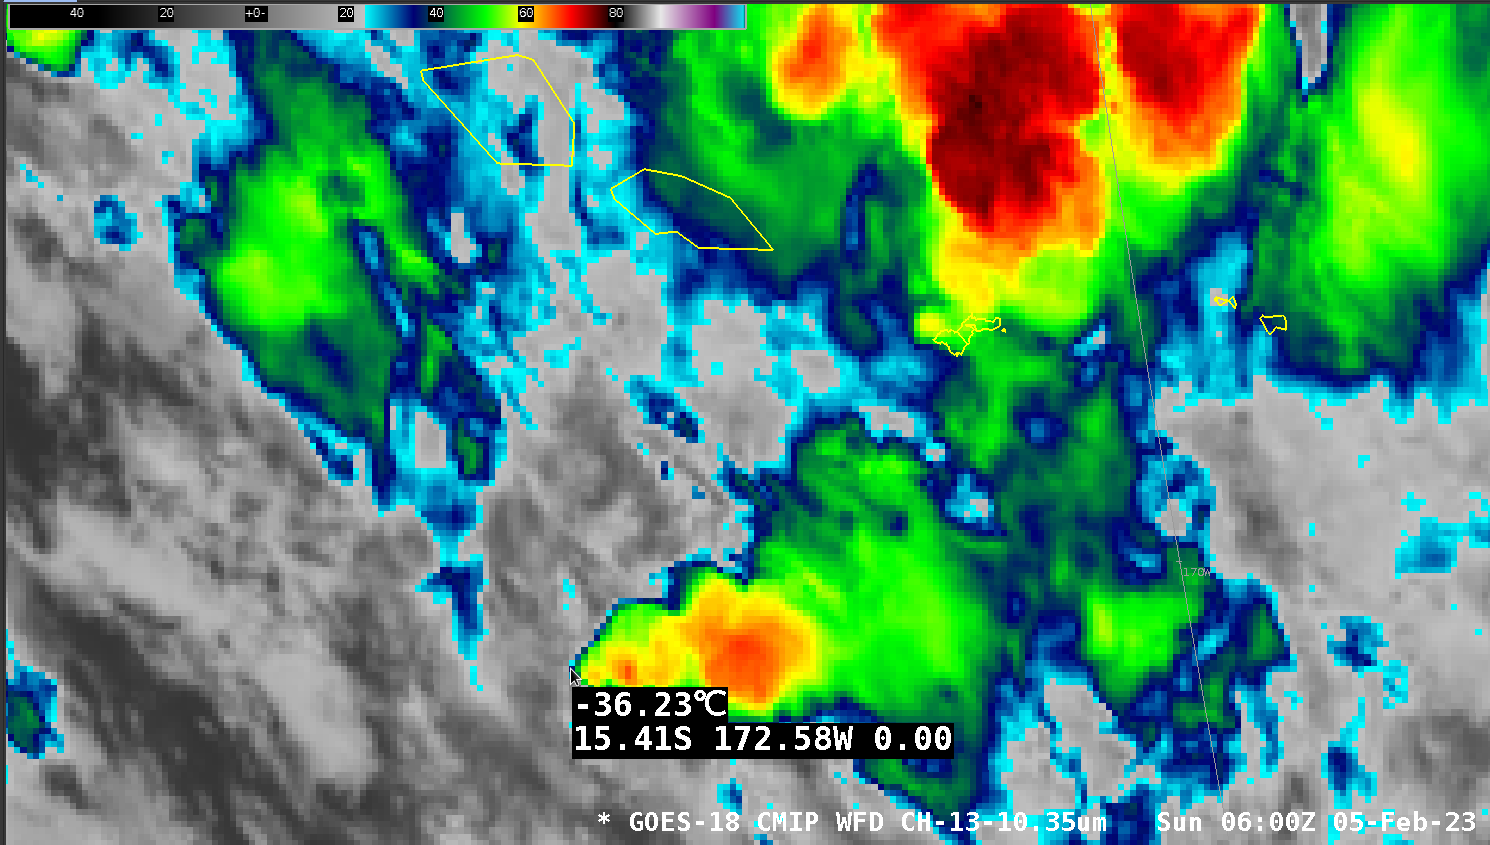
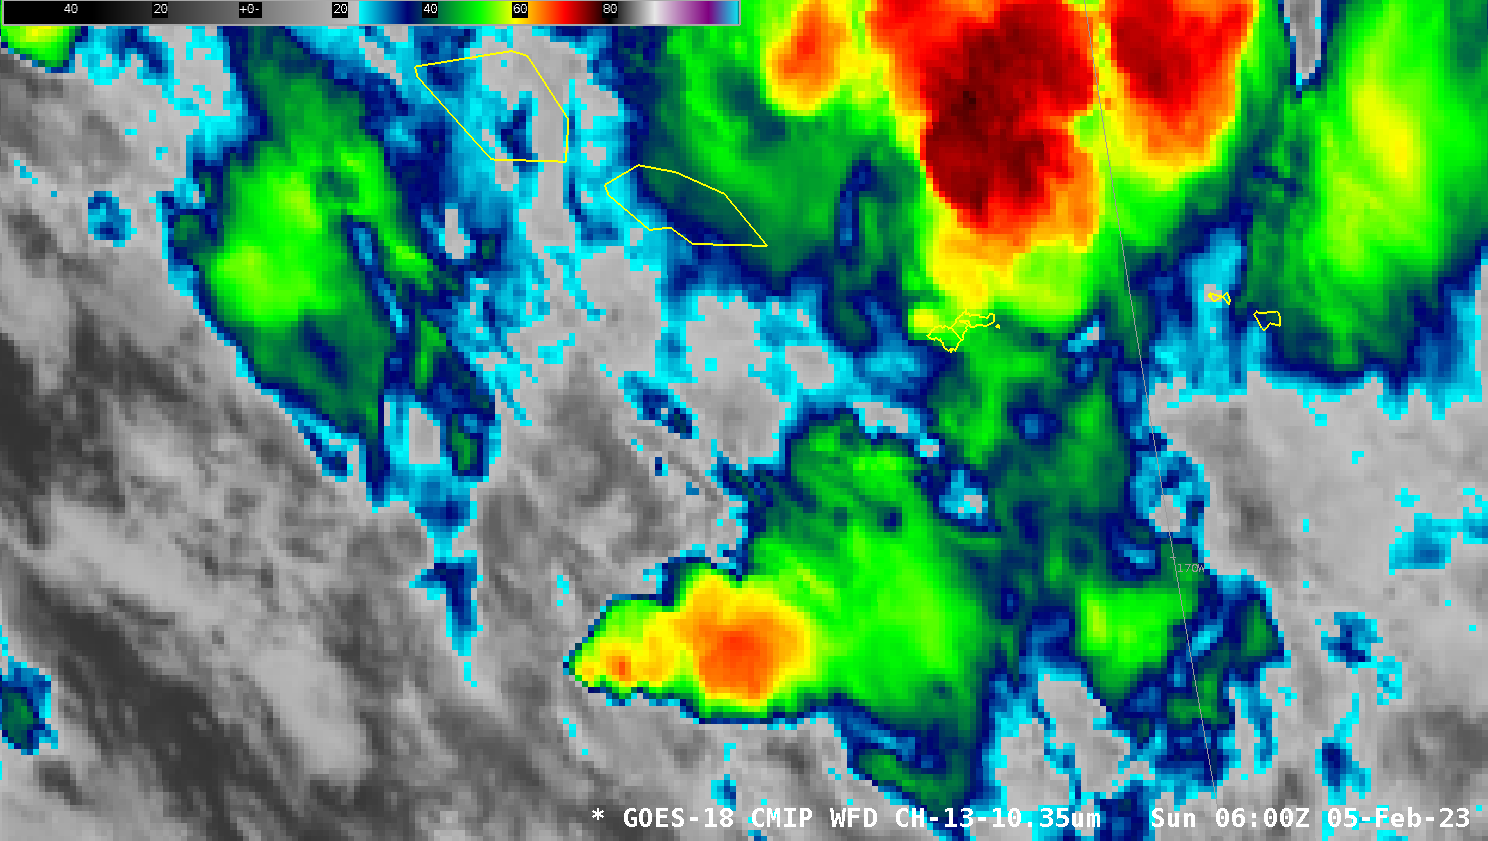
As noted previously, NOAA/STAR has arranged for special Synthetic Aperture Radar (SAR) wind observations over American Samoa during the month of February. Sentinel-1A SAR also provides occasional observations in and around the Samoan islands. The toggle above compares (using imagery from this website) derived wind speed and Normalized Radar Cross Section (NRCS) at 0600 UTC on 5 February 2023; a corresponding GOES-18 Clean Window infrared image is shown below, with the western-most end of a convective feature sampled (Here is the image without the sampling information). The coldest brightness temperatures with that convective complex are in the -61 to -66oC range. (This animation from 0500 to 0750 UTC shows the convection decaying with time).
GOES-18 Clean Window infrared (10.3 µm) imagery, 0600 UTC on 5 February 2023 (Click to enlarge)
Outflow winds with this system are in the 15-20 knot range (bright cyan colors). The strongest derived winds — along 15.4o N in the wind analysis — are a result of ice in the cloud affecting the cloud signal. The NRCS for that region has the feathery characteristic of highly reflective ice crystals.
Sentinel 1A Derived winds (left) and Normalized Radar Cross Section (NRCS) (right), both at 0600 UTC on 5 February 2023 (click to enlarge)
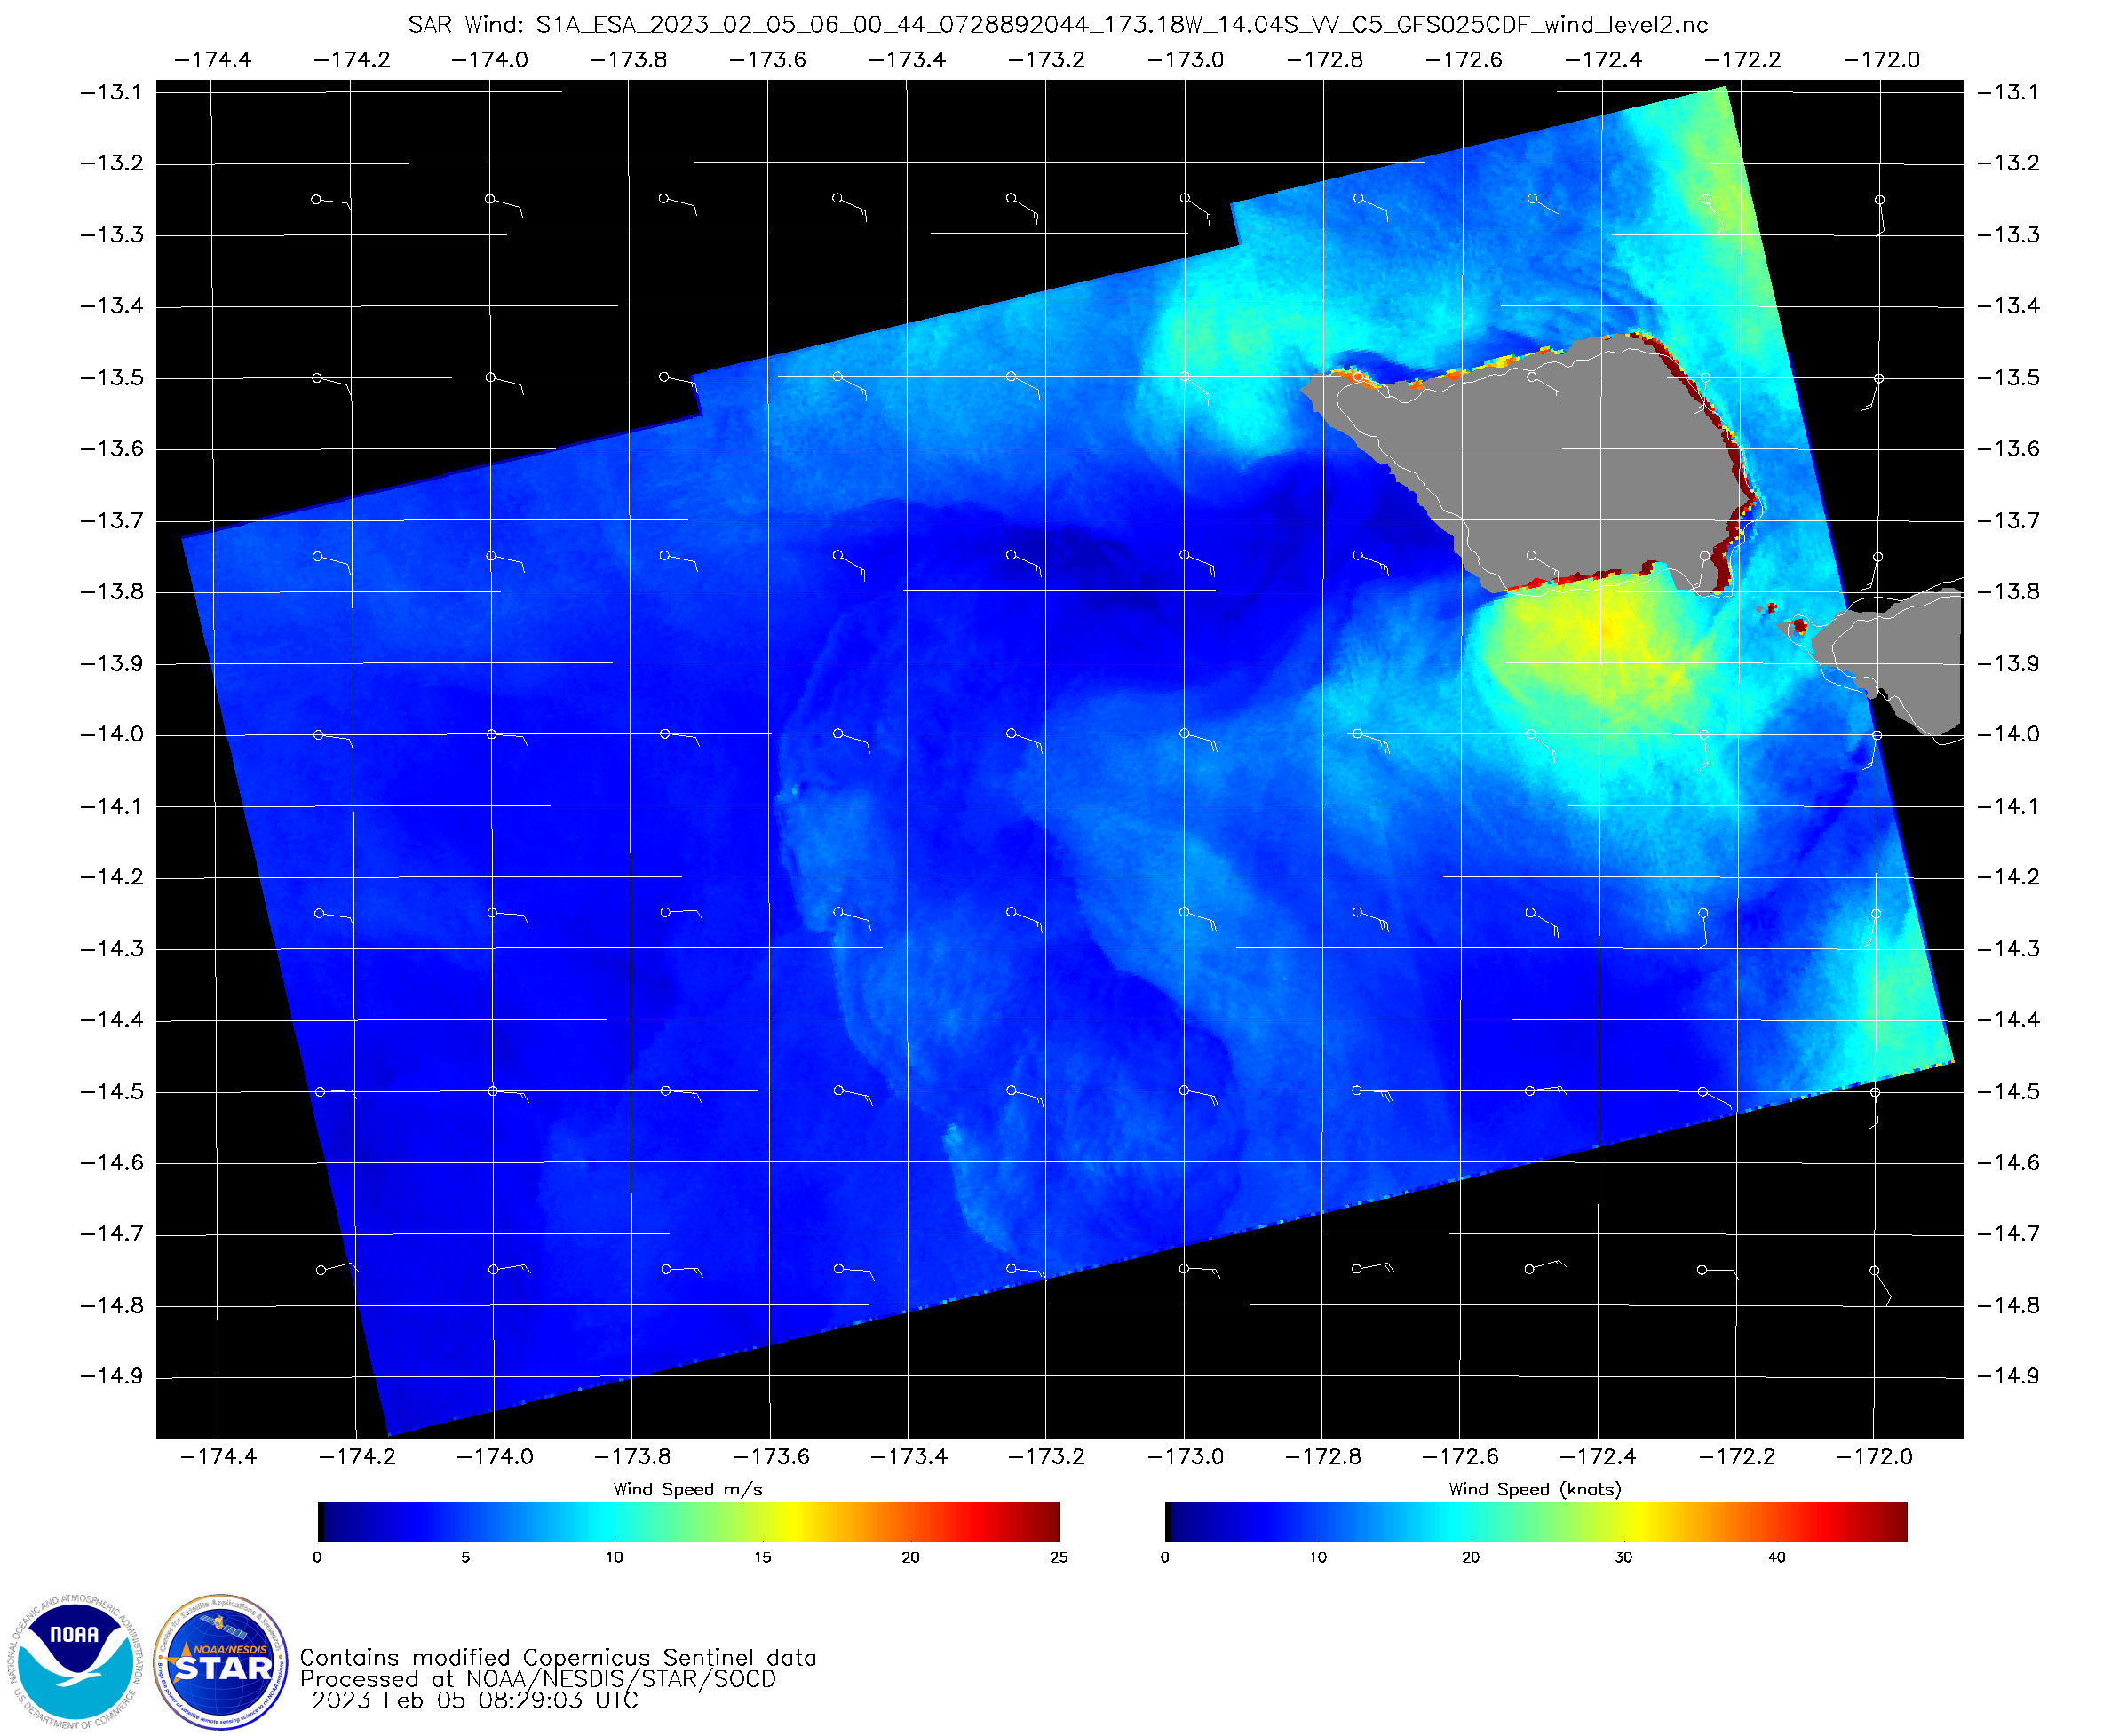
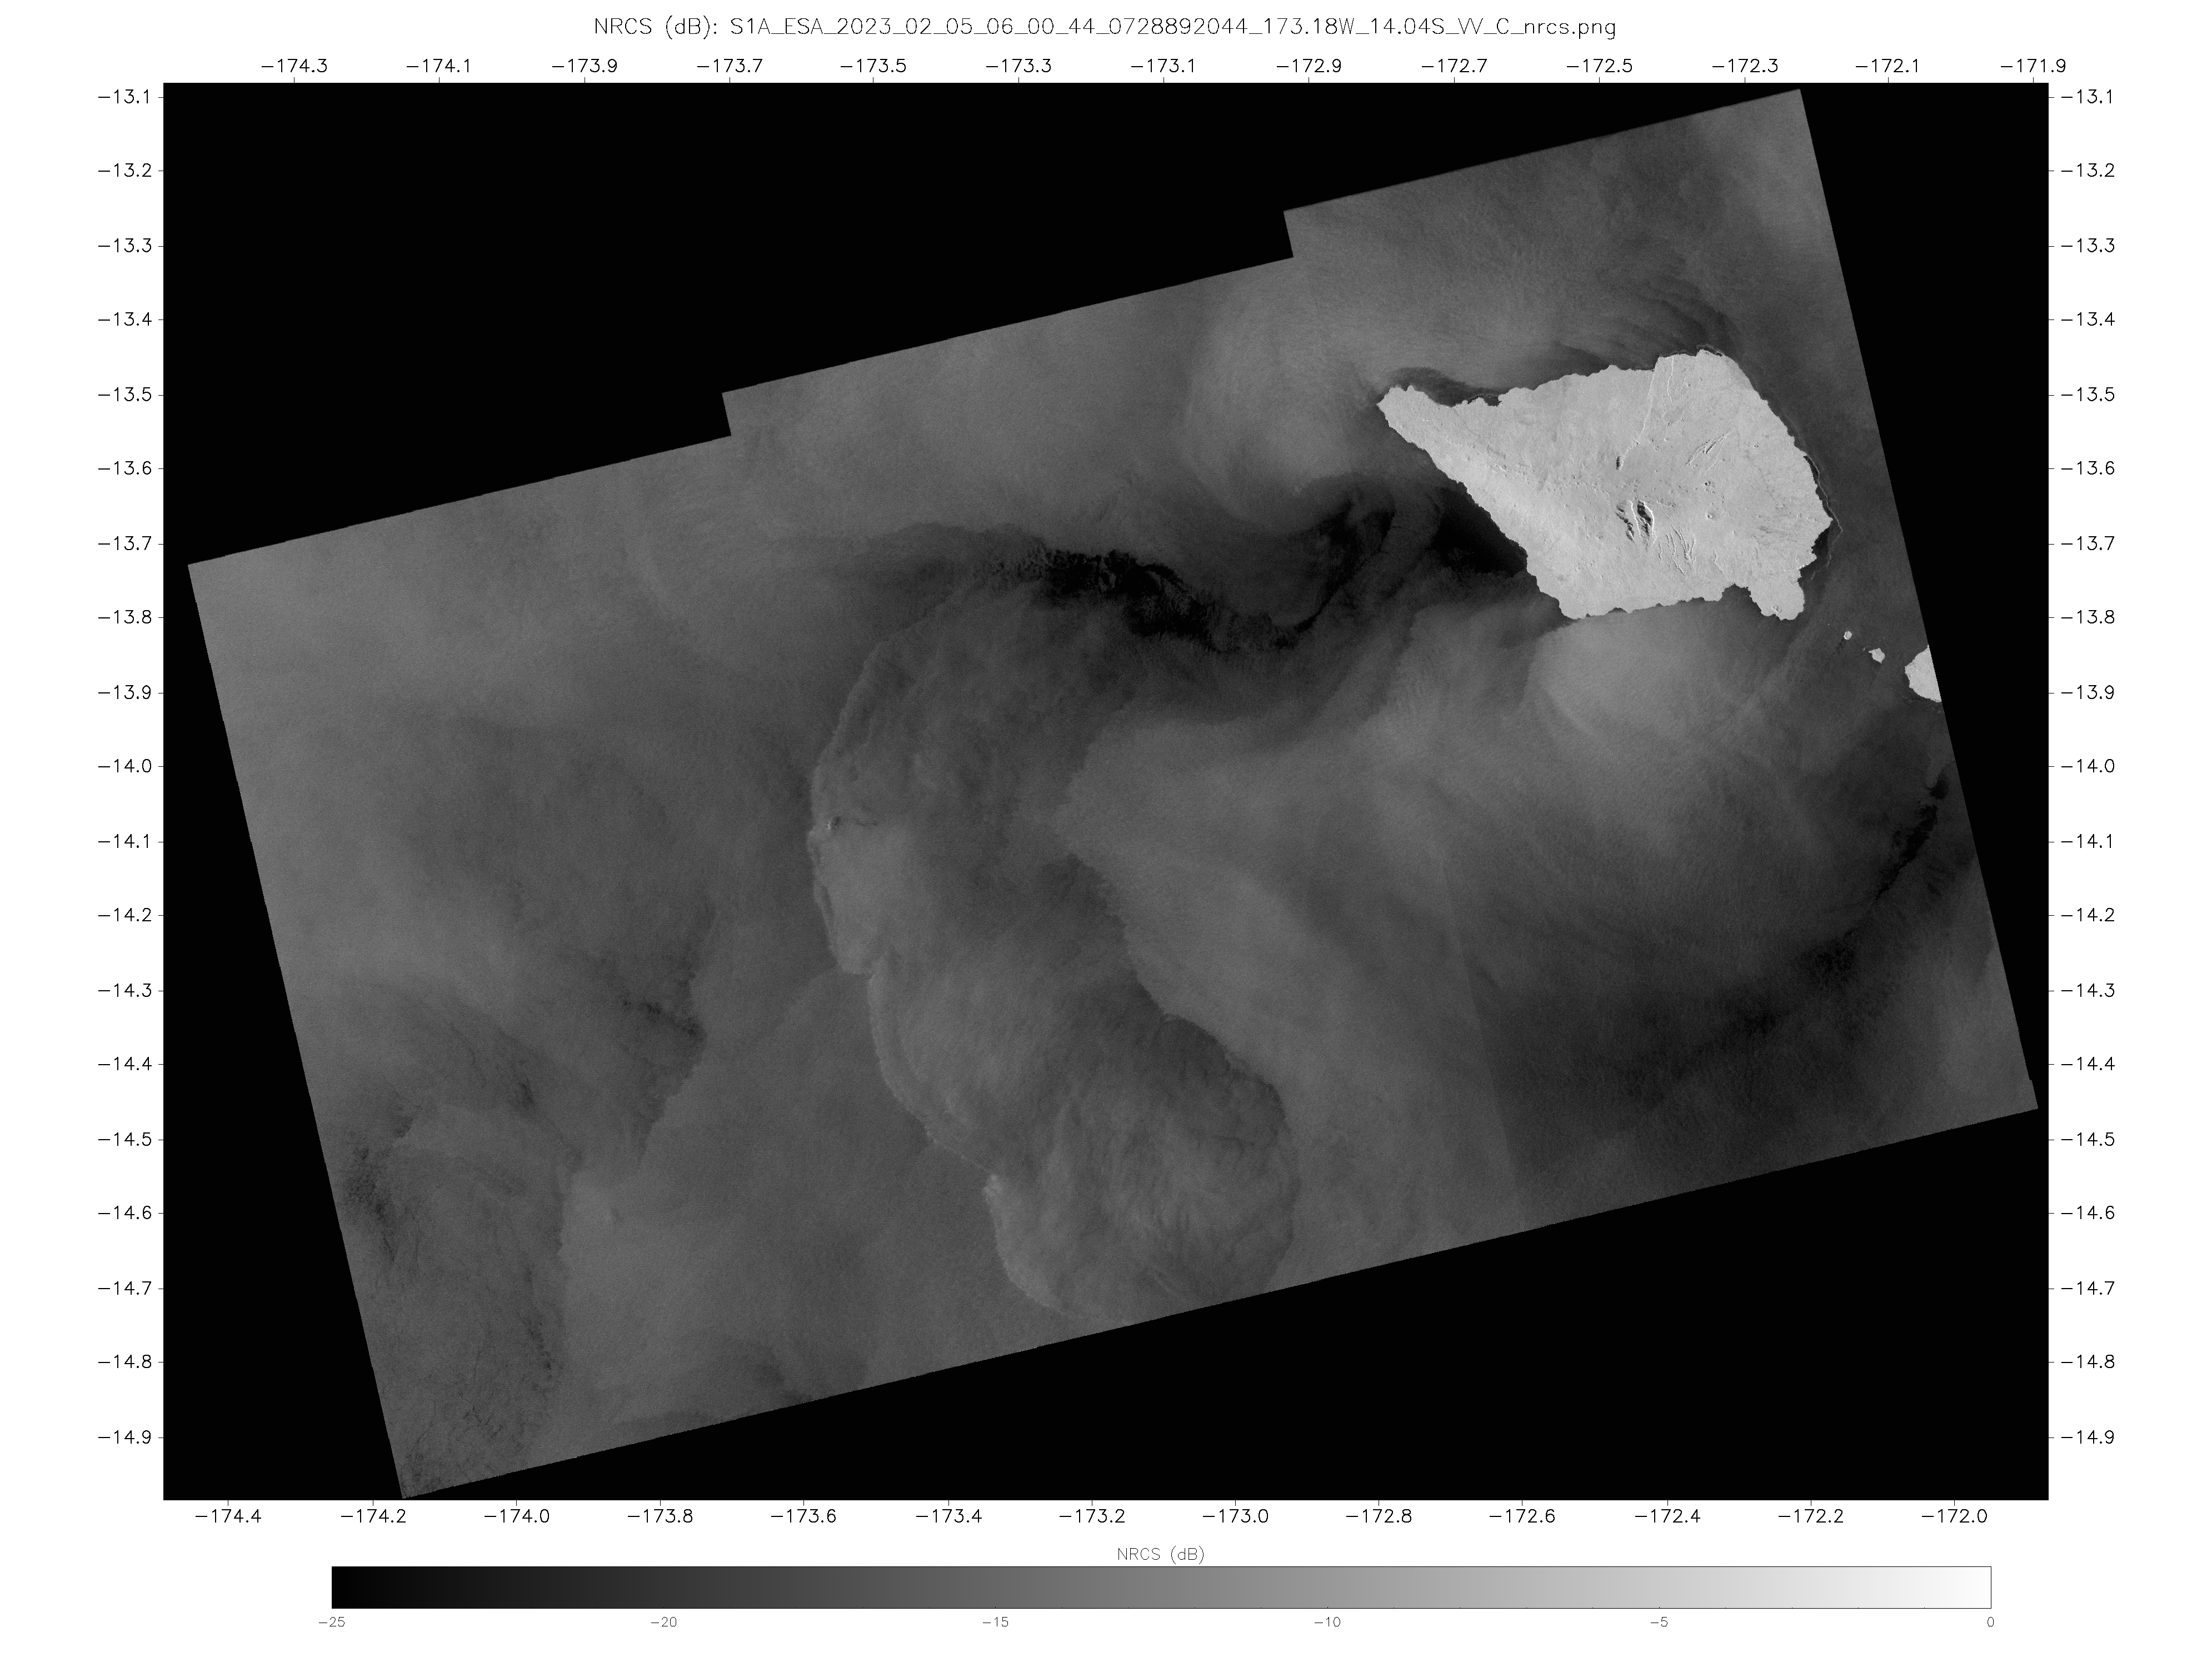
Sentinel-1A continued north, and sampled the waters surrounding Samoa, as shown in the toggle of derived windspeed and NRCS below. The island of Savai’i has an affect on the winds!
Derived Winds and Normalized Radar Cross Section (NRCS) at 06:00:44 on 5 February 2023 (Click to enlarge)
When comparing SAR surface winds and GOES-18 (or any geostationary satellite) imagery, you must make sure to consider the effects of parallax. The satellite information may be parallax-shifted. Thus, the coldest brightness temperatures in the ABI imagery may not align with the region where ice crystals are affecting the SAR signal.
GOES-18 Clean Window infrared (10.3 µm) imagery and Sentinel 1A SAR Winds, 0600 UTC on 5 February 2023 (Click to enlarge)
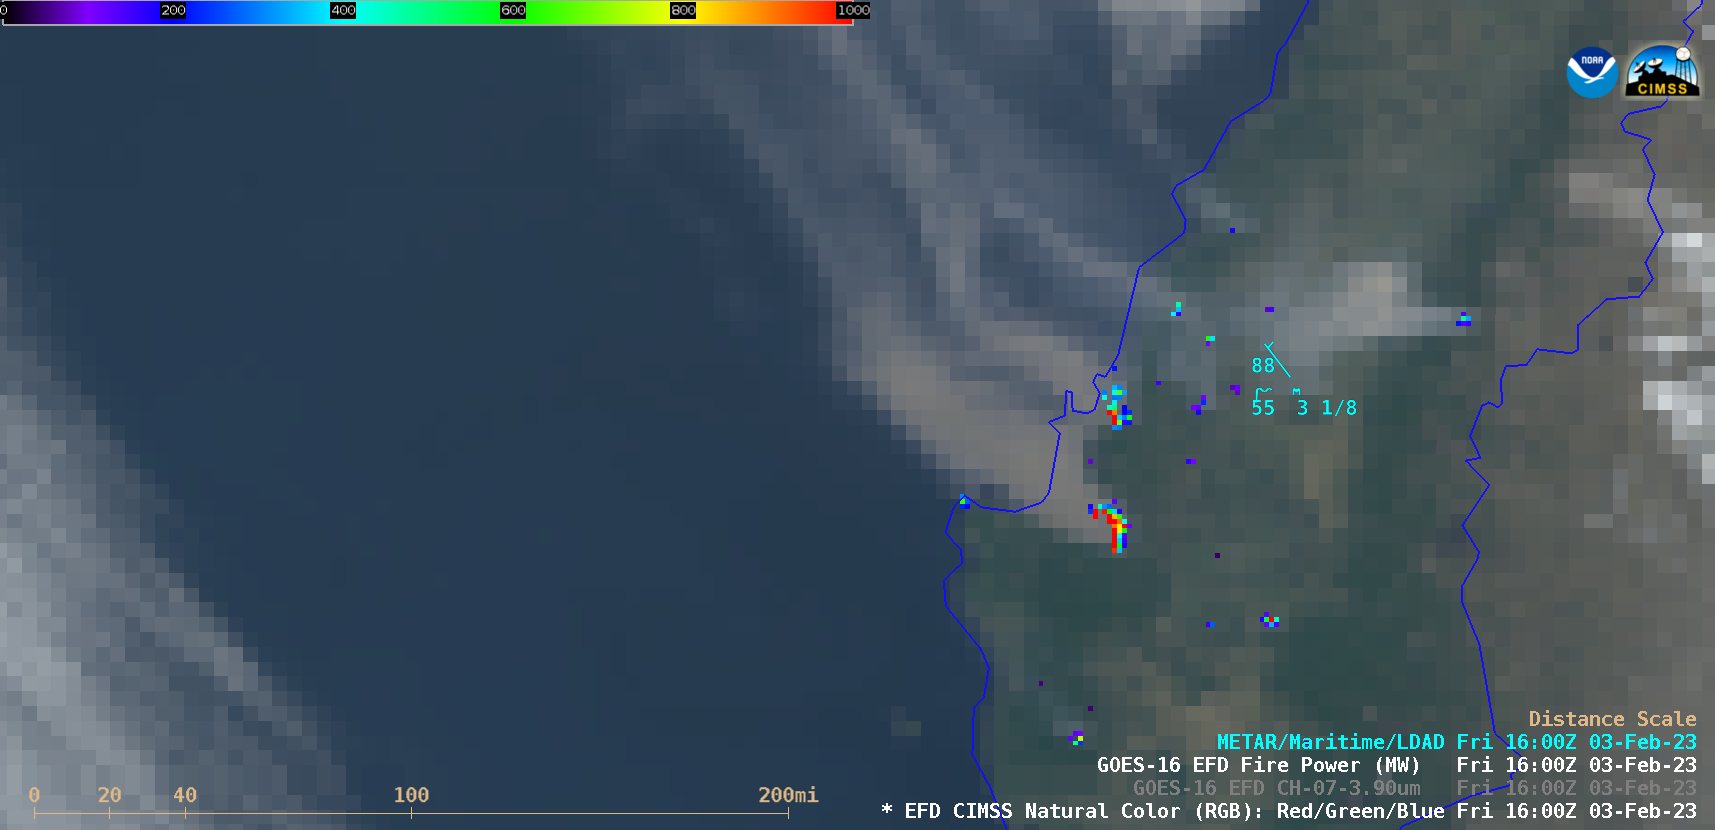
Numerous wildfires were burning near Concepción, Chile during the 02 February – 04 February 2023 period (media report) — GOES-16 (GOES-East) CIMSS Natural Color RGB images combined with the Fire Power derived product (above) showed the diurnal variation of fire thermal signatures along with the dense daytime smoke plumes. The maximum... Read More
GOES-16 CIMSS Natural Color RGB images + Fire Power derived product [click to play animated GIF | MP4]
Numerous wildfires were burning near Concepción, Chile during the 02 February – 04 February 2023 period (media report) — GOES-16 (GOES-East) CIMSS Natural Color RGB images combined with the Fire Power derived product (above) showed the diurnal variation of fire thermal signatures along with the dense daytime smoke plumes. The maximum Fire Power values exceeded 2500 MW with some of the larger fires. Surface reports in the vicinity of the wildfires were sparse and intermittent, but did indicate reductions in visibility due to the dense smoke.


