
Geo2grid software is being updated and version 1.1 will be released shortly. [Update: it is now available here] Users will notice some added features (for example, support for GLM display, and support for some Level 2 products, and GOES-18, Himawari-9 and AGRI data), and will also note faster execution times. This blog post will document some of the features.
The invocation of geo2grid in the linux operating system has not changed. For example, the following command for ABI data: $GEO2GRID_HOME/bin/geo2grid.sh -r abi_l1b -w geotiff --list-products-all -f /path/to/GOESR/level1b/RadianceFiles/*WildcardingToSpecifyOneTime*.nc will list out the products Geo2Grid can create. If all ABI bands are present, this will also include some RGBs: Airmass, Dust, Ash, Fog, Natural Color, Night Microphysics and True Color imagery. These are the Standard Available geo2grid products, and they are shown above for a subset of Himawari-9 AHI imagery — created using the ahi_hsd reader in the command shown below. But first, to allow for the subsecting in this case, a map projection was created using the command p2g_grid_helper, invoked below, that creates a file (Guam.yaml) that includes a map name (Guam), a center longitude/latitude (East/North positive), resolution (meters) in the west-east and north-south direction, and pixel sizes (east-west and north-south). Note: one could also create a mapping around the island of Guam using the –ll-bbox (latitude/longitude bounding box) keyword in geo2grid.
$GEO2GRID_HOME/bin/p2g_grid_helper.sh Guam 144.8 13.7 500 -500 960 720 > $GEO2GRID_HOME/Guam.yaml

$GEO2GRID_HOME/bin/geo2grid.sh -r ahi_hsd -w geotiff -p B01 B02 B03 B04 B05 B06 B07 B08 B09 B10 B11 B12 B13 B14 B15 B16 airmass ash dust fog natural_color night_microphysics true_color -g Guam --grid-configs $GEO2GRID_HOME/Guam.yaml -f /where/is/the/data/himawari09/2022/2022_12_07_341/1200/*FLDK*.DAT
The geo2grid call to make imagery call is shown above, executed from within the $GEO2GRID_HOME/bin/ directory. The -g Guam tells the software to subsect (using nearest-neighbor resampling) to the grid defined by that name, and the –grid-configs tells the software where the definitions sit. In this case, a lot of different files are created, although some might be dark — visible imagery at 1200 UTC over Guam will show night time. (ImageMagick has been used to label the imagery, and images with reflective channels aren’t shown).
The command above will generate geotiff files, with no georeferencing burned into the image. That can be added with a command such as this one: $GEO2GRID_HOME/bin/add_coastlines.sh --add-coastlines --coastlines-resolution f --coastlines-level 5 --add-grid --grid-D 5.0 5.0 --grid-d 5.0 5.0 --grid-text-size 16 *120000*Guam.tif ; This command will add coastlines (with a specified resolution, and a specified level) and also a latitude/longitude grid at 5-degree intervals — that are labeled with a specified size (16); “minor” tics — unlabeled — are shown every 5 degrees as well. This is done for every .tif file that matches the wildcarding, and the output are identically-named .png files. That is to say: the original .tif files are not changed.
A similar animation is shown below, but from 12 hours earlier (i.e., at 0000 UTC) to show the images/RGBs that include reflective channel data (Bands 1-6). This is also over a larger region, created this way: $GEO2GRID_HOME/bin/p2g_grid_helper.sh Guam 144.8 13.7 1000 -1000 1120 840 > $GEO2GRID_HOME/Guam.yaml ; thus the imagery could be created with the same call as above (but with 0000 UTC data substituted for 1200 UTC data). The add_coastlines.sh command has been used too.
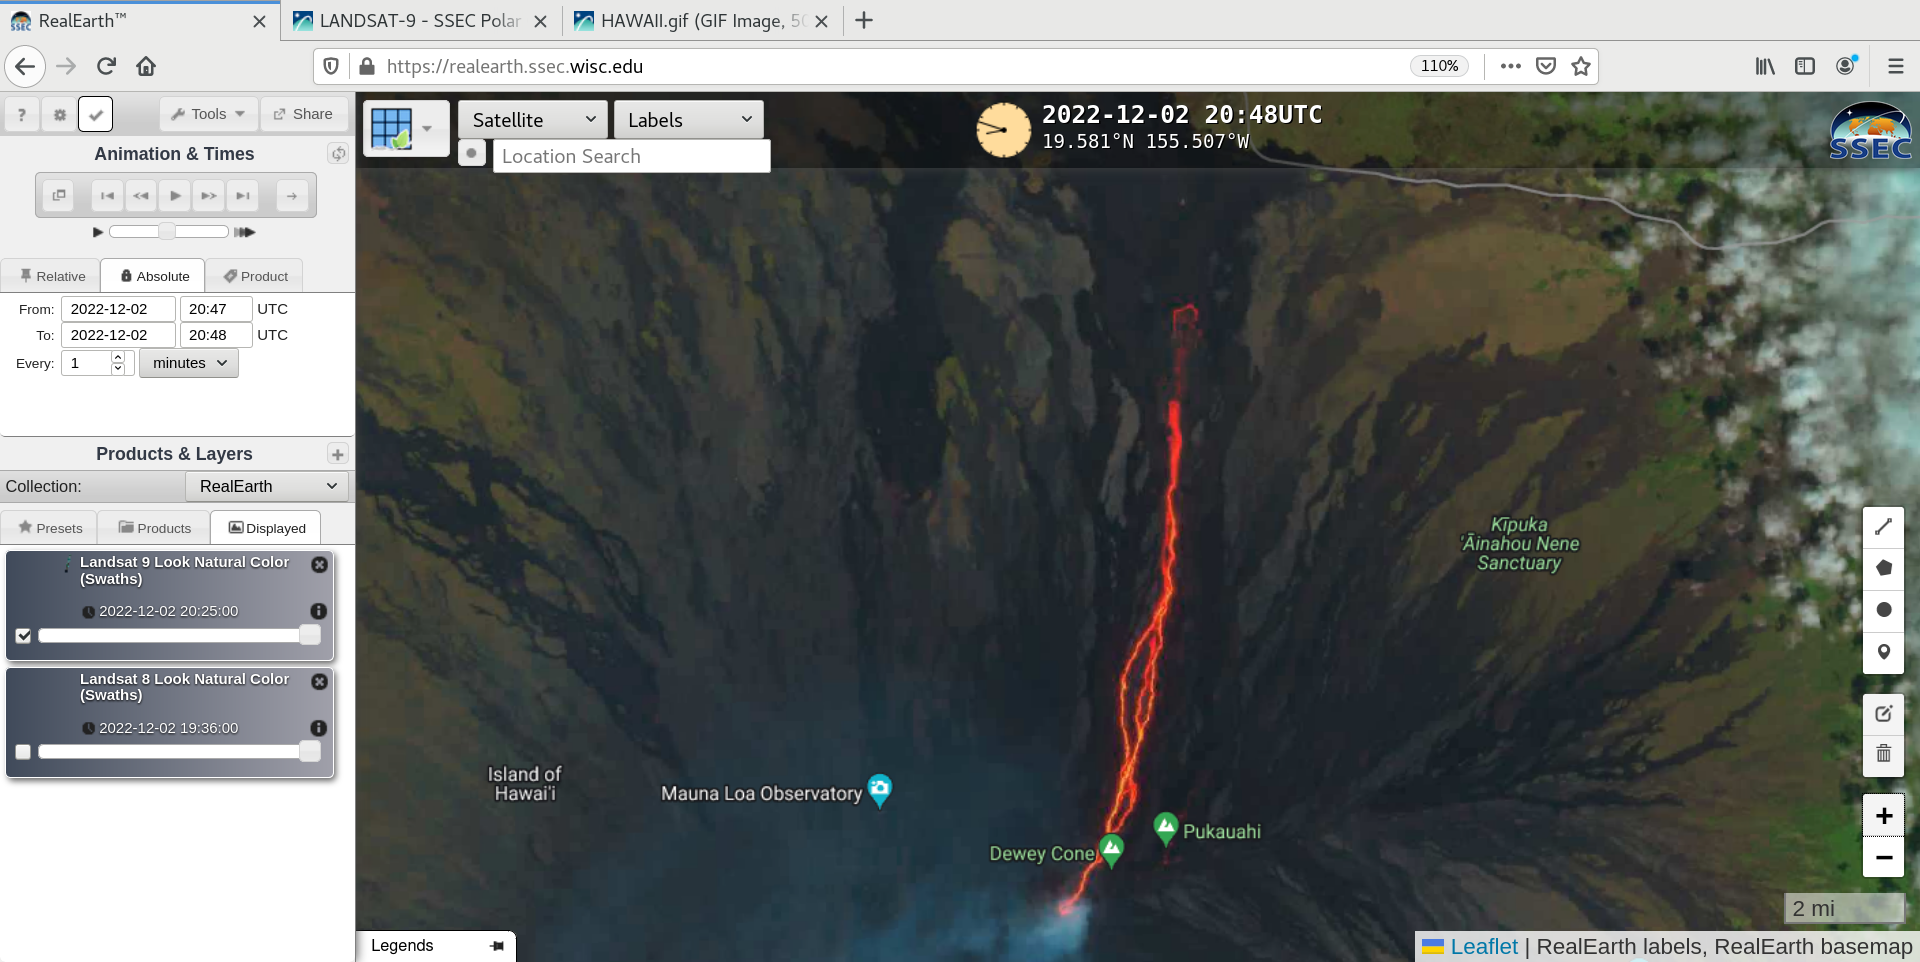
Geo2grid also allows for single images that show two products that change at the terminator. An easily viewable example of that type of product can be viewed at the CSPP Geosphere site, where the default is sharpened True Color imagery in daytime and Night Microphysics RGB at nighttime, as shown below, and at this link.
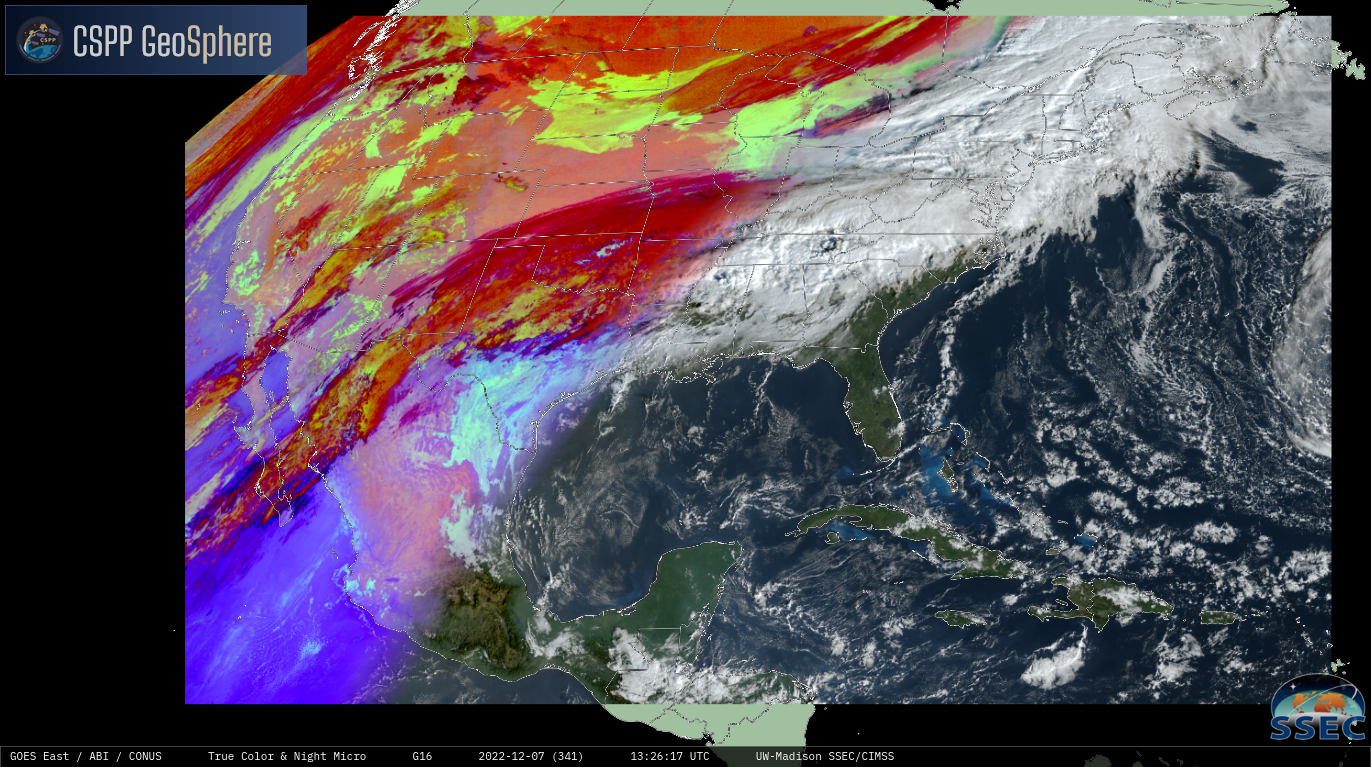
It’s simple to create new twinned products to display as well, once a user becomes familiar with plain-language yaml files used. For example, image composites that show different ABI products based on the terminator are defined here: $GEO2GRID_HOME/libexec/python_runtime/etc/polar2grid/composites/abi.yaml ($GEO2GRID_HOME is the linux directory that holds the Geo2Grid software; there are similar files for AHI; AMI and AGRI files can be created). The default version of the file is shown (in black) below, defining the product ‘true_color_night’ as True Color imagery during the day, and C14 (Band 14, 11.2 µm) at night. I’ve also added a different definition in red (“rgb_color_night”) that displays the Night Microphysics RGB at night, and the Convection RGB during the day time. To create the image, use -p rgb_color_night in the geo2grid call.
sensor_name: visir/abi
composites:
true_color_night:
compositor: !!python/name:satpy.composites.DayNightCompositor
prerequisites:
- true_color
- C14
standard_name: day_night_mix
rgb_color_night:
compositor: !!python/name:satpy.composites.DayNightCompositor
prerequisites:
- convection
- night_microphysics
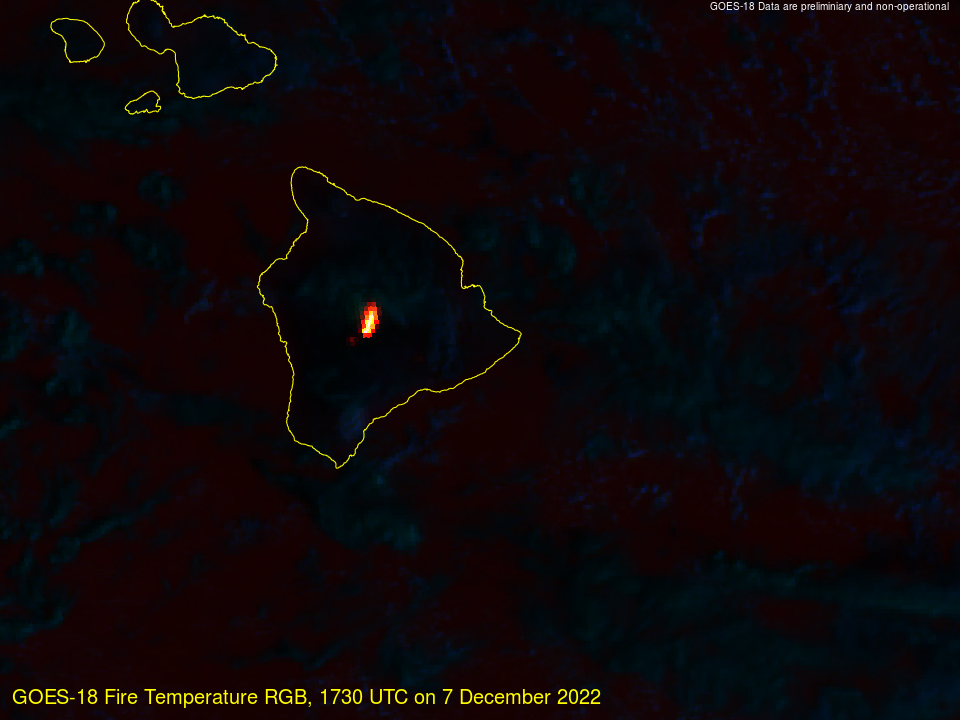
standard_name: rgb_convect_daynightThe list of RGBs available is extensive, and can be added to by adding definitions to the abi.yaml files (or ahi.yaml) in the composites and enhancements subdirectories here: $GEO2GRID_HOME/libexec/python_runtime/etc/polar2grid/ . (For examples to help you with the formatting, look at (but do not change!) the abi.yaml files found under $GEO2GRID_HOME/libexec/python_runtime/lib/python3.10/site-packages/satpy/etc/). An example of a created RGB is shown below: the Fire Temperature RGB over Mauna Loa using GOES-18 data. (GOES-18 data are preliminary and non-operational).
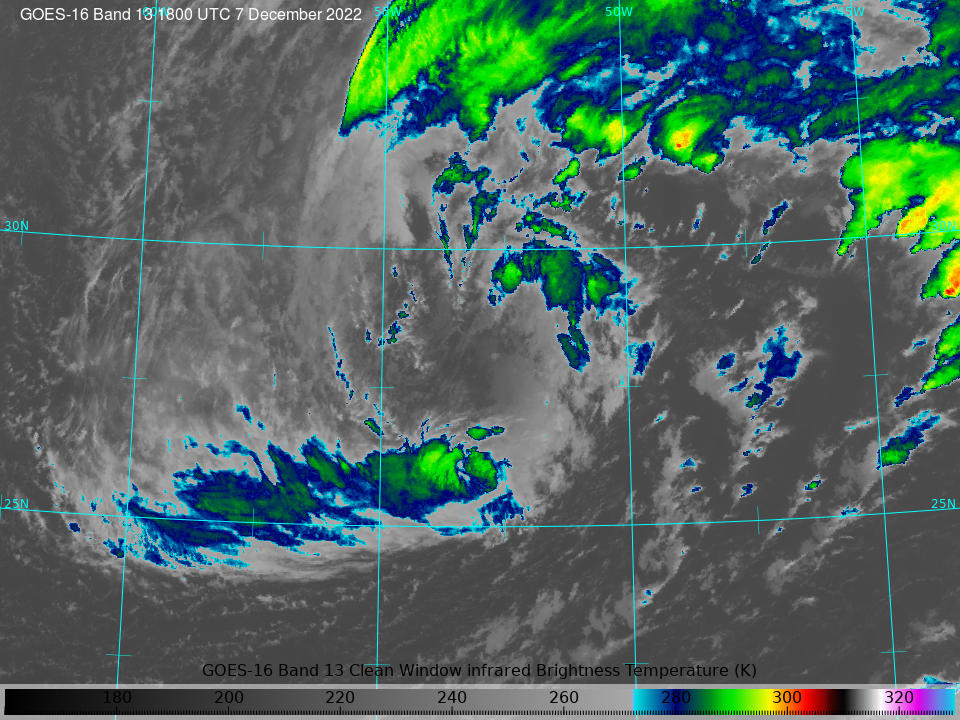
Single-banded IR data shown above are presented with a greyscale enhancement. It is possible to create enhancements, add them, and then display a colorbar. Consider the 1800 UTC Band 13 GOES-16 image below over a cyclone over the central Atlantic. This was created with these three geo2grid commands (and 1 ImageMagick command at the end to annotate):
$GEO2GRID_HOME/bin/p2g_grid_helper.sh SubTrop -53.0 28.0 2000 -2000 960 720 > $GEO2GRID_HOME/SubTrop.yaml

$GEO2GRID_HOME/bin/geo2grid.sh -r abi_l1b -w geotiff -p C13 -g SubTrop --grid-configs $GEO2GRID_HOME/SubTrop.yaml -f /directory/to/data/goes16/2022/2022_12_07_341/abi/L1b/RadF/*s20223411800*

$GEO2GRID_HOME/bin/add_coastlines.sh --add-coastlines --coastlines-level 6 --coastlines-resolution f --add-grid --grid-D 5.0 5.0 --grid-d 1.0 1.0 --grid-text-size 12 *SubTrop*.tif

convert GOES-16_ABI_RadF_C13_20221207_180020_SubTrop.png -gravity southwest -fill white -pointsize 16 -annotate +10+10 "GOES-16 Band 13 1800 UTC 7 December 2022" GOES-16_ABI_RadF_C13_20221207_180020_SubTropT.png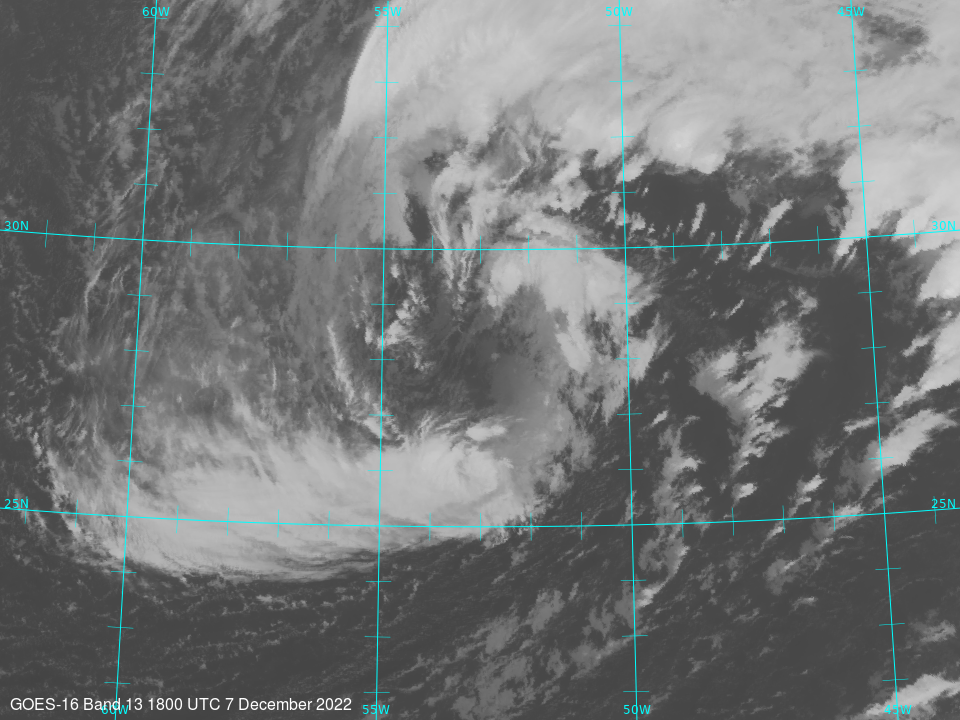
Color enhancement files for geo2grid are text files that specify colors for 256 different greyscales. (If you don’t specify all 256 levels, geo2grid will interpolate between values). For example, one of the text files I created includes this line: 205,250,250,0,255 ; the values are greyscale, red, green, blue, alpha; for this case, a greyscale value of 205 (a pretty bright white) is color-enhanced as fully opaque yellow. Similarly, the line 215,255,0,0,255 says that a greyscale of 215 will be changed to red. The following commands will color-enhance the geotiff, and then add a colorbar and latitude/longitude lines, as well as a line of annotation.
$GEO2GRID_HOME/bin/add_colormap.sh ../../enhancements/IR13_AWIPSAPPROX.txt GOES-16_ABI_RadF_C13_20221207_180020_SubTrop.tif

$GEO2GRID_HOME/bin/add_coastlines.sh GOES-16_ABI_RadF_C13_20221207_180020_SubTrop.tif --add-grid --grid-D 5.0 5.0 --grid-d 2.5 2.5 --grid-text-size 12 --add-colorbar --colorbar-text-color="black" --colorbar-title="GOES-16 Band 13 Clean Window infrared Brightness Temperature (K)" --colorbar-tick-marks 20 --colorbar-min 330 --colorbar-max 160 --colorbar-text-size 16 --colorbar-height 36 --colorbar-align bottom

convert GOES-16_ABI_RadF_C13_20221207_180020_SubTrop.png -gravity northwest -fill white -pointsize 16 -annotate +20+20 "GOES-16 Band 13 1800 UTC 7 December 2022" GOES-16_ABI_RadF_C13_20221207_180020_SubTropT.png
This yields the image shown below. [Added: An earlier version had mislabled colorbafs: –colorbar-min labels the value on the left-hand side and –colorbar-max is the label on the right-hand side. Do not make the mistake I did originally: Do not assume that min/max means the minimum and maximum values!]
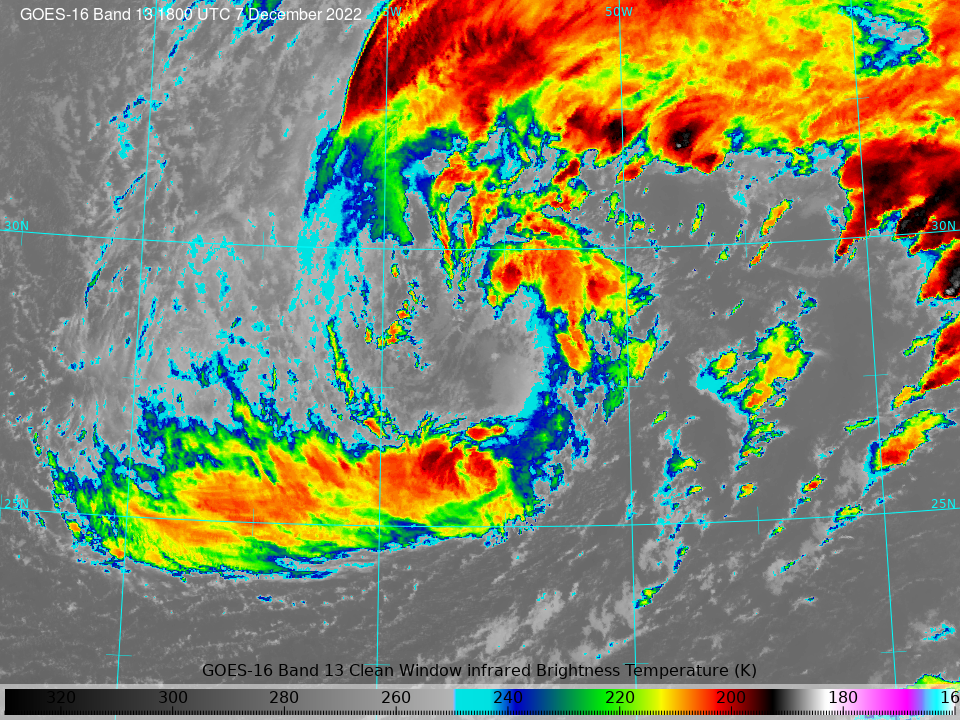
A couple things to note: Although ./add_coastlines.sh will add coastlines, lat/lon lines, rivers, etc., to every .tif file in a directory if you wildcard the linux entry that way, it will fail to add a colorbar if more than one .tif file is referenced. A user can create multiple subsections of the data with one geo2grid call; for example, one could create maps for all states surrounding Lake Michigan, and then create imagery for all of them using -g Wisconsin Indiana Illinois Michigan — if those are the names chosen for the different map projections (you also have to use –grid-configs to tell geo2grid where to find the .yaml files containing the projection values). To create a colorbar with correct upper and lower bounds, a user has to know the dynamic range of the variables. That can be found at the GOES-R website. Other CIMSS Satellite Blog entries on the software and coding aspects of geo2grid are here, here and here — in addition, a variety of blog posts showing examples of imagery created using Geo2Grid can be viewed in the Geo2Grid Category.
Geo2grid can be downloaded from this site (free registration may be required).
View only this post Read Less


